
 Open Access Article
 This Open Access Article is licensed under a Creative Commons Attribution-Non Commercial 3.0 Unported Licence
Synthesis and characterization of a rhodamine derivative as a selective switch-on fluorescent sensor for Cu2+ ions in aqueous PBS buffer and living cells†
Maheshkumar
Prajapati
a,
Nidhi
Pandey
b,
Sarita
Kalla
c,
Sateesh
Bandaru
*d and
Areti
Sivaiah
 *a
*a
aDepartment of Chemistry, Sardar Vallabhbhai National Institute of Institute, Surat-Dumas Road, Surat-395007, Gujarat, India. E-mail: areti@chem.svnit.ac.in
bDepartment of Chemical Engineering, Indian Institute of Technology Bombay, Powai-400076, Mumbai, India
cDepartment of Chemical Engineering, Sardar Vallabhbhai National Institute of Institute, Surat-Dumas Road, Surat-395007, Gujarat, India
dInstitute of Advanced Magnetic Materials, College of Materials and Environmental Engineering, Hangzhou Dianzi University, Hangzhou 310018, China. E-mail: sbandaru@hdu.edu.cn
First published on 14th February 2024
Abstract
A novel rhodamine-based receptor molecule (L1) was synthesized via the reaction between rhodamine hydrazide and acetylacetone. Several spectroscopic methods, viz., FTIR spectroscopy, 1H NMR and 13C NMR, and ESI-MS, were used to characterize the receptor molecule (L1). The L1 demonstrated turn-on response towards Cu2+ ions out of 18 different metal ions studied in an aqueous buffer at pH 7.4 with a minimum detection limit of 3.58 × 10⁻⁸ M. The binding interaction between L1 and Cu2+ ions was shown by absorbance studies, wherein isosbestic points were observed at 286 and 329 nm. Job's plots indicate the formation of a 1![[thin space (1/6-em)]](https://www.rsc.org/images/entities/char_2009.gif) :1 complex between L1 and Cu2+ ions. Additionally, DFT simulations show a strong interaction between the Cu2+ ions and the receptor L1, and TD-DFT investigations show an optical absorption shift in favor of a longer wavelength in the {L1 + Cu2+} complex. Further, the biological applicability of L1 for the in vitro detection of Cu2+ ions in L929 and HeLa living cells was demonstrated. These findings illustrated that L1 could be used to detect Cu2+ ions in environmental and biologically relevant media.
:1 complex between L1 and Cu2+ ions. Additionally, DFT simulations show a strong interaction between the Cu2+ ions and the receptor L1, and TD-DFT investigations show an optical absorption shift in favor of a longer wavelength in the {L1 + Cu2+} complex. Further, the biological applicability of L1 for the in vitro detection of Cu2+ ions in L929 and HeLa living cells was demonstrated. These findings illustrated that L1 could be used to detect Cu2+ ions in environmental and biologically relevant media.
Introduction
Copper is one of the most prominent transition-metal ions present in biological systems owing to its diverse functions.1–5 Copper is the third most common necessary transition-metal nutrient in the human body, after zinc and iron. The Cu2+ ion is a prerequisite for the synthesis of hemoglobin, and it acts as an indispensable cofactor for several metalloenzymes, including superoxide dismutase, tyrosinase, and cytochrome oxidase.6–10 Some of these processes are controlled by the copper concentration in a particular species. Therefore, the presence of Cu2+ ions in human tissue at its optimal concentration is crucial for a healthy life. If it is present, either at low or high concentrations in human tissue, it would result in deficiency syndromes and toxicity, respectively. This can cause a series of diseases such as Menkes disease, Alzheimer's disease, anemia, myelodysplasia, and leukopenia.11–17 Thus, considering the deleterious effect of high levels of Cu2+, the United States Environmental Protection Agency (EPA) prescribed 20 μM as the maximum contaminant level of Cu2+ in drinking water.18 Inductively coupled plasma-mass spectrometry (ICP-MS), atomic absorbance, colorimetry, flow injection, and electrochemical approaches are some of the current methods used for the measurement of Cu2+ ions.19–24 However, these methods are expensive, not readily available, and require highly specialized personnel. Therefore, the development of small-molecular fluorescent probes with high sensitivity and selective sensing of Cu2+ remain an important area of research.A chemosensor is a molecule that enables the conversion of an analyte's information into a detectable signal, which may appear as a visible colour change or fluorescence signal changes. Thus, considerable attention has been dedicated to develop chemosensors that offer effective sensing capabilities and precise detection of substances,25,26 including high sensitivity and selectivity, ease of operation, and quick response. Therefore, the fluorescent sensor approach has emerged as a practical and prominent method for metal ion detection.27,28 Hence, there is always a dire need to design and develop small-molecular receptors that can detect and image Cu2+ selectively using relatively easier techniques such as absorbance and fluorescence.29–33 In the past few decades, a variety of organic molecules such as rhodamine, coumarin–benzopyrylium, benzothiadiazole, anthracene, phenothiazine, and squaraine have been synthesized and are being studied as possible chemosensors that can detect a variety of metal ions.34–39 However, high detection limits, significant interference from other ions and lower wavelengths of excitation and emission when detecting Cu2+ are only a few of the drawbacks of several fluorescent molecular probes reported in the literature.
Among several fluorescent probes, rhodamine is used as one of the most promising fluorophore moieties for developing fluorescence sensors for ions and molecules. This is attributed to its unique features including longer excitation and emission wavelengths, high quantum yields, high photostability, and easy functionalization. Additionally, rhodamine conjugates exhibit a visual color change in the presence of analytes, enabling naked-eye detection.40–43 Furthermore, the fluorescence emission properties of rhodamine conjugates can be tuned by controlling their derivatization with appropriate molecules. These modified rhodamine derivatives have the potential to alter the selectivity and sensitivity of various analytes. As a result, rhodamine-based fluorescent probes have emerged as promising optical sensors due to their exceptional characteristics, which encompass both physicochemical and optical properties.44–47
The search for new receptor molecules that have excellent selectivity and can detect Cu2+ ions at very low concentrations remains an active and difficult task for synthetic chemists. Another challenging factor for synthetic chemists is the solubility of the receptor molecule in biological media. The fluorescence receptor reported in this study is capable of detecting copper at nanomolar levels in aqueous solutions. Rhodamine is used as the skeleton to make the derivative have longer excitation and emission wavelengths, high photostability, and easy functionalization. In addition, rhodamine conjugates display a visual color change in the presence of analytes, which provides an opportunity for naked-eye detection. Therefore, in this study, we synthesized and characterized a rhodamine-based receptor linked through an acetylacetone moiety. The selective recognition of L1 towards Cu2+ ions in the presence of several other metal ions in aqueous solutions was studied by absorption and fluorescence spectroscopy. The 1:1 {L1 + Cu2+} complex coordination was supported by a DFT computational study. The potential applicability of L1 in detecting Cu2+ ions was demonstrated in living cells.
Experimental section
Materials and methods
A Bruker NMR spectrometer was used to record the 1H and 13C NMR spectra, running at frequencies of 600 MHz and 100 MHz, respectively. Using Q-TOF micro mass (YA-105) equipment by the electrospray ionization method, ESI-MS analysis was carried out. A Carry Eclipse fluorescence spectrophotometer was used to record the fluorescence spectra and an IG-27DS Lab-Serve UV-visible spectrophotometer was used to record the absorbance spectra. The metal ions used for the fluorescence and absorbance titrations were purchased from Sigma-Aldrich and Sisco Research Laboratories Pvt Ltd. as their corresponding salts. Prior to use, solvents suitable for high-performance liquid chromatography (HPLC) were dried according to standard methods. The 1 cm quartz cell used for the fluorescence titrations has a 5 nm-wide slit. The phosphate buffer-acetonitrile solution (1:1) used in these experiments has a pH value of 7.4 and a concentration of 0.1 mM. The metal ion solutions were made in water. Throughout the trials, the concentration of the stock solutions of L1 remained constant at 1 mM. The solutions in the quartz cell were excited at 510 nm for fluorescence titrations, and a final cuvette concentration of L1 set at 10 μM in a total volume of 3 mL was reached by dilution with buffer. The scan speed was maintained at 600 nm min−1, and the excitation and emission slit widths were set at 5 nm each. For the tests, perchlorate salts of the metals, namely, Li+, Na+, Mg2+, Al3+, K+, Ca2+, Cr3+, Mn2+, Fe2+, Fe3+, Co2+, Ni2+, Cu+, Cu2+, Zn2+, Cd2+, Hg2+, and Pb2+ were used. Absorbance titration details are the same as those performed in fluorescence studies.
Synthesis and characterization of (L1)
In a 50 mL round-bottom flask, a mixture of P2 (0.62 g, 1.44 mmol, 1 eq.), acetylacetone (0.59 mL, 8.68 mmol, 6 eq.), ethanol (15 mL), and a catalytic amount of acetic acid was added. The reaction was refluxed at 100 °C overnight. When the reaction was completed and monitored through TLC, the solvent was removed by evaporation. The crude product was further purified using neutral alumina in an ethyl acetate:petroleum ether (20–40%) solvent system. The compound obtained in good yields was a light pink solid (0.45 g, yield: 60%). FT-IR (ATR, cm−1): 3425, 3343, 2921, 2849, 1719, 1609, 1514, 1425, 1344, 1265, 1197, 1013, 808, 733. 1H NMR (600 MHz, CDCl3) MHz δ (ppm): 7.98 (d, J = 6.78 Hz, 1H), 7.55 (m, 2H), 7.16 (d, J = 7.03 Hz, 1H), 6.34 (s, 2H), 6.25 (s, 2H), 3.52 (s, 2H), 3.19 (dq, J = 7.04; 1.34 Hz, 4H), 1.92 (s, 6H), 1.91 (s, 3H), 1.69 (s, 2H), 1.5 (s, 3H), 1.31 (t, J = 7.23 Hz, 6H); 13C NMR (150 MHz, CDCl3) MHz δ (ppm): 166.07, 163.38, 152.62, 150.73, 147.74, 133.45, 129.72, 128.55, 128.21, 124.45, 123.40, 117.84, 104.71, 96.84, 66.92, 38.32, 29.70, 28.92, 18.06, 16.74, 14.68. ESI-MS: observed for C31H34N4O3m/z = 511.52 [M + H]+, calculated for C31H34N4O3 = 510.64.
Synthesis and characterization of the {L1 + Cu2+} complex
In a 10 mL round-bottom flask, L1 (110 mg, 0.39 mmol, 1 eq.) was added to 5 mL ethanol and CuCl2·2H2O (66 mg, 0.58 mmol, 1.5 eq.) at room temperature (26 °C) and stirred for 1 hour. On the completion of the reaction, solid precipitates were filtered through the Buchner funnel. The pure product appeared red (50 mg, yield 47%). FT-IR (ATR, cm−1): 3358, 3319, 2983, 2868, 2585, 1653, 1605, 1514, 1307, 1230, 1183, 1009. 1HNMR (400 MHz, CDCl3) δ (ppm): 11.3 (s, 1H), 7.87 (s, 1H), 7.61 (b, 2H), 7.1 (s, 1H), 6.78 (m, 1H), 6.21 (s, 1H), 6.1 (s, 1H), 3.40 (b, 1H), 3.1 (s, 3H), 2.0 (s, 2H), 1.84 (m, 4H).Density functional theory (DFT) computation
DFT calculations were performed using Gaussian 09. The coordinates for the initial structure used for the DFT computation were generated using Gauss View 6.0. The optimization was carried out from PM6 to the DFT, and finally, the structure was optimized at the CAM-B3LYP level. The electronic structure calculations for these structures were modeled along with the mixed basis set using the ‘Gen’ keyword implemented in Gaussian 09. For the Cu atom, we chose the SDD basis set, while the remaining atoms were modeled using the 6-31G(d,p) basis set. Following geometry optimization, frequency calculations were also carried out on the optimized geometry at the same level of theory to assess the nature of stationary points, i.e., whether they are transition states (TS) or higher-order saddle points.Cell imaging study
L929 and HeLa cells were procured from the National Centre for Cell Science (NCCS), Pune, India. After trypsinization, cells were seeded into a 12-well plate and incubated at 37 °C in a humidified atmosphere of 5% CO2. The medium was removed, cells were washed with PBS buffer, and then 10 μM concentration of fluorescent probe L1 was added to each well and incubated for another 1 h. The confocal dishes were washed with PBS to remove excess L1 and fixed using 4% paraformaldehyde at 4 °C. To this, different concentrations of Cu2+ ions were added. The parameters of confocal images such as the excitation and emission ranges of DAPI and L1 are from 410 to 450 nm and 480 to 560 nm, respectively. For imaging purposes, the cells were washed with PBS buffer and then exposed to DAPI (1:100 dilutions) for 10 min to observe the cell morphology and integrity and further washed with PBS. The specimen samples were mounted on confocal dishes, and the images were taken at 63× magnification using a laser scanning confocal microscope (Zeiss LSM 780, Germany) at an excitation wavelength of 480 nm and an emission wavelength of 560 nm.
Results and discussion
Synthesis and characterization of probe L1
As illustrated in Scheme 1, the receptor molecule (L1) was synthesized via the well-known Schiff-base reaction, which involves combining rhodamine hydrazide with acetylacetone in the presence of a catalytic quantity of acetic acid in ethanol. P2 was synthesized by a previously reported method48via the condensation of P1 with hydrazine hydrate in an ethanol solvent. The receptor molecule (L1) and precursor were confirmed by various techniques such as 1H and 13C NMR, FTIR spectroscopy, and ESI-MS. The corresponding details of the synthesis and characterization data are given in the experimental section and the ESI† (Fig. S1 and S2). | ||
| Scheme 1 Design and synthesis of chemoreceptor L1. | ||
Absorption titration of L1 with metal ions
The metal ion binding nature of L1 was studied based on absorption titration in a 1 mM PBS buffer in an ACN/PBS mixture (v/v, 1:1%) at pH = 7.4. In the absence of metal ions, the receptor molecule (L1) exhibits a characteristic absorbance band of rhodamine positioned at 304 nm corresponding to the π–π* transition due to the closed spirolactam ring. The absorbance spectra of probe L1 (10 μM) was measured in the presence of various metal ions such as Li+, Na+, Mg2+, Al3+, K+, Ca2+, Cr3+, Mn2+, Fe2+, Fe3+, Co2+, Ni2+, Cu+, Cu2+, Zn2+, Cd2+, Hg2+, and Pb2+ (concentration up to 0–20 equivalents). However, the presence of Cu2+ ions only showed a significant change in the absorbance spectrum of L1, and a new band appeared in the UV-vis spectrum of L1 at 525 nm, as shown in Fig. 1a and b. The newly generated bands became more intense with the increase in the concentrations of Cu2+ metal ions in the solutions and attained a saturation point when the concentration was eight equivalents of Cu2+ ions. The emergence of the peak at 525 nm is likely attributed to the spirolactam ring of L1 opening up in the presence of Cu2+ ions and forming the {L1 + Cu2+} complex. Additionally, the absorbance of the 300 nm band decreases while that of the 350 nm band increases, resulting in the isosbestic points at 286 and 329 nm. These points signify that L1 has been converted to its bound {L1 + Cu2+} complex. From the obtained result, it can be concluded that L1 binds selectively to Cu2+. The absorbance spectra of L1 were not significantly altered by the presence of other metal ions (Fig. 1c and S4†). Furthermore, L1 showed a visible color change and a fluorescent color change under UV light at 365 nm in the presence of Cu2+ ions at different concentrations. The interaction between L1 and Cu2+ resulted in an association constant (Ka) of 0.2 × 10⁻⁵ M−1, which was derived using the Benesi–Hildebrand equation (Fig. S5†). Job's plots based on absorption data found a 1:1 complex between L1 and Cu2+ (Fig. S6†).
 | ||
| Fig. 1 Absorption spectra were obtained during the titration of L1 against Cu2+ in a 0.1 mM PBS:ACN solvent system. (a) L1 (10 μM) vs. Cu2+ (0–10 eq.), (b) plot of absorbance vs. {[Cu2+]/[L1]}mole ratio as a function of wavelength change at different absorption bands, and (c) plot of the change in absorbance at 525 nm (Ao–A) ΔA vs. metal ions. | ||
Fluorescence titration of L1 with metal ions
In order to explore the selectivity of the receptor system (L1) towards biologically and environmentally important metal ions, fluorescence titrations were carried out against 18 different metal ions in aqueous solutions. The receptor L1 molecule was excited at 510 nm and showed weak fluorescence at 550 nm due to a closed spirolactam ring. However, the presence of Cu2+ ions showed a gradual increase in fluorescence intensity at 550 nm band and finally attained a ∼28-fold fluorescence enhancement, as shown in Fig. 2a. The quantum yield of L1 is 0.021, which is enhanced by more than twenty times to 0.46 in the presence Cu2+ ions in fluorescence study using quinine bisulfate as the standard. This is due to L1 consisting of a five-membered spirolactam ring conjugated with acetylacetone suitable binding groups that participate in metal binding. In the presence of Cu2+ ions, spiro-ring opening through C–N bond cleavage followed by metal coordination through amide oxygen ‘O’, imine nitrogen ‘N’ and acetyl enol oxygen ‘O’ atoms result in observable color and fluorescence changes. Furthermore, other metal ions exhibited no significant change in the emission intensity of L1 (Fig. 2b). The relative fluorescence intensity (Io/I) vs. metal ion plot also demonstrates the selectivity of L1 towards Cu2+ ions (Fig. 2c). The limit of detection was found to be 3.58 × 10⁻⁸ M and this was enough to detect Cu2+ ions present in drinking water (20 μM set by the US EPA) (Fig. S7†). L1 showed a lower detection limit than other fluorescent probes reported in the literature for Cu2+ ions (Table S8†). The detection of Cu2+ by L1 was further demonstrated by observing a distinct naked eye color change from colorless to light pink only in the presence of Cu2+ ions in daylight. Additionally, under a hand-held UV lamp with a wavelength of 365 nm, L1 exhibited a greenish-yellow fluorescence (Fig. 2d). The other metal ions showed no recognizable color change, except that a very marginal color change was observed in case of Hg2+ ions, as shown in Fig. 2d. | ||
| Fig. 2 Fluorescence spectral traces for the titration of L1 against different metal ions in a 1 mM PBS:ACN solvent system. (a) Intensity vs. wavelength plot for L1 (λex = 510 nm) (10 μM) against Cu2+ (0–10 eq.) [inset: fluorescence intensity at 558 nm as a function of Cu2+ ion concentration], (b) relative fluorescence intensity (I/I0) vs. wavelength plot for L1 (10 μM) with different metal ions (100 μM), (c) histogram shows emission intensity of L1 with different metal ions at 558 nm and (d) photos of the visible color change (top) and fluorescent changes (bottom) of L1 in the presence of metal ions under UV light at 365 nm. | ||
In order to check the selective detection of L1 by Cu2+ ions in the presence of other interference metal ions, comparative fluorescence titrations were carried out. From the result (Fig. S9†), we found that fluorescence intensity returns to that {L1 + Cu2+} and no fluorescence quenching was observed, indicating specific binding of L1 towards Cu2+ even in the presence of other metal ions. To determine the optimal pH for {L1 + Cu2+}, complexation fluorescence titration was performed at different pH values, and it was found that in both cases, L1 and complex {L1 + Cu2+} exhibited high fluorescence in an acidic medium at pH up to 4. However, the {L1 + Cu2+} complex showed high and unaltered fluorescence emission at pH 5 to 12, whereas in the case of L1, low intensity and weak emission were observed in the pH range of 5–12 (Fig. S10†). These results indicated that probe L1 can be used for the detection of Cu2+ ions in the pH range of 5–12.
Synthesis of complex {L1 + Cu2+} and its isolation and characterization
The {L1 + Cu2+} complex was synthesized from a reaction between L1 and CuCl2·2H2O in methanol at room temperature. After 1 h, a precipitate was formed, which was filtered and subsequently dried under vacuum (Scheme 2). The isolated copper complex {L1 + Cu2+} was characterized using various techniques such as absorbance, emission, 1H and 13C NMR, powder XRD, FTIR spectroscopy, and ESI-MS. The isolated {L1 + Cu2+} complex spectral features, such as absorbance peaks at ∼525 nm and emission at 558 nm, are comparable with those of the in situ-generated complex species in solutions (Fig. 3a and b). This was further confirmed by comparing the L1 and {L1 + Cu2+} complex NMR spectra. The proton NMR signals corresponding to aromatic and aliphatic protons experience considerable broadening due to the complexation of Cu2+ ions, as can be noticed in Fig. S3.† The infrared spectra of L1 showed significant shifts in the vibrational frequencies of 2989 and 1635 upon binding to Cu2+ (Fig. 3c). The crystallization of L1 and {L1 + Cu2+} complex did not yield a single crystal appropriate for X-ray diffraction. Powder-XRD studies of both L1 and {L1 + Cu2+} complex indicated good crystallinity (Fig. 3d). | ||
| Scheme 2 Synthesis and probable reaction mechanism of the {L1 + Cu2+} complex. | ||
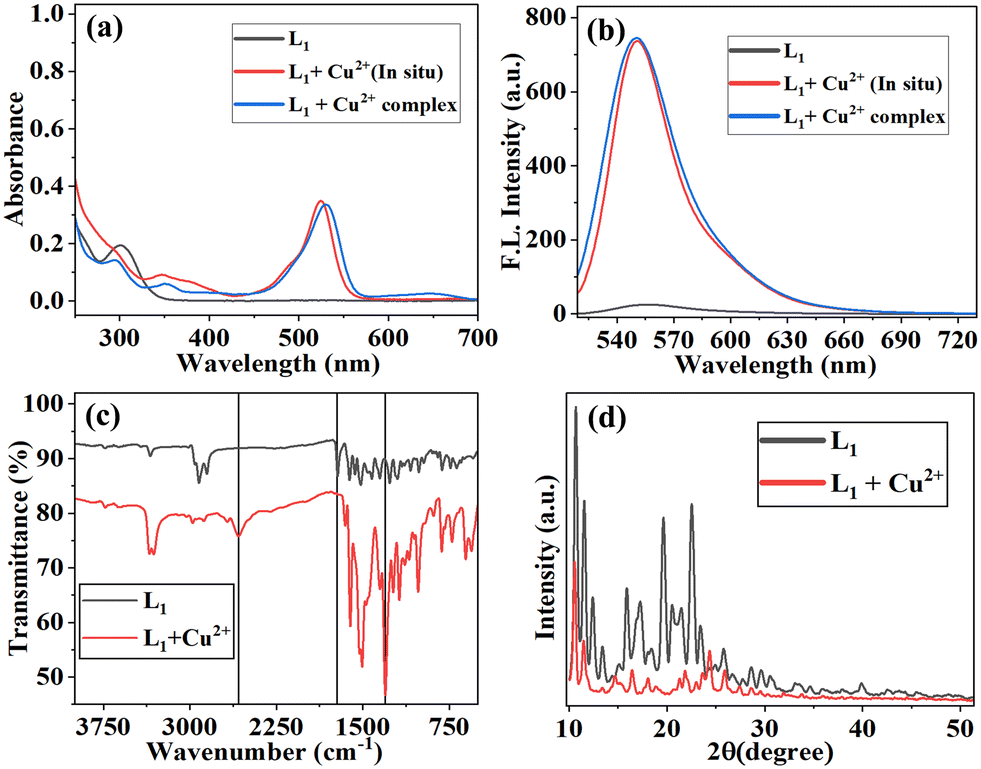 | ||
| Fig. 3 Characterization of the {L1 + Cu2+} complex. (a) UV-visible spectra of the {L1 + Cu2+} complex, (b) fluorescence spectra of the {L1 + Cu2+} complex, (c) FTIR spectra of L1 (black) and {L1 + Cu2+} (red) complex, and (d) powder-XRD pattern of L1 (black) and {L1 + Cu2+} complex (red). | ||
Coordination features of the {L1 + Cu2+} complex by DFT computation
The experimental study unequivocally supported the development of a 1:1 complex when Cu2+ ions bind to receptor L1. In order to delineate the coordination features of the {L1 + Cu2+} complex, DFT calculations were performed by Gaussian 09 using the M06L level of theory. The structure of L1 was used as the initial input and optimized at the CAM-B3LYP level of theory using the 6-31G(d,p) basis set and the corresponding optimized structure and highest occupied molecular orbital (HOMO) and lowest unoccupied molecular orbital (LUMO). Later, Cu2+ ions were positioned close to the binding arms of the –C![[double bond, length as m-dash]](https://www.rsc.org/images/entities/char_e001.gif) O and –N sites of L1 and relaxed to explain the Cu2+ ion binding capability towards both of these structures (Fig. 4a). The HOMO and LUMO of the corresponding Cu2+ ion addition complex {L1 + Cu2+} are shown in Fig. 4(b) and (c), respectively.
O and –N sites of L1 and relaxed to explain the Cu2+ ion binding capability towards both of these structures (Fig. 4a). The HOMO and LUMO of the corresponding Cu2+ ion addition complex {L1 + Cu2+} are shown in Fig. 4(b) and (c), respectively.
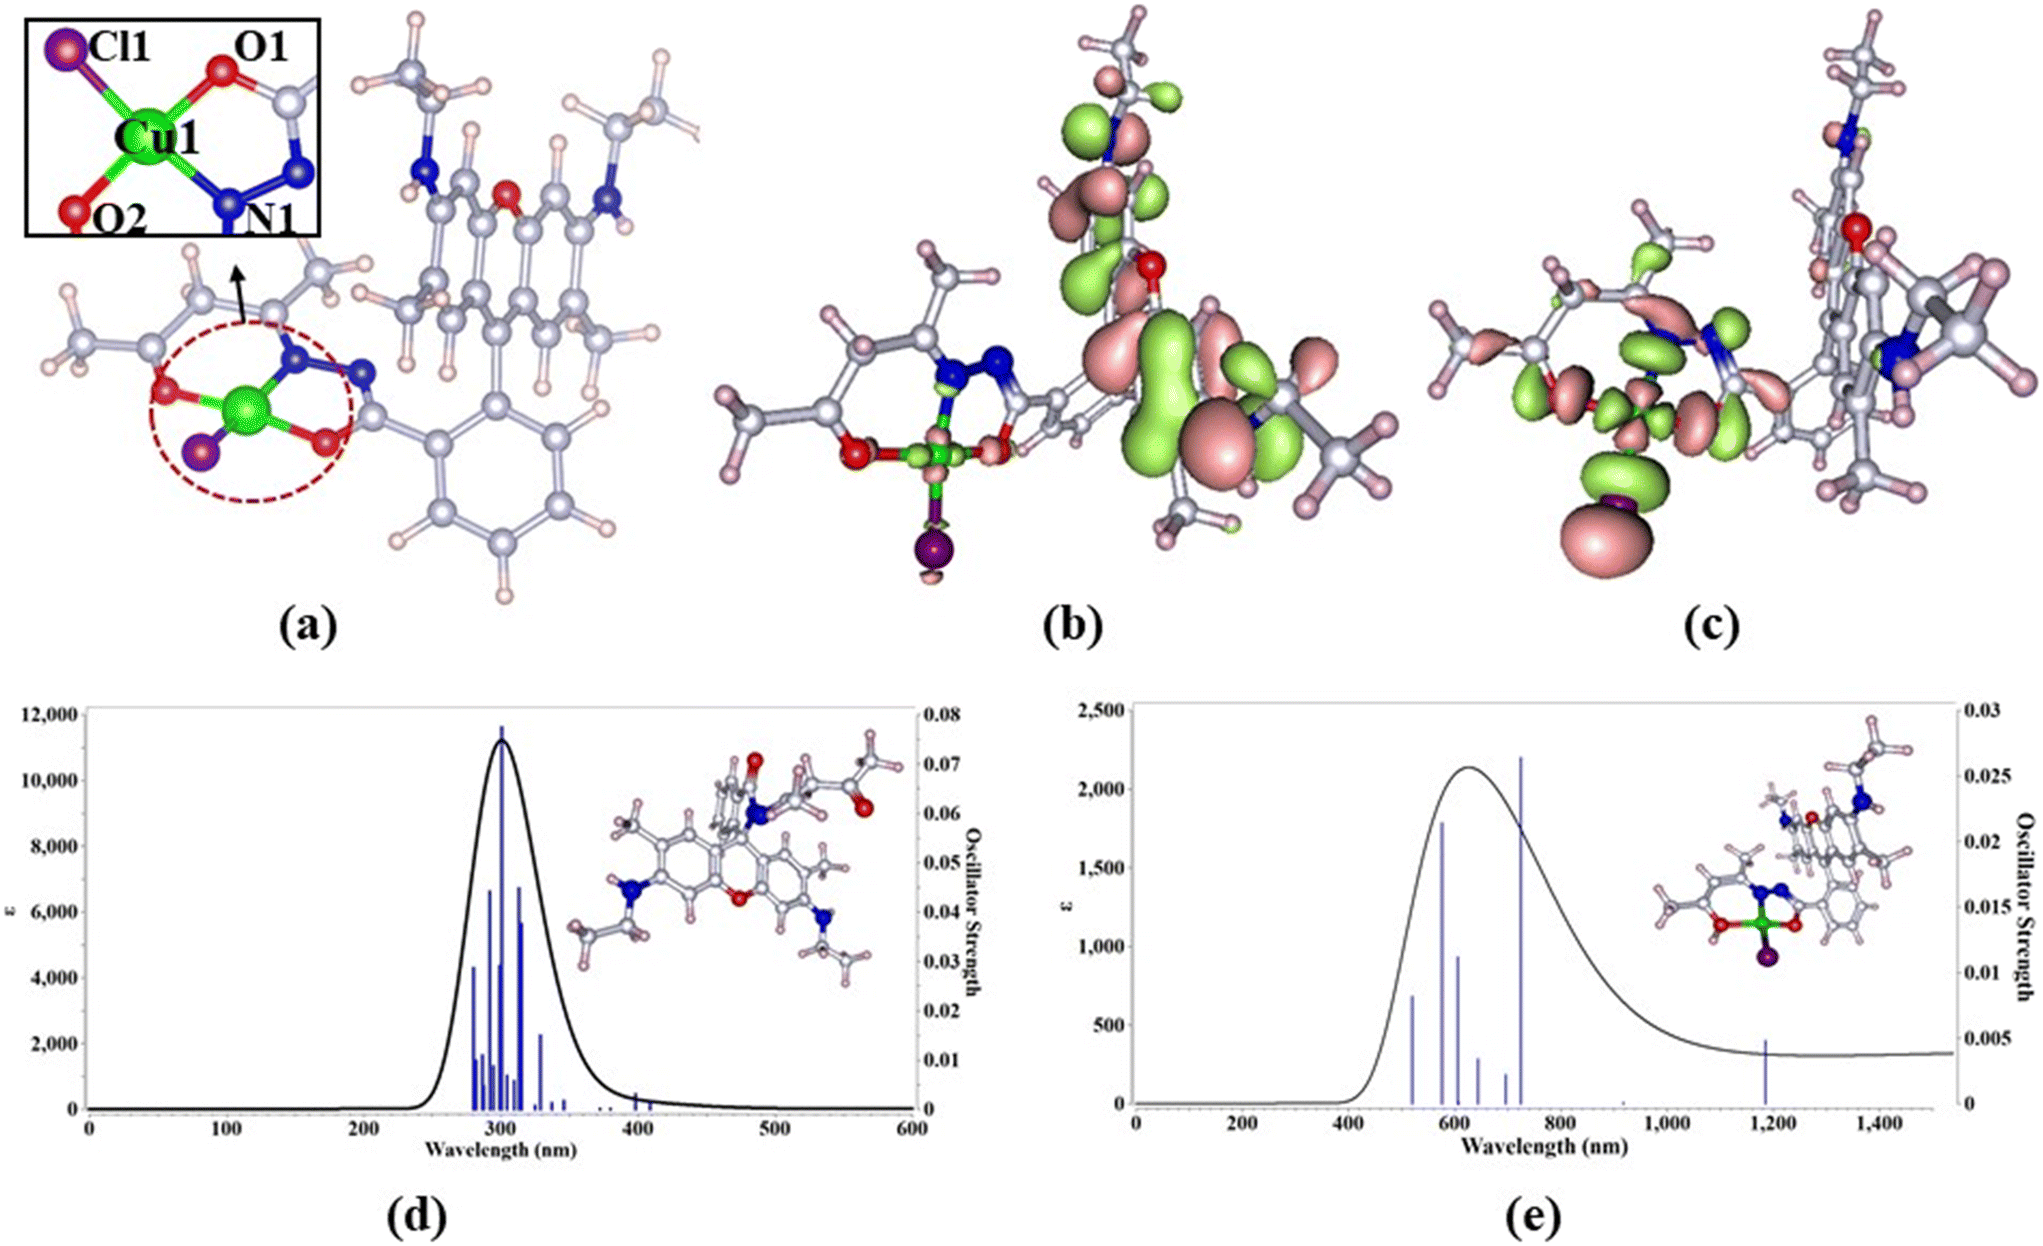 | ||
| Fig. 4 (a) CAM-B3LYP/Gen (6-31G(d,p) + SDD) optimized structure of {L1 + Cu2+} along with (b) HOMO and (c) LUMO orbitals, (d) TD-DFT absorption spectra of receptor L1, and (e) absorption spectra of {L1 + Cu2+} complex. | ||
In the complex {L1 + Cu2+}, the corresponding metal ion is bound to the conjugate through two oxygen centers (Cu–O1 and Cu–O2), a nitrogen center (Cu–N), and a chloride center (Cu–Cl), resulting in a four-coordinated complex. The Cu–O1 and Cu–O2 distances in these complexes are 1.85 Å and 1.96 Å, and the Cu–N and Cu–Cl distances in these complexes are 1.99 Å and 2.08 Å for Cu2+, respectively, indicating a substantially greater binding for Cu2+. The O1–Cu2+–O2 and Cl1–Cu–N1 angles (170° and 172°) in both situations deviate slightly from the anticipated square planar geometry despite the fact that the coordination number is four. It is clear from a comparison with the ideal geometry that the fitting to square planar geometry is preferable for Cu2+ centers. Therefore, the coordination cores in the {L1 + Cu2+} complex fit to a slightly warped square planar.
The HOMO–LUMO energy gaps are used to characterize the kinetic stability and chemical reactivity of the compounds. The HOMO and LUMO of receptor L1 are −5.09 eV and −0.86 eV, respectively, and the corresponding energy gap (ΔEH–L) is 4.23 eV. The HOMO and LUMO energies of the complex {L1 + Cu2+} formed upon the entry of Cu2+ into conjugation with receptor L1 are −10.38 eV and −9.93 eV, respectively, and the corresponding energy gap (ΔEH–L) is 0.45 eV. The low energy gap value denotes an easier charge transfer, which affects the sensor activity of the compounds. Due to the ease of donating an electron to the acceptor, soft receptors with small HOMO–LUMO gaps are more reactive and polarized than those with greater HOMO–LUMO gaps.
Additionally, the optical absorption spectra computed using the TD-DFT/CAM-B3LYP technique and performed in the gas phase are shown in Fig. 4d and e. The TD-DFT electronic absorption spectra of receptor L1 and the {L1 + Cu2+} complex are well featured. L1 exhibits an absorption band at 300 nm, and the enol form of {L1 + Cu2+} results in a band at ∼592.07 nm. The altered spectral characteristics of the complex {L1 + Cu2+} demonstrate the impact of intramolecular charge transfer and subsequent absorption at higher wavelengths. As a result, the {L1 + Cu2+} complex has a longer wavelength according to TD-DFT studies, which is in agreement with the experimental observations.
Intracellular sensing of Cu2+ by fluorescence microscopy
The biological applicability of L1 to detect Cu2+ in L929 and HeLa living cells was investigated using confocal fluorescence microscopy. The cytotoxic and optimal concentrations of L1 on HeLa and L292 cells were determined by the MTT assay. The cells were incubated with different doses of L1 (5–100 μM) for 24 h. Notably, it was observed that cells maintained their metabolism at all doses after 24 h of treatment. The metabolically formed formazan was dissolved in dimethyl sulfoxide, and the absorbance was measured at 570 nm. The cell viability is expressed as a percentage relative to the untreated control (100% cell viability). L1 exhibited 85% cell viability rate even at a concentration of 50 μM, whereas at higher concentrations, marginal cell death was observed (Fig. S11†). The L929 and HeLa cells were incubated in a buffer containing 5 μM of receptor probe L1 for 30 min. They displayed weak intracellular fluorescence due to the spirolactam ring being in the closed form as can be seen from Fig. 5. Upon addition of exogenous Cu2+ ion into cells through incubation with varying concentrations of Cu2+ ion (0 to 50 μM). At this stage, the cells were visualized using a fluorescence microscope with a DAPI filter and bright intracellular green fluorescence was observed in the cytoplasm and around the nucleus (Fig. 5). Even when L1 was incubated with HeLa cells followed by Cu2+ ion addition, cells exhibited intracellular green fluorescence emissions (Fig. S11†). The DIC image for each conducted experiment confirmed that cells were viable throughout the imaging study and the merged image provided evidence that the fluorescence is displayed through cells. These results indicated that L1 can permeate into cells and effective intracellular Cu2+ ion imaging revealed that L1 exhibits strong fluorescence.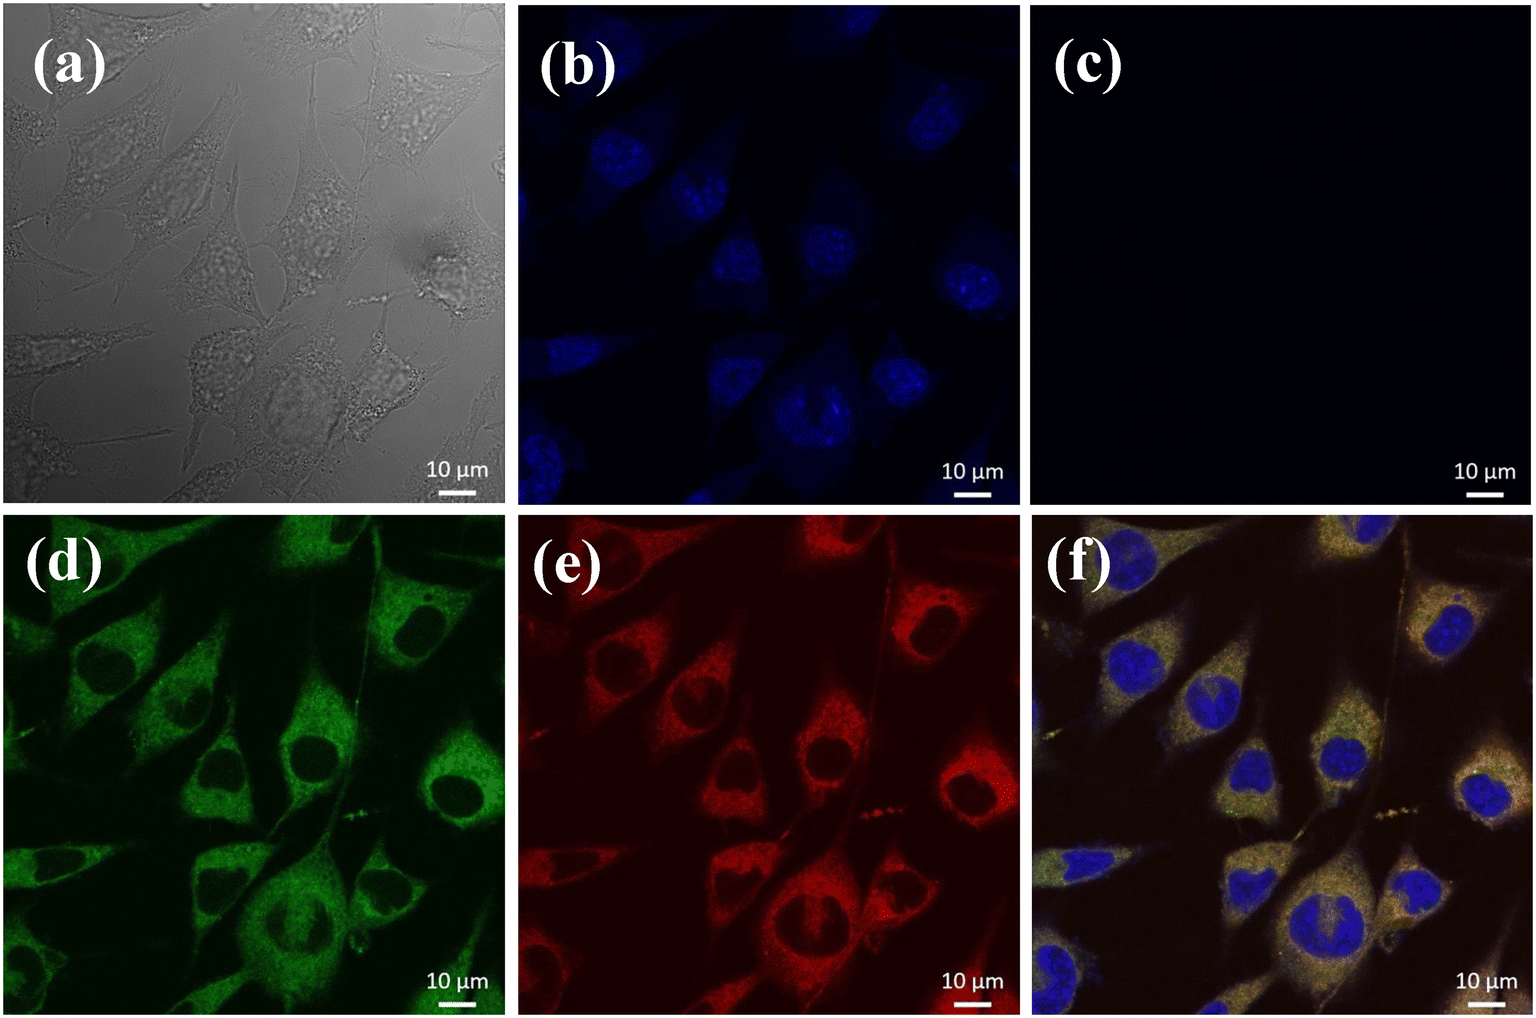 | ||
| Fig. 5 Confocal fluorescence microscopy images of L929 cells. (a) DIC image, (c) cells incubated only with L1 (10 μM), (d) cells treated with L1 followed by Cu2+ addition (20 μM) exhibiting green color and (e) red color, and (f) merged image of b–e. | ||
Conclusions
A novel and simple rhodamine-based receptor molecule (L1) was synthesized via the Schiff base reaction and characterized using various spectroscopic techniques, including FTIR spectroscopy, 1H and 13C NMR, and ESI-MS. In an aqueous buffer with a pH of 7.4, L1 demonstrates selectivity to Cu2+ ions among the different metal ions examined, indicating a 28-fold increase in fluorescence intensity. The receptor molecule exhibits a pink fluorescence color when Cu2+ is present among the other metal ions investigated under UV light at 365 nm. The L1 can detect Cu2+ ions up to the lowest concentration of 3.58 × 10⁻⁸ M in an aqueous buffer, which is well below the limit of 20 mM set by EPA for the Cu2+ concentration in drinking water. The interaction between L1 and Cu2+ was studied by absorbance spectra, wherein isosbestic points at 286 and 329 nm were observed. Job's plot absorption spectra corroborated the 1:1 complex formation between L1 and Cu2+ ions. DFT simulations provide more evidence for the formation of the {L1 + Cu2+} complex and the coordination cores in the {L1 + Cu2+} complex fit to a slightly distorted square planar. The computed HOMO–LUMO reduced energy gap value indicates a simpler charge transfer, which influences the activity of the compound's sensors. Longer wavelengths are absorbed into the visible area when Cu2+ ions are added to receptor L1, according to TD-DFT simulations. Further, the biological property of L1 was used to detect Cu2+ ions in living cells (L929 and HeLa) in biologically relevant media. As a result, the use of molecular receptor L1 may be extended to detect Cu2+ ions in biological tissues and in vivo.
Conflicts of interest
There are no conflicts to declare.Acknowledgements
A. S. gratefully acknowledges the financial support from the Sardar Vallabhbhai National Institute of Technology, Surat for a seed money/research grant. M. P. thanks SVNIT Surat for the fellowship. The authors acknowledge the services provided by the central facility at IIT Bombay for the confocal cell imaging studies.Notes and references
- D. T. Quang and J. S. Kim, Fluoro- and Chromogenic Chemodosimeters for Heavy Metal Ion Detection in Solution and Biospecimens, Chem. Rev., 2010, 110, 6280–6301 CrossRef CAS PubMed.
- X. Chen, Y. Zhou, X. Peng and J. Yoon, Fluorescent and Colorimetric Probes for Detection of Thiols, Chem. Soc. Rev., 2010, 39, 2120–2135 RSC.
- E. M. Nolan and S. J. Lippard, Tools and Tactics for the Optical Detection of Mercuric Ion, Chem. Rev., 2008, 108, 3443–3480 CrossRef CAS PubMed.
- J. S. Kim and D. T. Quang, Calixarene-Derived Fluorescent Probes, Chem. Rev., 2007, 107, 3780–3799 CrossRef CAS.
- A. K. Boal and A. C. Rosenzweig, Structural Biology of Copper Trafficking, Chem. Rev., 2009, 109, 4760–4779 CrossRef CAS PubMed.
- A. S. Murugan, N. Vidhyalakshmi, U. Ramesh and J. Annaraj, Chemical In Vivo Bio-Imaging Studies of Highly Selective, Sensitive Rhodamine Based Fl Uorescent Chemosensor for the Detection of Cu2+/Fe3+ Ions, Sens. Actuators, B, 2018, 274, 22–29 CrossRef.
- Z. Aydin, B. Yan, Y. Wei and M. A. Guo, Novel Near-Infrared Turn-on and Ratiometric Fluorescent Probe Capable of Copper(II) Ion Determination in Living Cells, Chem. Commun., 2020, 56, 6043–6046 RSC.
- V. M. Gil and J. S. Ferreira, Anemia and Iron Deficiency in Heart Failure, Rev. Port. Cardiol., 2014, 33, 39–44 CrossRef PubMed.
- D. G. Barceloux, Copper, J. Toxicol., Clin. Toxicol., 1999, 37, 217–230 CrossRef CAS PubMed.
- C. A. S. Pothulapadu, A. Jayaraj, N. Swathi, R. N. Priyanka and G. Sivaraman, Novel Benzothiazole-Based Highly Selective Ratiometric Fluorescent Turn-On Sensors for Zn2+ and Colorimetric Chemosensors for Zn2+, Cu2+, and Ni2+ Ions, ACS Omega, 2021, 6, 24473–24483 CrossRef CAS PubMed.
- N. Tang, T. D. Sandahl, P. Ott and K. P. Kepp, Computing the Pathogenicity of Wilson's Disease ATP7B Mutations: Implications for Disease Prevalence, J. Chem. Inf. Model., 2019, 59, 5230–5243 CrossRef CAS PubMed.
- S. Tiwari, V. Atluri, A. Kaushik, A. Yndart and M. Nair, Alzheimer's Disease: Pathogenesis, Diagnostics, and Therapeutics, Int. J. Nanomed., 2019, 14, 5541–5554 CrossRef CAS.
- Z. Tümer and L. B. Møller, Menkes Disease, Eur. J. Hum. Genet., 2010, 18, 511–518 Search PubMed.
- S. G. Kaler, ATP7A-Related Copper Transport Diseasesg-Emerging Concepts and Future Trends, Nat. Rev. Neurol., 2011, 7, 15–29 CrossRef CAS PubMed.
- S. Lutsenko, Atp7b-/- Mice as a Model for Studies of Wilson's Disease, Biochem. Soc. Trans., 2008, 36, 1233–1238 CrossRef CAS PubMed.
- S. Lee, Y. Liu and M. H. Lim, Untangling Amyloid-β, Tau, and Metals in Alzheimer's Disease, ACS Chem. Biol., 2013, 8, 856–865 CrossRef PubMed.
- P. Davies, P. C. McHugh, V. J. Hammond, F. Marken and D. R. Brown, Contribution of Individual Histidines to Prion Protein Copper Binding, Biochemistry, 2011, 50, 10781–10791 CrossRef CAS PubMed.
- H. Chen, J. Zhang, X. Liu, Y. Gao, Z. Ye and G. Li, Colorimetric Copper(II) Ion Sensor Based on the Conformational Change of Peptide Immobilized onto the Surface of Gold Nanoparticles, Anal. Methods, 2014, 6, 2580–2585 RSC.
- M. Corte Rodríguez, R. Álvarez-Fernández García, E. Blanco, J. Bettmer and M. Montes-Bayón, Quantitative Evaluation of Cisplatin Uptake in Sensitive and Resistant Individual Cells by Single-Cell ICP-MS (SC-ICP-MS), Anal. Chem., 2017, 89, 11491–11497 CrossRef PubMed.
- K. C. Chan, T. D. Veenstra and H. J. Issaq, Comparison of Fluorescence, Laser-Induced Fluorescence, and Ultraviolet Absorbance Detection for Measuring HPLC Fractionated Protein/Peptide Mixtures, Anal. Chem., 2011, 83, 2394–2396 CrossRef CAS PubMed.
- B. Meermann and V. Nischwitz, ICP-MS for the Analysis at the Nanoscale-a Tutorial Review, J. Anal. At. Spectrom., 2018, 33, 1432–1468 RSC.
- P. Singh, M. K. Singh, Y. R. Beg and G. R. Nishad, A Review on Spectroscopic Methods for Determination of Nitrite and Nitrate in Environmental Samples, Talanta, 2019, 191, 364–381 CrossRef CAS.
- N. Chailek, N. Kaewnok, A. Petdum, J. Sirirak, S. Chaneam, A. Kamkaew, S. Girdthep and N. Wanichacheva, Near Infrared and Colorimetric Fluorescence Sensor for Ultra-Selective Detection of Cu2+ Level with Applications in Diverse Water Samples, Brain Tumor Cell and Flow Injection Analysis, J. Photochem. Photobiol., A, 2021, 421, 113533 CrossRef CAS.
- B. K. Bansod, T. Kumar, R. Thakur, S. Rana and I. Singh, A Review on Various Electrochemical Techniques for Heavy Metal Ions Detection with Different Sensing Platforms, Biosens. Bioelectron., 2017, 94, 443–455 CrossRef CAS.
- D. Singh, D. Rajput and S. Kanvah, Fluorescent probes for targeting endoplasmic reticulum: design strategies and their applications, Chem. Commun., 2022, 58, 2413–2429 RSC.
- Y. Sasaki, R. Kubota and T. Minami, Molecular Self-Assembled Chemosensors and Their Arrays, Coord. Chem. Rev., 2021, 429, 213607 CrossRef CAS.
- J. Mao, L. Wang, W. Dou, X. Tang, Y. Yan and W. Liu, Tuning the Selectivity of Two Chemosensors to Fe(III) and Cr(III), Org. Lett., 2007, 9, 4567–4570 CrossRef CAS PubMed.
- J. F. Zhang, Y. Zhou, J. Yoon and J. S. Kim, Recent Progress in Fluorescent and Colorimetric Chemosensors for Detection of Precious Metal Ions (Silver, Gold and Platinum Ions), Chem. Soc. Rev., 2011, 40, 3416–3429 RSC.
- M. Annadhasan and N. Rajendiran, Highly Selective and Sensitive Colorimetric Detection of Hg(II) Ions Using Green Synthesized Silver Nanoparticles, RSC Adv., 2015, 5, 94513–94518 RSC.
- F. Hu, B. Zheng, D. Wang, M. Liu, J. Du and D. Xiao, A Novel Dual-Switch Fluorescent Probe for Cr(III) Ion Based on PET–FRET Processes, Analyst, 2013, 139, 3607–3613 RSC.
- W. He, R. Liu, Y. Liao, G. Ding, J. Li, W. Liu, L. Wu, H. Feng, Z. Shi and M. A. He, New 1,2,3-Triazole and Its Rhodamine B Derivatives as a Fluorescence Probe for Mercury Ions, Anal. Biochem., 2020, 598, 113690 CrossRef CAS PubMed.
- L. Bai, F. Tao, L. Li, A. Deng, C. Yan, G. Li and L. Wang, A Simple Turn-on Fluorescent Chemosensor Based on Schiff Base-Terminated Water-Soluble Polymer for Selective Detection of Al3+ in 100% Aqueous Solution, Spectrochim. Acta, Part A, 2019, 214, 436–444 CrossRef CAS PubMed.
- R. Joseph and C. P. Rao, Ion and Molecular Recognition by Lower Rim 1,3-Di-conjugates of Calix[4]arene as Receptors, Chem. Rev., 2011, 111, 4658–4702 CrossRef CAS.
- S. Areti, R. Nag and C. P. Rao, Glyco-Conjugate Design and Demonstration as Receptors for the Species of Biological, Ecological and Medical Importance: Support from Spectroscopy and Microscopy, ChemistrySelect, 2021, 6, 1–30 CrossRef.
- G. Attia, S. Rahali, S. Teka, N. Fourati, C. Zerrouki, M. Seydou, S. Chehimi, S. Hayouni, J. P. Mbakidi, S. Bouquillon, M. Majdoub and R. B. Chaabane, Anthracene Based Surface Acoustic Wave Sensors for Picomolar Detection of Lead Ions. Correlation between Experimental Results and DFT Calculations, Sens. Actuators, B, 2018, 276, 349–355 CrossRef CAS.
- H. He, X. Meng, L. Deng, Q. Sun, X. Huang, N. Lan and F. A. Zhao, Novel Benzothiadiazole-Based and NIR-Emissive Fluorescent Sensor for Detection of Hg2+ and Its Application in Living Cell and Zebrafish Imaging, Org. Biomol. Chem., 2020, 18, 6357–6363 RSC.
- G. Wang, W. Xu, H. Yang and N. Fu, Highly Sensitive and Selective Strategy for Imaging Hg2+ Using Near-Infrared Squaraine Dye in Live Cells and Zebrafish, Dyes Pigm., 2018, 157, 369–376 CrossRef CAS.
- M. Kaur, M. J. Cho and D. H. Choi, A Phenothiazine-Based “Naked-Eye” Fluorescent Probe for the Dual Detection of Hg2+ and Cu2+: Application as a Solid State Sensor, Dyes Pigm., 2016, 125, 1–7 CrossRef CAS.
- S. Pattaweepaiboon, W. Foytong, N. Phiromphu, T. Nanok, N. Kaewchangwat, K. Suttisintong and W. Sirisaksoontorn, Spirooxazine-Based Dual-Sensing Probe for Colorimetric Detection of Cu2+ and Fe3+ and Its Application in Drinking Water and Rice Quality Monitoring, ACS Omega, 2022, 7, 18671–18680 CrossRef CAS PubMed.
- X. Leng, D. Wang, Z. Mi, Y. Zhang, B. Yang and F. Chen, Novel Fluorescence Probe toward Cu2+ Based on Fluorescein Derivatives and Its Bioimaging in Cells, Biosensors, 2022, 12, 732 CrossRef CAS PubMed.
- M. Shellaiah, P. Venkatesan, N. Thirumalaivasan and S. Wu, Pyrene-Based Fluorescent Probe for “Off-on-Off” Sequential Detection of Cu2+ and CN− with HeLa Cells Imaging, Chemosensors, 2023, 11, 1–17 CrossRef.
- H. Xie, C. Yu, Y. Huang, H. Xu, Q. Zhang, X. Sun, X. Feng and C. Redshaw, Turn-off Fluorescent Probe for the Detection, Mater. Chem. Front., 2020, 4, 1500–1506 RSC.
- T. Simon, M. Shellaiah, V. Srinivasadesikan, C. Lin, F. Ko, K. W. Sun and M. Lin, Novel anthracene- and pyridine-containing Schiff base probe for selective “off–on” fluorescent determination of Cu2+ ions towards live cell application, New J. Chem., 2016, 40, 6101–6108 RSC.
- K. Ghosh, D. Tarafdar, A. Majumdar, C. G. Daniliuc, A. Samadder and A. R. Khuda-bukhsh, Dipicolylamine coupled rhodamine dyes: new clefts for highly selective naked eye sensing of Cu2+ and CN− ions, RSC Adv., 2016, 6, 47802–47812 RSC.
- S. Ghosh, N. Baildya and K. Ghosh, Dehydroabietylamine-Decorated Imino-Phenols: Supramolecular Gelation and Gel Phase Selective Detection of Fe3+, Cu2+ and Hg2+ Ions under Different Experimental Conditions, New J. Chem., 2022, 46, 8817–8826 RSC.
- K. Ghosh, T. Sarkar, A. Samadder and A. R. Khuda-Bukhsh, Rhodamine-Based Bis-Sulfonamide as a Sensing Probe for Cu2+ and Hg2+ Ions, New J. Chem., 2012, 36, 2121–2127 RSC.
- S. Zeng, X. Liu, Y. S. Kafuti, H. Kim, J. Wang, X. Peng, H. Li and J. Yoon, Fluorescent Dyes Based on Rhodamine Derivatives for Bioimaging and Therapeutics: Recent Progress, Challenges, and Prospects, Chem. Soc. Rev., 2023, 52, 5607–5651 RSC.
- Y. Xiang, A. Tong, P. Jin and Y. Ju, New Fluorescent Rhodamine Hydrazone Chemosensor for Cu(II) with High Selectivity and Sensitivity, Org. Lett., 2006, 8, 2863–2866 CrossRef CAS PubMed.
Footnote |
| † Electronic supplementary information (ESI) available: Supplementary data include synthesis and 1H and 13C NMR, ESI-MS characterization of P2 and L1 spectral data, fluorescence and absorption spectra, and computational data. See DOI: https://doi.org/10.1039/d3sd00291h |
| This journal is © The Royal Society of Chemistry 2024 |