 Open Access Article
Creative Commons Attribution 3.0 Unported Licence
A dual responsive novel bipyridyl carbohydrazide Schiff base as a colorimetric-fluorescent probe for In3+ and Al3+ ions and its potential applications†
Mujthaba
Aatif A.
 a,
Selva Kumar
R.
 b,
Leyana K.
Shaji
 a,
Pravin Kumar
Selvam
 a,
R.
Bhaskar
a,
S. Abdul
Majeed
c,
A. S. Sahul
Hameed
c and
S. K. Ashok
Kumar
a,
R.
Bhaskar
a,
S. Abdul
Majeed
c,
A. S. Sahul
Hameed
c and
S. K. Ashok
Kumar
 *a
*a
aDepartment of Chemistry, School of Advanced Sciences, Vellore Institute of Technology, Vellore – 632014, Tamil Nadu, India. E-mail: ashokkumar.sk@vit.ac.in
bDepartment of Chemistry, M. M. Engineering College, Maharishi Markandeshwar (Deemed to be University), Mullana, Ambala – 133207, Haryana, India
cAquatic Animal Health Laboratory, PG & Research Department of Zoology, C. Abdul Hakeem College (Autonomous), Melvisharam – 632509, Tamil Nadu, India
First published on 31st January 2024
Abstract
The development of a probe for the selective recognition of trivalent cations Al3+ and In3+ has recently received greater attention due to the crucial roles these metal ions play in many biotic and material processes. In this regard, [2,2′-bipyridine] 6,6′-dicarbohydrazide has been designed to synthesize a Schiff-base (L) using diethyl amino salicylaldehyde for the selective detection of Al3+ and In3+. The probe L exhibits selective colorimetric response at 444 nm with In3+ and turn-on fluorescence response at 497 nm with Al3+ in DMSO![[thin space (1/6-em)]](https://www.rsc.org/images/entities/char_2009.gif) :
:![[thin space (1/6-em)]](https://www.rsc.org/images/entities/char_2009.gif) H2O (7
H2O (7![[thin space (1/6-em)]](https://www.rsc.org/images/entities/char_2009.gif) :
:![[thin space (1/6-em)]](https://www.rsc.org/images/entities/char_2009.gif) 3, pH = 7.4). The probe L could form a 1
3, pH = 7.4). The probe L could form a 1![[thin space (1/6-em)]](https://www.rsc.org/images/entities/char_2009.gif) :
:![[thin space (1/6-em)]](https://www.rsc.org/images/entities/char_2009.gif) 2 [L
2 [L![[thin space (1/6-em)]](https://www.rsc.org/images/entities/char_2009.gif) :
:![[thin space (1/6-em)]](https://www.rsc.org/images/entities/char_2009.gif) M] stoichiometry complex confirmed by Job's plot and ESI mass analysis with an estimated association constant of 9.38 × 10³ M−2 and 4.75 × 10⁴ M−2 with Al3+ and In3+ ions, respectively. The probe could detect Al3+ and In3+ down to 10.98 nM and 110 nM without much interference from other common interfering ions. Inhibition of C
M] stoichiometry complex confirmed by Job's plot and ESI mass analysis with an estimated association constant of 9.38 × 10³ M−2 and 4.75 × 10⁴ M−2 with Al3+ and In3+ ions, respectively. The probe could detect Al3+ and In3+ down to 10.98 nM and 110 nM without much interference from other common interfering ions. Inhibition of C![[double bond, length as m-dash]](https://www.rsc.org/images/entities/char_e001.gif) N isomerization and chelation-enhanced fluorescence (CHEF) could be induced to vary the photophysical properties of L upon interaction with Al3+, whereas, the L with In3+, exhibits ligand-to-metal charge transfer (LMCT) due to the presence of vacant f-orbitals. The binding mechanism of probe L with metal ions was investigated using 1H NMR, mass, and DFT studies. More importantly, the potential application of probe L could be used to quantify Al3+ and In3+ in water samples and Al3+ in DrG cells and a zebrafish in vivo imaging model.
N isomerization and chelation-enhanced fluorescence (CHEF) could be induced to vary the photophysical properties of L upon interaction with Al3+, whereas, the L with In3+, exhibits ligand-to-metal charge transfer (LMCT) due to the presence of vacant f-orbitals. The binding mechanism of probe L with metal ions was investigated using 1H NMR, mass, and DFT studies. More importantly, the potential application of probe L could be used to quantify Al3+ and In3+ in water samples and Al3+ in DrG cells and a zebrafish in vivo imaging model.
1. Introduction
Developing a selective chemosensor capable of detecting group IIIA trivalent metal ions such as Al3+, Ga3+, and In3+ has attracted researchers' attention, as these metal ions play an extensive vital role in several biological and environmental processes.1,2 Al is widely used in manufacturing, construction, and food packing materials. Besides, Al salts are used in drinking water purification and pharmaceutical drugs.3,4 Secondly, indium, a lustrous and malleable metal, has been widely employed in various industrial applications, including transparent electrically conductive coatings and gas sensors.5,6 Due to its wide range of applications, it might readily accumulate in the human body and become poisonous to humans.7 Several chemosensors for group IIIA metal ions have been developed, but many cannot discriminate between Ga3+, Al3+, and In3+ because of their similar chemical properties.8–12Current analysis techniques, such as atomic absorption spectrometry (AAS), inductively coupled plasma-optical emission spectrometry (ICP-OES),13 inductively coupled plasma mass spectrometry (ICP-MS),14 liquid chromatography-mass spectrometry (LC-MS),15 and ion-chromatography,16 have been developed for the detection of Al3+ and In3+. However, these techniques involve complicated sample pre-treatment procedures, well-controlled experimental conditions, and additional reagents required. In order to overcome these difficulties, chromogenic and fluorogenic sensor-based methods are examined, which exhibit many advantages, such as simplicity, high sensitivity, selectivity, and affordability in industry and academic labs. On the other hand, a new dual-chemosensor could reduce the cost of sensing material and the time required for developing an additional chemosensor. A dual chemosensor can detect two distinct species by varying the photophysical properties.17,18 This would allow for the simultaneous monitoring of analytes and the improvement of the two most significant properties of the sensors, selectivity and sensitivity, which are both critical.19–25
It is well known in the literature that carbohydrazide with substituted salicylaldehyde Schiff base ligands are excellent sensors for metal ion recognition.26,27 Our recent studies found that the 1,10-phenanthroline and pyridine based ligand system showed excellent sensing ability with Al3+, In3+, and Th4+ ions.28–30 Continuing the earlier design, the bipyridine at the 2,9 position attached with the semi carbohydrazide linked 4-(diethylamino)salicylaldehyde Schiff base L. Probe L exhibits two different photophysical properties.
The probe L exhibits a noticeable absorption spectral change toward In3+ and fluorescence enhancement toward Al3+. Importantly, L can detect Al3+ and In3+ in different ways, such as spectrophotometric and spectrofluorometric, as well as colourimetric. Various spectroscopic methods and theoretical calculations have suggested the sensing mechanism of L towards Al3+ and In3+ ions.
2. Experimental section
2.1 Materials and methods
To synthesize the designed probe L the following materials are required: 6,6′-dimethyl-2,2′-bipyridine, diethylamino salicylaldehyde, selenium dioxide, and hydrazine hydrate, which were purchased from Sigma Aldrich and TCI chemical. All metal nitrate salts of SD Fine and Sigma Aldrich were used for preparing stock solutions. All solvents of reagent grade were purchased from Merck Chemical India and used without further purification. The absorbance and fluorescence spectra were recorded using a 1 cm quartz cell with a JASCO V-730 spectrophotometer and JASCO FP-8200 spectrofluorometer. A Shimadzu Affinity FT-IR spectrometer was used to record infrared spectra between 4000 cm−1 and 400 cm−1. The NMR spectra were acquired with a 400 MHz Bruker Avance NMR spectrometer with tetramethylsilane (TMS) as an internal standard. A Waters QTOF mass spectrometer was used to obtain the ESI-TOF mass analysis.2.2 Synthesis of probe L
As shown in Scheme 1, the synthesis of probe L was accomplished in four steps involving the use of several intermediates such as [2,2′-bipyridine]-6,6′-dicarboxylic acid (BPy-COOH), dimethyl [2,2′-bipyridine]-6,6′-dicarboxylate (BPy-OMe), and [2,2′-bipyridine]-6,6′-dicarbohydrazide (BPy-Hyz). In the first step, 6,6′-dimethyl-2,2′-bipyridine (BPy-DM) (1.17 g, 0.006 mol) was suspended in 100 mL of water, and to this solution, potassium permanganate (6.55 g, 0.042 mol) was added. The resulting mixture was heated at 100 °C for 15 h; this mixture was allowed to settle at room temperature, a brown precipitate was removed by filtering, and the filtrate was extracted three times with diethyl ether. The combined aqueous solution was acidified to a pH of 2.0 using 1 M hydrochloric acid, resulting in a white precipitate (BPy-COOH) recovered by filtration with a yield of 67% (1.05 g).31 In the second step, a stirred solution of BPy-COOH (1.00 g, 0.004 mol) in methanol was slowly added to thionyl chloride (5 mL) and stirred for about 6 h at 60 °C and the as-formed mixture was quenched in ice-cold water; it generates a white solid precipitate (BPy-OMe) with a yield of 70% (0.70 g).31 In the third step, BPy-OMe (0.58 g, 0.003 mol) was dissolved in absolute ethanol (20 mL), and to this solution, 1 mL hydrazine hydrate (99%) was added, and the reaction mixture was refluxed for 5 h at 70 °C, after completing the reaction, cooled to room temperature, and finally poured into ice-cold water, yielding an off-white solid precipitate, filtered and rinsed with water. Finally, the product (BPy-Hyz) was recrystallized using a chloroform and ethanol (1![[thin space (1/6-em)]](https://www.rsc.org/images/entities/char_2009.gif) :
:![[thin space (1/6-em)]](https://www.rsc.org/images/entities/char_2009.gif) 1) mixture with a yield of 89%. In the final step, BPy-Hyz (0.215 g, 1 equiv.) was dissolved in a solvent mixture containing ethanol and dimethyl sulfoxide (7
1) mixture with a yield of 89%. In the final step, BPy-Hyz (0.215 g, 1 equiv.) was dissolved in a solvent mixture containing ethanol and dimethyl sulfoxide (7![[thin space (1/6-em)]](https://www.rsc.org/images/entities/char_2009.gif) :
:![[thin space (1/6-em)]](https://www.rsc.org/images/entities/char_2009.gif) 3, v/v). To this solution 4-(diethylamino)salicylaldehyde (0.335 g, 2.1 equiv.) containing a catalytic amount of acetic acid was added. The reaction mixture was stirred at 100 °C for about 5 h. After the completion of the reaction, the solid product was filtered and washed with ethanol to obtain the pure product appearing as a pale-yellow solid (L) with a yield of 96%.
3, v/v). To this solution 4-(diethylamino)salicylaldehyde (0.335 g, 2.1 equiv.) containing a catalytic amount of acetic acid was added. The reaction mixture was stirred at 100 °C for about 5 h. After the completion of the reaction, the solid product was filtered and washed with ethanol to obtain the pure product appearing as a pale-yellow solid (L) with a yield of 96%.
All synthesized compounds were characterized by NMR (1H, 13C), FTIR, and mass analysis: Py-COOH (C12H8N2O4): 1H NMR: (400 MHz, DMSO-d6) (Fig. S1†): δ 8.70 (d, J= 7.6 Hz, 2H), 8.15 (d, J = 7.72 Hz, 2H), 8.11 (t, J = 7.6 Hz, 2H). 13C NMR: (100 MHz, DMSO-d6) (Fig. S2†): 166.37, 154.90, 148.52, 139.40, 125.71, and 124.57. HR-MS [M + H]+ (Fig. S3†): calculated mass 245.0557 and obtained mass 245.0510.
BPy-OMe (C14H12N2O4): 1H NMR: (400 MHz, DMSO-d6) (Fig. S4†): δ 8.63 (d, J= 7.2 Hz, 2H), 8.23 (d, J = 7.6 Hz, 2H), 8.19 (t, J = 7.2 Hz, 2H), 3.95 (s, 6H). 13C NMR: (100 MHz, DMSO-d6) (Fig. S5†): 165.48, 155.06, 147.83, 139.60, 126.02, 124.61, and 53.10. HR-MS [M + H]+ (Fig. S6†): calculated mass 273.0870 and obtained mass 273.0871.
BPy-Hyz (C12H12N6O2): 1H NMR: (400 MHz, DMSO-d6) (Fig. S7†): δ 10.22 (s, 2H), 9.04 (d, J = 7.6 Hz, 2H), 8.07 (t, J = 7.6 Hz, 2H), 8.0 (d, J = 8 Hz, 2H) 4.57 (s, 4H). 13C NMR: (100 MHz, DMSO-d6) (Fig. S8†): 162.99, 154.08, 149.78, 139.16, 124.36, and 122.73. HR-MS [M + H]+ (Fig. S9†): calculated mass 273.1095 and obtained mass 273.1033.
L (C34H38N8O4): 1H NMR: (400 MHz, DMSO-d6) (Fig. S10†): δ 12.00 (s, 2H), 11.48 (s, 2H), 9.18 (d, J = 7.6 Hz, 2H), 8.75 (s, 2H), 8.30 (d, J = 8 Hz, 2H), 8.26 (t, J = 6.8 Hz, 2H), 7.26 (d, J = 8.8 Hz, 2H), 6.32 (d, J = 8.8 Hz, 2H), 6.16 (s, 2H), 3.41 (q, J = 7.2 Hz, 8H), 1.14 (t, J = 7.2 Hz, 12H). 13C NMR: (100 MHz, DMSO-d6) (Fig. S11†) 160.36, 159.95, 154.05, 152.42, 150.85, 149.67, 139.53, 132.22, 125.03, 123.70, 106.95, 104.31, 97.99, 44.31, 13.02. FTIR (ATR, cm−1) (Fig. S12†): 3271 (–OH), 3091 (–NH), 2972 (Ar–CH), 1660 (C![[double bond, length as m-dash]](https://www.rsc.org/images/entities/char_e001.gif) O), 1629 (C
O), 1629 (C![[double bond, length as m-dash]](https://www.rsc.org/images/entities/char_e001.gif) C), 1513 (C
C), 1513 (C![[double bond, length as m-dash]](https://www.rsc.org/images/entities/char_e001.gif) N), 1245 (C–N), 1130 (C–O). HR-MS [M + H]+ (Fig. S13†): calculated mass 623.3089 and obtained mass 623.3073.
N), 1245 (C–N), 1130 (C–O). HR-MS [M + H]+ (Fig. S13†): calculated mass 623.3089 and obtained mass 623.3073.
2.3 Computational study
The Gaussian 09 computational program was used for all DFT/TD-DFT computations based on the hybrid exchange-correlation functional B3LYP.32–34 The main group elements (C, H, N, and O) were calculated using the conventional 6-311G** basis set, whereas Al and In were computed using the LanL2DZ effective core potential (ECP).35–37 There was no imaginary frequency in vibrational frequency calculations for the optimized geometries of L, L + Al3+, and L + In3+, indicating that these geometries reflect local minima. The solvent impact of water was incorporated in all computations using Cossi and Barone's CPCM (conductor-like polarizable continuum model).38,39 TD-DFT was performed in the ground state geometries of L, L + Al3+, and L + In3+ to explore the electronic properties of singlet excited states.40 Twenty singlet states were computed and investigated. Chemission 4.1 was used to calculate molecular orbital contributions in electronic transitions.412.4 UV-vis and fluorescence spectral study
Initially, a 1 mM stock solution of probe L was made in dimethyl sulfoxide (DMSO), and a working concentration solution was prepared in DMSO![[thin space (1/6-em)]](https://www.rsc.org/images/entities/char_2009.gif) :
:![[thin space (1/6-em)]](https://www.rsc.org/images/entities/char_2009.gif) H2O (7
H2O (7![[thin space (1/6-em)]](https://www.rsc.org/images/entities/char_2009.gif) :
:![[thin space (1/6-em)]](https://www.rsc.org/images/entities/char_2009.gif) 3 v/v, 10 mM HEPES buffer, pH 7.4). The steady-state absorption and fluorescence spectral response have been recorded at room temperature in the absence and presence of selected metal ions. For all sensing studies, nitrate salts of various metals such as Al3+, In3+, Zn2+, Cd2+, K+, Pb2+, La3+, Bi3+, Ni2+, Na+, Fe3+, Ca2+, Mn2+, Eu3+, Mg2+, Hg2+, Cu2+, Co2+, Ag+, Cr3+, UO22+, and Th4+ were used.
3 v/v, 10 mM HEPES buffer, pH 7.4). The steady-state absorption and fluorescence spectral response have been recorded at room temperature in the absence and presence of selected metal ions. For all sensing studies, nitrate salts of various metals such as Al3+, In3+, Zn2+, Cd2+, K+, Pb2+, La3+, Bi3+, Ni2+, Na+, Fe3+, Ca2+, Mn2+, Eu3+, Mg2+, Hg2+, Cu2+, Co2+, Ag+, Cr3+, UO22+, and Th4+ were used.
2.5 In vitro cytotoxicity study
The DrG cell line was obtained from the Access Centre of the National Repository for fish cell lines from C. Abdul Hakeem College (Autonomous), Tamil Nadu, India. The cells were grown in Leibovitz's L-15 (GIBCO) medium with antibiotics (100 mg mL−1 Kanamycin and 2.5 mg mL−1 Fungizone) and 10% fetal bovine serum (FBS). Cells were kept at 28 °C in a BOD incubator. Following harvest, the cells were planted at 2 × 10⁴ cells per well in 96-well tissue culture plates and cultured overnight at 28 °C. The media were withdrawn after incubation, and the cells were subjected for 24 h to a medium containing 0 (control), 10, 20, 30, 40, 50, and 60 μM probe L. MTT and NR tests were used to determine the cytotoxicity of probe L.42,432.6 Cellular imaging
The DrG cells were cultured in six-well cell culture plates. Cells were transferred to serum-free L-15 media with Al3+ (50 μM and 100 μM) and incubated for 30 min, and then cells were washed with fresh L-15 medium to remove the excess Al3+. After flowing, cells were exposed to different concentrations of probe L in the labeled wells and incubated again for 30 min. Finally, cells were washed thrice with serum-free media for five minutes each. Then, the cells were subsequently dyed with 4′,6-diamidino-2-phenylindole (DAPI) mounting media, and the morphology was captured at 200× magnification using a fluorescence microscope (Carl Zeiss, Germany).442.7 In vivo tracing of Al3+ in zebrafish larvae
Zebrafish were kept at 28 °C and were kept under ideal breeding conditions. Both male and female zebrafish were held in the same tank at 28 °C in a 12 h light/12 h dark cycle, and egg spawning was initiated by providing light stimulation. E3 embryo media were used to keep zebrafish larvae alive for 30 min at 28 °C; newly born zebrafish larvae were exposed to 50 and 100 μM of Al3+ in an aqueous solution. The solution was then withdrawn, and the larvae were washed three times with 2 mL of deionized water to remove excess Al(NO3)3 salt. The larvae were then incubated for 30 min. at 28 °C in an aqueous solution containing 20 and 40 μM of L, and the E3 solution was removed after three washes with deionized water. The larvae were then viewed, and photographs were captured using a fluorescence microscope (Carl Zeiss, Germany).452.8 Declarations: ethics approval
All animal procedures were performed in accordance with the Guidelines for Care and Use of Laboratory Animals of C. Abdul Hakeem College and approved by the Animal Ethics Committee of 1011/PO/Re/S/06/CPCSEA.3. Results and discussion
The desired probe L was synthesized by a reaction between BPy-Hyz and 4-(diethylamino)salicylaldehyde in an EtOH and DMSO (7![[thin space (1/6-em)]](https://www.rsc.org/images/entities/char_2009.gif) :
:![[thin space (1/6-em)]](https://www.rsc.org/images/entities/char_2009.gif) 3, v/v) solvent mixture with acetic acid as an acid catalyst. The probe L was characterized by 1H NMR, FTIR, and HR-mass analysis. It contains characteristic functional groups such as imine, hydroxyl, and carbonyl involved in binding with Al3+ and In3+, while the 4-(diethylamino)-2-hydroxy imine acts as a signaling unit for fluorescence. The electronegativity of Al3+ and In3+ is almost the same, so both are Lewis acids. Therefore, binding between L and the analyte (Al and In) could follow Pearson's HSAB theory, and the reversibility of the complex is moderate. Hence, L is selected as a suitable sensing material for Al and In.
3, v/v) solvent mixture with acetic acid as an acid catalyst. The probe L was characterized by 1H NMR, FTIR, and HR-mass analysis. It contains characteristic functional groups such as imine, hydroxyl, and carbonyl involved in binding with Al3+ and In3+, while the 4-(diethylamino)-2-hydroxy imine acts as a signaling unit for fluorescence. The electronegativity of Al3+ and In3+ is almost the same, so both are Lewis acids. Therefore, binding between L and the analyte (Al and In) could follow Pearson's HSAB theory, and the reversibility of the complex is moderate. Hence, L is selected as a suitable sensing material for Al and In.
3.1 Visual naked-eye detection
To evaluate the colourimetric sensing ability of probe L, the naked-eye detection of various metal ions such as Al3+, In3+, Zn2+, Pb2+, La3+, Bi3+, Ni2+, Na+, Ca2+, Mn2+, Eu3+, Mg2+, K+, Hg2+, Fe3+, Cu2+, Co2+, Ag+, Cr3+, Cd2+, UO22+ and Th4+ (10 equiv.) was carried out in DMSO![[thin space (1/6-em)]](https://www.rsc.org/images/entities/char_2009.gif) :
:![[thin space (1/6-em)]](https://www.rsc.org/images/entities/char_2009.gif) H2O (7
H2O (7![[thin space (1/6-em)]](https://www.rsc.org/images/entities/char_2009.gif) :
:![[thin space (1/6-em)]](https://www.rsc.org/images/entities/char_2009.gif) 3, pH = 7.4) solvent media under natural and UV light (Fig. 1a and b). The neat probe L is colourless, while metal ions such as Al3+, Cu2+, and In3+ with probe L exhibit pale yellow and intense yellow colors, respectively. Further, under UV light, only the vial containing Al3+ exhibits highly intense cyan colour fluorescence upon reaction with probe L. This simple test clearly shows dual sensing behaviour regarding the chromogenic and fluorogenic nature of L with boron family members.
3, pH = 7.4) solvent media under natural and UV light (Fig. 1a and b). The neat probe L is colourless, while metal ions such as Al3+, Cu2+, and In3+ with probe L exhibit pale yellow and intense yellow colors, respectively. Further, under UV light, only the vial containing Al3+ exhibits highly intense cyan colour fluorescence upon reaction with probe L. This simple test clearly shows dual sensing behaviour regarding the chromogenic and fluorogenic nature of L with boron family members.
 | ||
Fig. 1 Visible colour change of probe L (1 × 10⁻⁵ M) with (10 equiv.) various metal ions in DMSO![[thin space (1/6-em)]](https://www.rsc.org/images/entities/char_2009.gif) : :![[thin space (1/6-em)]](https://www.rsc.org/images/entities/char_2009.gif) H2O media (7 H2O media (7![[thin space (1/6-em)]](https://www.rsc.org/images/entities/char_2009.gif) : :![[thin space (1/6-em)]](https://www.rsc.org/images/entities/char_2009.gif) 3, v/v, pH = 7.4) under (a) natural light and (b) UV light (365 nm). 3, v/v, pH = 7.4) under (a) natural light and (b) UV light (365 nm). | ||
3.2 Chromogenic and Fluorogenic response
UV-vis spectral and spectrofluorometric responses of probe L (20 μM) were recorded in the absence and presence of different metal ions in DMSO![[thin space (1/6-em)]](https://www.rsc.org/images/entities/char_2009.gif) :
:![[thin space (1/6-em)]](https://www.rsc.org/images/entities/char_2009.gif) H2O (7
H2O (7![[thin space (1/6-em)]](https://www.rsc.org/images/entities/char_2009.gif) :
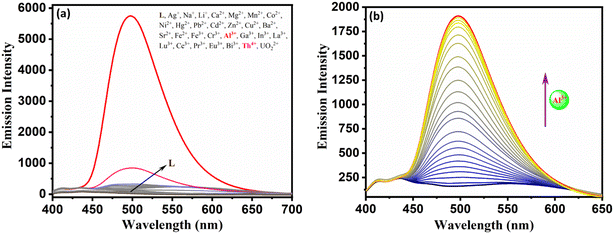
:![[thin space (1/6-em)]](https://www.rsc.org/images/entities/char_2009.gif) 3, v/v, pH = 7.4, 10 mM HEPES) media. As seen from Fig. 2a, probe L alone exhibits a strong, intense band at 385 nm, while probe with Al3+ and In3+ exhibits a new intense band at 419 nm and 444 nm, respectively. The highly intense L, L + Al3+, and L + In3+ bands could be due to intra-ligand charge transfer (ILCT) and ligand-to-metal charge transfer (LMCT). Further, UV-vis spectral titration of L with Al3+ and In3+ exhibits only one isosbestic point, indicating the formation of one new species (Fig. 2b and Fig. S14†). The spectrofluorimetric response of the test solution was performed by excitation at 385 nm, and the emission was recorded at 497 nm (Fig. 3a). This reveals that probe L has no fluorescence behaviour. However, the vial containing only L + Al3+ exhibits unprecedented photoluminescence ability while L + Th4+ exhibits weak fluorescence, and all other metals studied did not show any fluorescence. Further, the average time taken for the optimum response of absorbance and emission change of probe L with In3+ and Al3+ ions was found to be 140 s and 120 s, respectively (Fig. S15†). The non-fluorescence and fluorescence nature of probe L and L + Al3+ could be due to photo-induced intramolecular electron transfer (PET) leading to a non-fluorescent tautomer while the rigid L + Al3+ complex experiences inhibition of C
3, v/v, pH = 7.4, 10 mM HEPES) media. As seen from Fig. 2a, probe L alone exhibits a strong, intense band at 385 nm, while probe with Al3+ and In3+ exhibits a new intense band at 419 nm and 444 nm, respectively. The highly intense L, L + Al3+, and L + In3+ bands could be due to intra-ligand charge transfer (ILCT) and ligand-to-metal charge transfer (LMCT). Further, UV-vis spectral titration of L with Al3+ and In3+ exhibits only one isosbestic point, indicating the formation of one new species (Fig. 2b and Fig. S14†). The spectrofluorimetric response of the test solution was performed by excitation at 385 nm, and the emission was recorded at 497 nm (Fig. 3a). This reveals that probe L has no fluorescence behaviour. However, the vial containing only L + Al3+ exhibits unprecedented photoluminescence ability while L + Th4+ exhibits weak fluorescence, and all other metals studied did not show any fluorescence. Further, the average time taken for the optimum response of absorbance and emission change of probe L with In3+ and Al3+ ions was found to be 140 s and 120 s, respectively (Fig. S15†). The non-fluorescence and fluorescence nature of probe L and L + Al3+ could be due to photo-induced intramolecular electron transfer (PET) leading to a non-fluorescent tautomer while the rigid L + Al3+ complex experiences inhibition of C![[double bond, length as m-dash]](https://www.rsc.org/images/entities/char_e001.gif) N isomerization and PET leading to chelation enhanced fluorescence (CHEF).
N isomerization and PET leading to chelation enhanced fluorescence (CHEF).
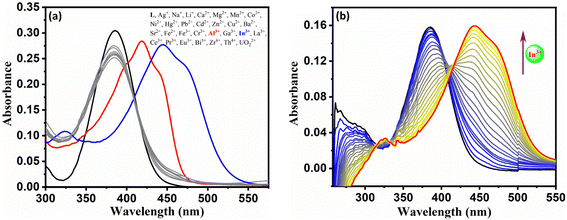 | ||
Fig. 2 (a) UV-vis spectral response of probe L in the presence and absence of various metal ions (10 equiv.) and (b) UV-vis spectral titration of probe L in DMSO![[thin space (1/6-em)]](https://www.rsc.org/images/entities/char_2009.gif) : :![[thin space (1/6-em)]](https://www.rsc.org/images/entities/char_2009.gif) H2O media (7 H2O media (7![[thin space (1/6-em)]](https://www.rsc.org/images/entities/char_2009.gif) : :![[thin space (1/6-em)]](https://www.rsc.org/images/entities/char_2009.gif) 3, v/v, pH = 7.4). 3, v/v, pH = 7.4). | ||
3.3 Effect of pH
The effect of pH on the absorbance and emission intensity of probe L in the pH range of 1.0 to 12.0 has been investigated in the absence and presence of 2 equiv. of In3+ and Al3+ ions. The emission of L + Al3+ was measured at 497 nm, whereas the absorbance of L + In3+ was measured at 444 nm. As seen from Fig. 4a and b, the absorbance and emission intensity of probe L did not change significantly until pH 12, showing maximum stability in the entire pH region. But L + In3+ and L + Al3+ complexes showed a maximum and stable spectral response in the pH region 4–10. Beyond this pH region, the spectral response decreases as the pH of the medium varies, and this could be due to interference of protons and hydrolysis of both metal ions leading to the formation of metal hydroxides, thereby reducing complex formation with the probe L.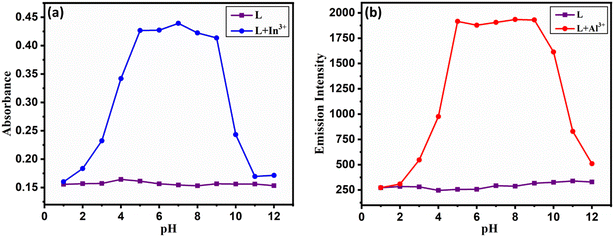 | ||
Fig. 4 Effect of pH on the photophysical properties of L, (a) L + In3+ and (b) L + Al3+ in DMSO![[thin space (1/6-em)]](https://www.rsc.org/images/entities/char_2009.gif) : :![[thin space (1/6-em)]](https://www.rsc.org/images/entities/char_2009.gif) H2O (7 H2O (7![[thin space (1/6-em)]](https://www.rsc.org/images/entities/char_2009.gif) : :![[thin space (1/6-em)]](https://www.rsc.org/images/entities/char_2009.gif) 3, v/v, pH = 7.4) media. 3, v/v, pH = 7.4) media. | ||
3.4 Stoichiometry, binding constant, and sensitivities of L with Al3+ and In3+
The stoichiometry of the complex formation was evaluated using Job's plot analysis to obtain the composition of the complex.46 As seen from Fig. 5a and b, the maximum photophysical value was attained when the composition of the complex attains a mole ratio of 0.66 for L + In3+ and 0.63 for L + Al3+, which corresponds to the formation of a 1![[thin space (1/6-em)]](https://www.rsc.org/images/entities/char_2009.gif) :
:![[thin space (1/6-em)]](https://www.rsc.org/images/entities/char_2009.gif) 2 (ligand
2 (ligand![[thin space (1/6-em)]](https://www.rsc.org/images/entities/char_2009.gif) :
:![[thin space (1/6-em)]](https://www.rsc.org/images/entities/char_2009.gif) metal) ratio. The binding strength of the complex was analyzed by the Benesi-Hildebrand method.47 The calculated binding constant values for Al3+ and In3+ ions were 9.38 × 10³ M−2 and 4.75 × 10⁴ M−2, respectively (Fig. 5c and d).
metal) ratio. The binding strength of the complex was analyzed by the Benesi-Hildebrand method.47 The calculated binding constant values for Al3+ and In3+ ions were 9.38 × 10³ M−2 and 4.75 × 10⁴ M−2, respectively (Fig. 5c and d).
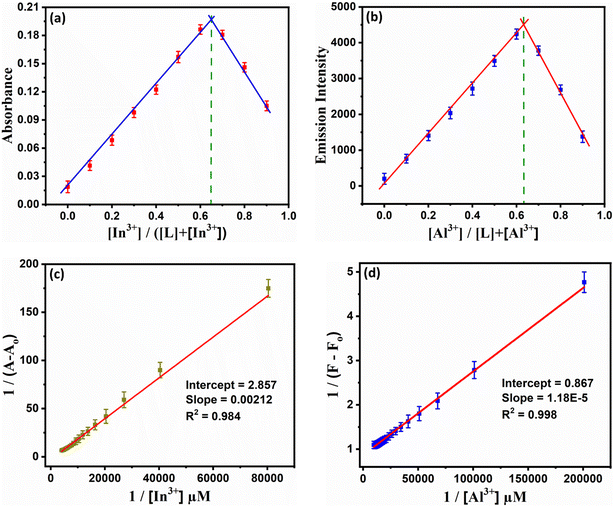 | ||
Fig. 5 Job's plot (a and b) and BH plot (c & d) for L + In3+ and L + Al3+ ions in DMSO![[thin space (1/6-em)]](https://www.rsc.org/images/entities/char_2009.gif) : :![[thin space (1/6-em)]](https://www.rsc.org/images/entities/char_2009.gif) H2O media (7 H2O media (7![[thin space (1/6-em)]](https://www.rsc.org/images/entities/char_2009.gif) : :![[thin space (1/6-em)]](https://www.rsc.org/images/entities/char_2009.gif) 3, v/v, pH = 7.4) by UV-vis spectrophotometric and spectrofluorimetric methods. 3, v/v, pH = 7.4) by UV-vis spectrophotometric and spectrofluorimetric methods. | ||
The sensitivity of probe L is determined by the limit of detection (LOD) and the limit of quantification (LOQ). The LOD and LOQ are estimated using “3σ/slope” and “10σ/slope” formulae, respectively, as per the International Union of Pure and Applied Chemistry (IUPAC).48 The calibration plot yielded LOD and LOQ values of 110 nM and 152 nM for In3+ and 10.98 nM and 76.92 nM for Al3+ using spectrophotometric and spectrofluorometric methods, respectively (Fig. S16a and b†). This implies that the probe is extremely sensitive to both metal ions. The obtained LOD values are far lower than the WHO's allowable Al3+ and In3+ levels in drinking water.49
3.5 Quantum yield and lifetime analysis
The fluorescence lifetime and quantum yield are essential parameters for practical applications of fluorescence-lifetime imaging microscopy. To know this, quinine sulfate was used as a standard to determine the quantum yield of L and its complexes with Al3+ and In3+ (Fig. S17a†). This reveals that the quantum yield for probe L, L + Al3+ and L + In3+ is 0.013, 0.321 and 0.010, respectively, as shown in Table S1.†50,51 The time-resolved emission studies have been carried out using an excitation wavelength of 385 nm in the absence and presence of Al3+ and In3+ (Fig. S17b†). This reveals that probe L, L + Al3+ and L + In3+ exhibit 1.21 ns, 3.71 ns, and 1.03 ns, respectively. Besides, the radiative decay rate constant is highest for L + Al3+ (8.65 × 10⁷ s−1). The calculated kr value indicates the high range, confirming high fluorescence even at a low concentration level.3.6 Reversibility and selectivity of L
The reversibility of a probe is a critical characteristic for evaluating its application and in vitro stability. As seen from Fig. 6a and b, probe L alone exhibits a strong, intense band at 385 nm, and excitation at this wavelength leads to an emission band centered at 497 nm. Upon addition of In3+ to L, it exhibits a new intense band with a redshift at 444 nm. Still, on the addition of a stoichiometric quantity of EDTA, this band experienced a blue shift, and further equivalent addition of In3+ ions caused a red shift in spectral response. The switching of the redshift and blue shift in the presence of EDTA and In3+ shows that probe L exhibits a dynamic response. A similar spectral response of ON–OFF–ON was observed with Al3+ with the sequential addition of Al3+, EDTA, and Al3+ to probe L. This repeated cycle suggests that the probe L exhibits a dynamic response.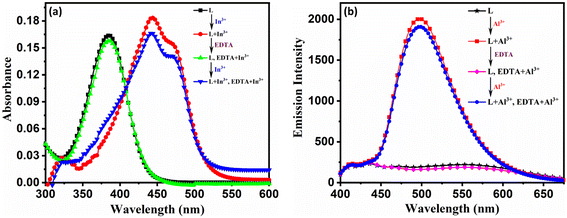 | ||
Fig. 6 Reversible sensing behaviour of L with (a) In3+ and (b) Al3+ in DMSO![[thin space (1/6-em)]](https://www.rsc.org/images/entities/char_2009.gif) : :![[thin space (1/6-em)]](https://www.rsc.org/images/entities/char_2009.gif) H2O media (7 H2O media (7![[thin space (1/6-em)]](https://www.rsc.org/images/entities/char_2009.gif) : :![[thin space (1/6-em)]](https://www.rsc.org/images/entities/char_2009.gif) 3, v/v, pH = 7.4) (λex = 385 nm and λem = 497 nm). 3, v/v, pH = 7.4) (λex = 385 nm and λem = 497 nm). | ||
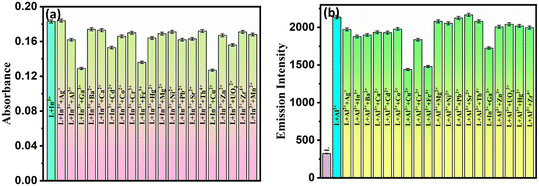
To study the selectivity of probe L with Al3+/In3+ in the presence of various other interfering ions using UV visible and spectrofluorometer spectral responses. Competitive investigations were carried out in the presence of 2 equiv. of Al3+ and In3+ ions mixed with 10 equiv. of other competitive metal ions such as Ag+, Na+, Ba2+, Cd2+, Co2+, Mn2+, Hg2+, Cr3+, Cu2+, La3+, Fe3+, Al3+, In3+, Ni2+, UO22+, and Zr4+ ions. As shown in Fig. 7a and b, no substantial change in absorbance and fluorescence intensities at 444 nm and 497 nm was observed upon examination with or without other metal ions, respectively, suggesting that the presence of other metal ions did not influence the actual quantification of In3+ and Al3+ ions. However, the paramagnetic effect decreased fluorescence intensity in the presence of Cu2+ and Fe3+ ions.
Furthermore, the selectivity of L with two equivalents of In3+ in the presence of different equivalents of Al3+ (1, 5, 10, 20, and 50) was recorded in the spectral response. As seen from Fig. S18,† the spectral response remains almost the same till 10 equiv., but at 20 equiv. and 50 equiv. there is interference in the quantification of In3+. Similarly, for the selectivity of Al3+ in the presence of different equivalents of In3+ (1, 5, 10, 20 and 50) the fluorescence intensity at 497 nm is recorded. As seen from Fig. S19,† spectral responses remain almost the same till 10 equiv. At 20 equiv. and 50 equiv., there is interference of Al3+ in quantification of In3+. In order to avoid interference, we have used EDTA as a masking agent to improve the selectivity of the probe towards the analyte. This reveals that L can selectively detect In3+ and Al3+ ions by spectrophotometry and spectrofluorimetry, respectively. EDTA showed a synergistic effect on L, which is useful for analyzing environmental samples.
3.7 Binding mechanism using NMR, UV-visible, mass, and DFT studies
To elucidate the coordination mechanism between L and Al3+ ions, 1H NMR titration assays were carried out. The 1H NMR spectra of probe L and L with two equiv. of Al3+ and In3+ have been recorded in DMSO-d6 as shown in Fig. 8a and b. The free probe L shows amide protons at 12.01 ppm, and phenolic protons appear at 11.47 ppm. The peak at 8.73 ppm can be attributed to the imine protons, whereas aromatic protons appear between 6.07 and 8.3 ppm. Peaks at 1.14 and 3.41 ppm may be produced by the methylene and methyl protons of the diethyl amine group in the salicylaldehyde unit. Meanwhile 1H NMR spectra are recorded in the presence of both metal ions; there is a significant shift change in the spectrum. In the presence of Al3+, the phenolic –OH peak of probe L vanishes, which suggests deprotonation of the phenolic proton and bond formation between deprotonated O and the metal centre, but the amide and imine protons exhibit slight deshielding from 12.01 ppm to 12.06 ppm and 8.73 to 8.76 ppm respectively. The other aromatic protons slightly shifted, and new peaks appeared significantly around 9.2 and 8.6 ppm, indicating the loss of symmetry during the complexation. This indicates the involvement of phenolic –OH, imine N, and amide carbonyl in the Al3+ and In3+ ion interaction.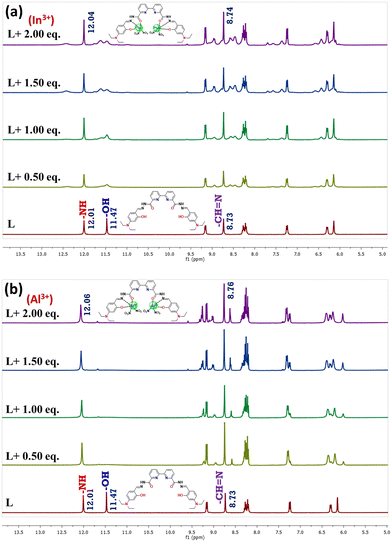 | ||
| Fig. 8 Overlay of 1H NMR spectra obtained during titration of L (1 × 10⁻⁵ M) in DMSO-d6 with incremental addition of (a) In3+ and (b) Al3+ of nitrate salts dissolved in DMSO-d6. | ||
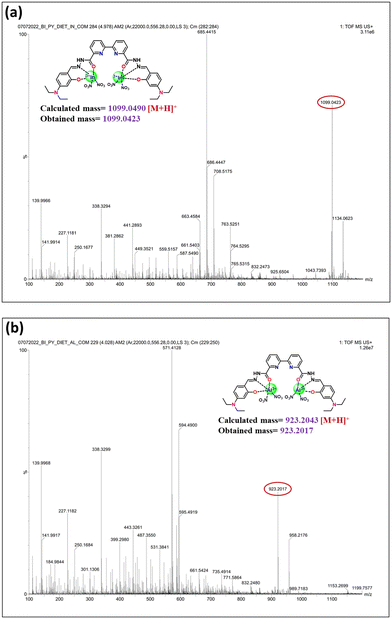
Furthermore, the L–In3+ and L–Al3+ complexes were analyzed by ESI-TOF mass, as shown in Fig. 9a and b. The appearance of the m/z peak at 1099.0423 corresponds to the formation of [1L + 2In3+ + 4NO3 + H]+ and the peak at 1134.0623 corresponds to the formation of [1L + 2In3+ + 4NO3 + 2H2O + H]+ and the m/z peak at 923.2017 corresponds to the formation of [1L + 2Al3+ + 4NO3 + H]+ and a peak at 958.2176 corresponds to the formation of [1L + 2Al3+ + 4NO3 + 2H2O + H]+ with a calculated mass of 1099.0490 for the L–In3+ complex and 923.2043 for the L–Al3+ complex, respectively. These results reveal the formation of a 1![[thin space (1/6-em)]](https://www.rsc.org/images/entities/char_2009.gif) :
:![[thin space (1/6-em)]](https://www.rsc.org/images/entities/char_2009.gif) 2 (ligand
2 (ligand![[thin space (1/6-em)]](https://www.rsc.org/images/entities/char_2009.gif) :
:![[thin space (1/6-em)]](https://www.rsc.org/images/entities/char_2009.gif) metal) stoichiometric complex, which is well supported by Job's method.
metal) stoichiometric complex, which is well supported by Job's method.
Both Al and In, belonging to group 3A, vary considerably in their physicochemical properties. The ionic radius of Al3+ and In3+ is 50 pm and 81 pm, and the electronegativity value is 1.5 and 1.7, respectively. Both are Lewis acids, and their coordination behavior is similar to L. However, the magnitude of interaction could vary depending on the denticity of L and the properties of Al3+ and In3+ ions. Evidence from Job's plot and mass spectral studies has been taken to understand binding stoichiometry and the number of donor sites involved, confirming the 2![[thin space (1/6-em)]](https://www.rsc.org/images/entities/char_2009.gif) :
:![[thin space (1/6-em)]](https://www.rsc.org/images/entities/char_2009.gif) 1 metal to L stoichiometry. Besides, the mass spectral response shows the involvement of two nitrate ions through the chelating mode to the metal centre. The 1H NMR titration indicates the involvement of phenolic –OH, imine N, and amide carbonyl of L in coordination with Al3+/In3+. The optimized structures of L, L + Al3+, and L + In3+ are shown in Fig. 10. In the instance of Al3+/In3+ ions, their hexa-coordination is satisfied by two tridentate ligands (two oxygen atoms and one nitrogen atom) and for computational clarity, anions are omitted. The coordination bond length of the complex, in the range of 1.71–2.06 °A, lies in the average coordination bond distance. The optimized structure of L + Al3+ is near planar, but the structure of L + In3+ is twisted with a considerable dihedral angle (approximately ∼0°). The interaction energy of L with Al3+ and In3+ is found to be −252 kcal mol−1 and −451 kcal mol−1, while the band gap is 1.71 eV and 1.46 eV, respectively. This reveals that when the binding site of L interacts with Al3+, the polarization of the electron cloud of the donor site of L could not be completely polarized by Al3+ as compared to In3+ due to low ion-molecular size fit and electronegativity. Furthermore, the calculated bandgap would be well supported by the absorption spectrum (Fig. 2a) regarding the redshift of L–In3+ compared to L–Al3+. The binding constant (Ka) of L with Al3+ and In3+ was found to be 9.38 × 10³ M−2 and 4.75 × 10⁴ M−2 as estimated by the BH method, confirming a similar type of binding nature with L and different magnitudes of interaction.
1 metal to L stoichiometry. Besides, the mass spectral response shows the involvement of two nitrate ions through the chelating mode to the metal centre. The 1H NMR titration indicates the involvement of phenolic –OH, imine N, and amide carbonyl of L in coordination with Al3+/In3+. The optimized structures of L, L + Al3+, and L + In3+ are shown in Fig. 10. In the instance of Al3+/In3+ ions, their hexa-coordination is satisfied by two tridentate ligands (two oxygen atoms and one nitrogen atom) and for computational clarity, anions are omitted. The coordination bond length of the complex, in the range of 1.71–2.06 °A, lies in the average coordination bond distance. The optimized structure of L + Al3+ is near planar, but the structure of L + In3+ is twisted with a considerable dihedral angle (approximately ∼0°). The interaction energy of L with Al3+ and In3+ is found to be −252 kcal mol−1 and −451 kcal mol−1, while the band gap is 1.71 eV and 1.46 eV, respectively. This reveals that when the binding site of L interacts with Al3+, the polarization of the electron cloud of the donor site of L could not be completely polarized by Al3+ as compared to In3+ due to low ion-molecular size fit and electronegativity. Furthermore, the calculated bandgap would be well supported by the absorption spectrum (Fig. 2a) regarding the redshift of L–In3+ compared to L–Al3+. The binding constant (Ka) of L with Al3+ and In3+ was found to be 9.38 × 10³ M−2 and 4.75 × 10⁴ M−2 as estimated by the BH method, confirming a similar type of binding nature with L and different magnitudes of interaction.
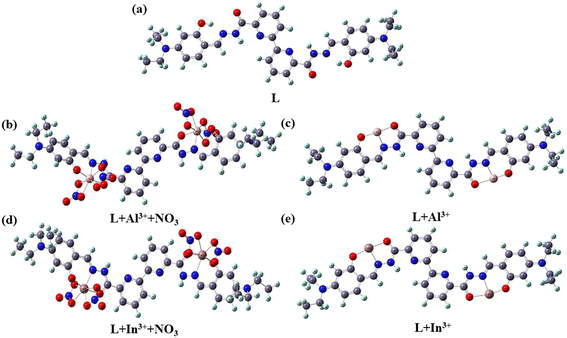 | ||
| Fig. 10 Optimized molecular geometry of (a) L, (b and c) L + Al3+ and (d and e) L + In3+ with and without nitrate ion coordination in DMSO medium by the DFT/B3LYP method. | ||
However, the photophysical properties of both complexes are quite different. Under steady-state conditions, L–In3+ is highly colourimetric (yellow-orange). In contrast, L–Al3+ has a very weak colourimetric nature (pale yellow), but under excited state conditions, L-Al3+ is highly luminescent (cyan), while L–In3+ is non-luminescent. To explain this behaviour, the following key points are taken into consideration. The non-fluorogenic nature of the L–In3+ complex might be due to the combined PET and C![[double bond, length as m-dash]](https://www.rsc.org/images/entities/char_e001.gif) N isomerization in the excited and ground states after complexation. Extensive charge transfer leads to intense colors. In the case of the L–Al3+ complex, it experiences chelation-enhanced fluorescence with inhibition of C
N isomerization in the excited and ground states after complexation. Extensive charge transfer leads to intense colors. In the case of the L–Al3+ complex, it experiences chelation-enhanced fluorescence with inhibition of C![[double bond, length as m-dash]](https://www.rsc.org/images/entities/char_e001.gif) N isomerization and turn-off PET.
N isomerization and turn-off PET.
On the other hand, Fig. S20† displays the energies and frontier molecular orbitals (FMO) of L and its two complexes (L + Al3+ and L + In3+). The electron density in L's HOMO is located in the diethylamino salicylaldehyde ring system. In contrast, the electron density in the LUMO is located in the bipyridine ring system, with little contribution from the rest of the groups. When the FMOs of L are changed, it is evident that PET is occurring from the diethylamine ring system to the bipyridine ring system, leading to decreasing fluorescence intensity. When L is complexing with Al3+ and In3+, the HOMOs are located in the diethylamino salicylaldehyde ring system, while the LUMO is located on metal center (Al or In) and changes in the bandgap L + Al3+ (1.70 eV) and L + In3+ (1.46 eV) complexes had their HOMO/LUMO energy gaps are smaller than the free sensor L (3.19 eV), indicating complexation significantly stabilized the sensors because of this CHEF suppressed the PET when it bound to the Al3+. Charge transfer (CT) may be seen in the electronic distribution in the HOMO of the L + In3+ complex, with the electron density concentrated at the In3+ core. In contrast, the electron density is distributed to the imine hydrazone group in the LUMO. Also, the UV-vis absorbance spectra of L, L + Al3+, and L+In3+ were calculated using time-dependent density functional theory (TD-DFT) calculations by applying the same level of theory in the DMSO medium. The ligand L exhibits well-set bands at 385 nm, which agree with the theoretical value of 399.29 nm (S0 → S1 transition). The L + Al3+ complex reveals well-resolved absorption bands at 420 nm in the DMSO medium, and the consistent theoretical absorption bands are assigned at 464.03 nm (S0 → S9 transition). The L + In3+ complex reveals well-resolved absorption bands at 444 nm in the DMSO medium, and the consistent theoretical absorption bands are assigned at 471.25 nm (S0 → S11 transition), which are well in agreement with the experimental results (Table S2 and Fig. S21†).
4. Applications
Based on the characteristic properties acquired by probe L, the potential applications include determining Al3+ and In3+ in various water samples, detecting Al3+ at the cellular level, and sensing behavior performed in logic gate operations.4.1 Test strip studies
The Whatman filter paper was used to develop a test strip by soaking the filter paper in 0.1 mM of L dissolved in DMSO![[thin space (1/6-em)]](https://www.rsc.org/images/entities/char_2009.gif) :
:![[thin space (1/6-em)]](https://www.rsc.org/images/entities/char_2009.gif) H2O and drying it in a hot air oven for 5 h. It exhibited a yellow color when test strips were dipped in aqueous solutions of Al3+, Cu2+, and In3+. In contrast, other tested metal ions did not show any colour (Fig. 11a). However, under UV light, it exhibited visible cyan fluorescence with Al3+ ions, and with In3+ it showed a dark blue colour, which is visible to the naked eye (Fig. 11b). Thus, it is apparent that probe L shows excellent colourimetry and fluorescence sensing performance in the solid-state.
H2O and drying it in a hot air oven for 5 h. It exhibited a yellow color when test strips were dipped in aqueous solutions of Al3+, Cu2+, and In3+. In contrast, other tested metal ions did not show any colour (Fig. 11a). However, under UV light, it exhibited visible cyan fluorescence with Al3+ ions, and with In3+ it showed a dark blue colour, which is visible to the naked eye (Fig. 11b). Thus, it is apparent that probe L shows excellent colourimetry and fluorescence sensing performance in the solid-state.
 | ||
| Fig. 11 Visible colour change of the cellulose test strip containing probe L with (10 equiv.) various metal ions under (a) normal light and (b) UV light. | ||
4.2 Water sample analysis
The known volume of water sample was spiked with Al3+ and In3+, probe L solution added, pH maintained at 6.8–7.4, and spectral response measured using a spectrofluorometer and UV visible spectrophotometer, as seen from Table S3,† summarizes sample analysis of Al3+ and In3+ and the recovery percentages were fall in the range of 93 to 98% and 96 to 99% respectively. The results showed that the probe L could detect Al3+ and In3+, which will help develop a more effective probe. Further, the performance of probe L has been compared with previously reported sensors in Table S4† in terms of selectivity, binding constant, detection limit, and applications.8–10,52–58 The results reveal that very few sensors work in a nearly aqueous environment, and this probe L is comparable with the previously reported sensors.4.3 Toxicity assessment of L and in vivo tracing of Al3+ in zebrafish larvae
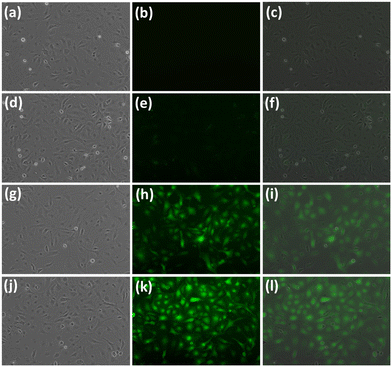
Before using the probe to detect Al3+ at a cellular level, the cytotoxicity of probe L has been evaluated using the DrG cell line (Fig. S22†). The DrG Cell line was incubated at various concentrations of probe L (control, 20, 40, 60, 80, and 100 μM mL−1) dissolved in L-15 media and subject to two different cytotoxicity assays, neutral red (NR) and 3-(4,5-dimethylthiazol-2-yl)-2,5-diphenyltetrazolium bromide (MTT). The study reveals that up to 40 μM mL−1 (25 ppm), the cell viability was found to be 96.3% and 98% using NR and MTT assays, respectively. Further, at this concentration of probe L to DrG, cells are physiologically compatible. Beyond 80 μM mL−1 probe L, DrG cells exhibit morphological changes. Hence, 40 μM mL−1 probe L was the optimum concentration for DrG cells for studying metal ion detection (Fig. S23†). Furthermore, rhodamine 123 labelling was utilized to analyze mitochondrial alterations in DrG zebrafish cell lines. Besides, no significant mitochondrial changes were identified compared to control cells.To detect intracellular Al3+, 80 to 90% confluent DrG cells were first treated with 50 and 100 μM mL−1 (2 ppm) of aluminium nitrate for 30 min at 28 °C. The residual Al3+ ions were washed using serum-free media three times. To detect the presence of intracellular Al3+, cells were exposed to a serum-free medium containing 20 and 40 μM of probe L, and cells were incubated for 30 min. Later, cells were washed three times with serum-free media, and images were taken. As seen in Fig. 12, a fluorescence image of DrG cells shows a high level of green fluorescence in the cytoplasm, consistent with the development of the L + Al3+ complex in DrG cells (at both 20 and 40 μM of probe L). No fluorescence was observed in the control cells, which had only been exposed to probe L. The results indicated that probe L was selective for Al3+ in live cells. This study illustrates probe L's ability to reach cell membranes and examines the intracellular distribution of Al3+ (Fig. 12).
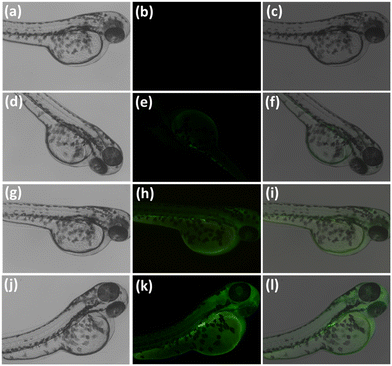
To further evaluate the possible applicability of probe L in a biological system, we studied in vivo Al3+ detection in the zebrafish larvae. Zebrafish have been widely used as model animals for in vivo bioimaging of metal ions due to their small size and transparency. The results are shown in (Fig. 13), where the green fluorescence of Al3+ with the probe L complex can be observed in the fish larvae head and digestive system (at probe L concentrations of 20 and 40 μM mL−1).
4.4 Molecular logic gate
Whitehead and Russell invented the IMPLICATION logic operation and three basic logic operations: AND, OR, and NOT. Few molecular logic gates with remarkable implication functions (IMP) have been reported. Three input and two output logic gates are used in IMPLICATION operations. We consider Al3+ and In3+ as input 1 and input 3 and EDTA as input 2, and the absorbance intensity value at 444 nm and the fluorescence intensity value at 497 nm as the output 1 and output 2 signals for the building of the IMPLICATION gate (Fig. 14a).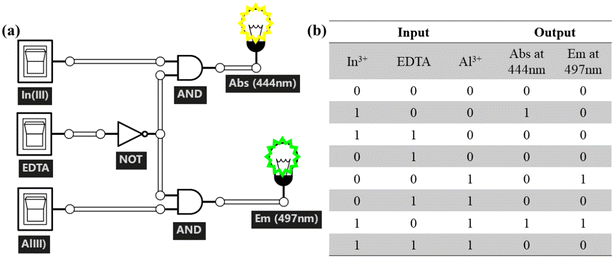 | ||
| Fig. 14 (a) IMPLICATION logic gate representation of probe L using a conventional gate notation and its (b) truth table. | ||
According to the truth table in Fig. 14b, adding only In3+ (input1 = 1 and input 2 = 3 = 0) results in an absorbance intensity value indicating that the output signal is over the threshold value (output1 = 1). Similarly, adding only Al3+ (input 3 = 1 and input 1, 2 = 0) results in a fluorescence intensity value output signal greater than the threshold values (output 2 = 1). Meanwhile the presence of Al3+ and In3+ (input 1 = 1 and input 3 = 1) results in both absorbance and fluorescence output signals being over the threshold values (output 1 = 1 and output 2 = 1). Other alternative input combinations [(0, 1, 0), (1, 1, 0), and (0, 1, 1)] result in output signals (absorption and emission) that are less than the threshold value, i.e., output 1 = 1 and output 2 = 0. As a result, an IMPLICATION logic gate can be shown by monitoring the absorbance and fluorescence changes of probe L at 444 nm and 497 nm with the three inputs (In3+, Al3+, and EDTA).
5. Conclusion
A novel dual chemosensor was designed and synthesized using [2,2′-bipyridine]-6,6′-dicarbohydrazide and diethylamino salicylaldehyde. In semi-aqueous media, probe L showed excellent sensitivity and remarkable selectivity toward group IIIA metal ions such as Al3+ and In3+ over competing metal ions. The probe L binding to Al3+/In3+ was chemically reversible with EDTA. Further, probe L could be a colourimetric sensor that can distinguish In3+ and a fluorogenic chemosensor that can distinguish Al3+ from the other group IIIA metal ions in semi-aqueous media. Furthermore, 1H NMR changes, ESI mass, and theoretical calculations were used to elucidate the sensing mechanism for Al3+ and In3+. To the best of our knowledge, no single chemosensor for detecting Al3+ and In3+ without interacting with one another has been reported. Thus, this work provides a chemosensor that can be used as an example of a “bimodal chemosensor for dual analytes” for dual-mode spectrophotometry detection of In3+ and spectrofluorimetric detection of Al3+. Also, the development of paper strips for the visual detection of In3+ and Al3+ was carried out under normal and UV light. Probe L successfully bioimaged Al3+ in the yolk, digestive tract, and skull of living zebrafish embryos (D. rerio) to study chemical signalling in complex multicellular systems.Conflicts of interest
“The authors declare no conflict of interest.”Acknowledgements
The authors are thankful to DST-VIT-FIST for NMR, SIF-VIT for GC-MS and to Vellore Institute of Technology, Vellore for granting a VIT SEED GRANT (SG20230100) to conduct the research. We also acknowledge the R&D project No: BT/PR41899/AAQ/3/1006/2021, Department of Biotechnology (DBT), Ministry of Science and Technology, Government of India, New Delhi, India for carrying out the bio-work. Dr. Bhaskar R. gratefully acknowledges the Indian Council of Medical Research (ICMR), New Delhi, for the Research Associateship (Sanction No. 45/21/2022-BIO/BMS).References
- T. Kawano, T. Kadono, T. Furuichi, S. Muto and F. Lapeyrie, Biochem. Biophys. Res. Commun., 2003, 308, 35–42 CrossRef CAS PubMed.
- D. L. Ma, S. Lin, W. Wang, C. Yang and C. H. Leung, Chem. Sci., 2017, 8, 878–889 RSC.
- S. Paul, A. Manna and S. Goswami, Dalton Trans., 2015, 44, 11805–11810 RSC.
- T. G. Jo, J. J. Lee, E. Nam, K. H. Bok, M. H. Lim and C. Kim, New J. Chem., 2016, 40, 8918–8927 RSC.
- J. M. Kim, J. Kim, H. S. Jung, Y. H. Lee, J. F. Zhang and J. S. Kim, Tetrahedron Lett., 2010, 51, 1947–1951 CrossRef.
- R. E. Lawerence and L. R. Westbrook, Ind. Eng. Chem., 1938, 30, 611–621 CrossRef.
- A. J. Downs, Chemistry of aluminium, gallium, indium and thallium, Springer Science & Business Media, 1993 Search PubMed.
- H. J. Jang, J. H. Kang, D. Yun and C. Kim, Photochem. Photobiol. Sci., 2018, 17, 1247–1255 CrossRef CAS PubMed.
- A. Roy, U. Shee, A. Mukherjee, S. K. Mandal and P. Roy, ACS Omega, 2019, 4, 6864–6875 CrossRef CAS.
- Y.-W. Wang, Y.-X. Hua, H.-H. Wu, X. Sun and Y. Peng, Chin. Chem. Lett., 2017, 28, 1994–1996 CrossRef CAS.
- Z. Liao, Y. Liu, S. F. Han, D. Wang, J. Q. Zheng, X. J. Zheng and L. P. Jin, Sens. Actuators, B, 2017, 244, 914–921 CrossRef CAS.
- Y. W. Wang, S. B. Liu, W.-J. Ling and Y. Peng, Chem. Commun., 2016, 52, 827–830 RSC.
- S. V. Smirnova, D. V. Ilin and I. V. Pletnev, Talanta, 2021, 221, 121485 CrossRef CAS PubMed.
- X. Guo, M. He, B. Chen and B. Hu, Talanta, 2012, 94, 70–76 CrossRef CAS PubMed.
- Y. Akama and A. Tong, Anal. Sci., 1991, 7, 745–747 CrossRef CAS.
- A. Nitsch, K. Kalcher and U. Posch, J. Anal. Chem., 1990, 338, 618–621 CAS.
- A. Roy, M. Nandi and P. Roy, TrAC, Trends Anal. Chem., 2021, 138, 116204 CrossRef CAS.
- L. He, B. Dong, Y. Liu and W. Lin, Chem. Soc. Rev., 2016, 45, 6449–6461 RSC.
- M. Shellaiah, Y.-T. Chen, N. Thirumalaivasan, B. Aazaad, K. Awasthi, K. W. Sun, S.-P. Wu, M.-C. Lin and N. Ohta, ACS Appl. Mater. Interfaces, 2021, 13, 28610–28626 CrossRef CAS PubMed.
- C. Immanuel David, N. Bhuvanesh, H. Jayaraj, A. Thamilselvan, D. Parimala Devi, A. Abiram, J. Prabhu and R. Nandhakumar, ACS Omega, 2020, 5, 3055–3072 CrossRef CAS PubMed.
- Y. Wang, X. Hao, L. Liang, L. Gao, X. Ren, Y. Wu and H. Zhao, RSC Adv., 2020, 10, 6109–6113 RSC.
- M. M. Fu, Y. H. Qu, V. A. Blatov, Y. H. Li and G. H. Cui, J. Solid State Chem., 2020, 289, 121460 CrossRef CAS.
- S. M. R. Shoja, M. Abdouss and A. A. M. Beigi, J. Mol. Struct., 2021, 1230, 129917 CrossRef CAS.
- J. Ceramella, D. Iacopetta, A. Catalano, F. Cirillo, R. Lappano and M. S. Sinicropi, Antibiotics, 2022, 11, 191 CrossRef CAS PubMed.
- A. Kathiravan, K. Sundaravel, M. Jaccob, G. Dhinagaran, A. Rameshkumar, D. Arul Ananth and T. Sivasudha, J. Phys. Chem. B, 2014, 118, 13573–13581 CrossRef CAS PubMed.
- A. K. Manna, S. Chowdhury and G. K. Patra, New J. Chem., 2020, 44, 10819–10832 RSC.
- R. Chandra, A. K. Manna, M. Sahu, K. Rout and G. K. Patra, Inorg. Chim. Acta, 2020, 499, 119192 CrossRef.
- R. Selva Kumar, S. K. A. Kumar, K. Vijayakrishna, A. Sivaramakrishna, C. V. S. Brahmmananda Rao, N. Sivaraman and S. K. Sahoo, Inorg. Chem., 2018, 57, 15270–15279 CrossRef PubMed.
- R. Selva Kumar and S. K. A. Kumar, Inorg. Chem. Commun., 2019, 106, 165–173 CrossRef CAS.
- A. M. Aatif, R. S. Kumar, S. Joseph, V. Vetriarasu, S. A. Majeed and S. K. A. Kumar, J. Photochem. Photobiol., A, 2023, 434, 114257 CrossRef.
- H. Qi, J. J. Teesdale, R. C. Pupillo, J. Rosenthal and A. J. Bard, J. Am. Chem. Soc., 2013, 135, 13558–13566 CrossRef CAS PubMed.
- M. J. Frisch, G. W. Trucks and H. B. Schlegel, et al., Gaussian 09, Revis. D. 01, Inc., Wallingford, CT Search PubMed.
- A. D. Becke, J. Chem. Phys, 1993, 98, 5648–5652 CrossRef CAS.
- C. Lee, W. Yang and R. G. Parr, Phys. Rev. B: Condens. Matter Mater. Phys., 1988, 37, 785 CrossRef CAS PubMed.
- M. M. Francl, W. J. Pietro, W. J. Hehre, J. S. Binkley, M. S. Gordon, D. J. DeFrees and J. A. Pople, J. Chem. Phys., 1982, 77, 3654–3665 CrossRef CAS.
- P. J. Hay and W. R. Wadt, J. Chem. Phys., 1985, 82, 270–283 CrossRef CAS.
- W. R. Wadt and P. J. Hay, J. Chem. Phys., 1985, 82, 284–298 CrossRef CAS.
- V. Barone and M. Cossi, J. Phys. Chem. A, 1998, 102, 1995–2001 CrossRef CAS.
- M. Cossi and V. Barone, J. Chem. Phys., 2001, 115, 4708–4717 CrossRef CAS.
- R. Selva Kumar, S. K. Ashok Kumar, K. Vijayakrishna, A. Sivaramakrishna, C. V. S. R. Brahmmananda, N. Sivaraman and S. K. Sahoo, Inorg. Chem., 2018, 57, 15270–15279 CrossRef PubMed.
- N. M. O'boyle, A. L. Tenderholt and K. M. Langner, J. Comput. Chem., 2008, 29, 839–845 CrossRef PubMed.
- S. A. Majeed and S. K. A. Kumar, Anal. Methods, 2021, 13, 212–221 RSC.
- S. A. Majeed, K. S. N. Nambi, G. Taju, S. Vimal, C. Venkatesan and A. S. Hameed, Environ. Sci. Pollut. Res., 2014, 21, 13539–13550 CrossRef CAS PubMed.
- M. Venkateswarulu, D. Gambhir, H. Kaur, P. V. Daniel, P. Mondal and R. R. Koner, Dalton Trans., 2017, 46, 13118–13125 RSC.
- H. Tian, X. Qiao, Z. L. Zhang, C. Z. Xie, Q. Z. Li and J. Y. Xu, Spectrochim. Acta, Part A, 2019, 207, 31–38 CrossRef CAS PubMed.
- P. Job, Ann. Chim., 1928, 9, 113–203 CAS.
- H. A. Benesi and J. H. Hildebrand, J. Am. Chem. Soc., 1949, 71, 2703–2707 CrossRef CAS.
- G. L. Long and J. D. Winefordner, Anal. Chem., 1983, 55, 712A–724A CrossRef CAS.
- W. H. O., Guidelines for drinking-water quality, World Health Organization, 2004, vol. 1 Search PubMed.
- A. M. Brouwer, Pure Appl. Chem., 2011, 83, 2213–2228 CrossRef CAS.
- A. T. R. Williams, S. A. Winfield and J. N. Miller, Analyst, 1983, 108, 1067–1071 RSC.
- Y. Xu, S. Zhao, Y. Zhang, H. Wang, X. Yang, M. Pei and G. Zhang, Photochem. Photobiol. Sci., 2020, 19, 289–298 CrossRef CAS PubMed.
- P. C. K. Vesborg, B. Seger and I. B. Chorkendorff, J. Phys. Chem. Lett., 2015, 6, 951–957 CrossRef CAS PubMed.
- B. Li, X. Shang, L. Li, Y. Xu, H. Wang, X. Yang, M. Pei, R. Zhang and G. Zhang, New J. Chem., 2020, 44, 951–957 RSC.
- A. Finelli, V. Chabert, N. Hérault, A. Crochet, C. Kim and K. M. Fromm, Inorg. Chem., 2019, 58, 13796–13806 CrossRef CAS PubMed.
- B. Li, Z. Liu, L. Li, Y. Xing, Y. Liu, X. Yang, M. Pei and G. Zhang, New J. Chem., 2021, 45, 6753–6759 RSC.
- S. Y. Lee, M. Yang and C. Kim, Spectrochim. Acta, Part A, 2018, 205, 622–629 CrossRef CAS PubMed.
- S. Pawar, S. Kaja and A. Nag, ACS Omega, 2020, 5, 8362–8372 CrossRef CAS PubMed.
Footnote |
| † Electronic supplementary information (ESI) available. See DOI: https://doi.org/10.1039/d3sd00282a |
| This journal is © The Royal Society of Chemistry 2024 |


