 Open Access Article
Hydrogen production by NH3 decomposition at low temperatures assisted by surface protonics†
Yukino
Ofuchi‡
a,
Kenta
Mitarai‡
b,
Sae
Doi‡
a,
Koki
Saegusa
a,
Mio
Hayashi
a,
Hiroshi
Sampei
 a,
Takuma
Higo
 a,
Jeong Gil
Seo
 *c and
Yasushi
Sekine
 *a
*a
aDepartment of Applied Chemistry, Waseda University, 3-4-1, Okubo, Shinjuku, Tokyo, 169-8555, Japan. E-mail: ysekine@waseda.jp
bResearch & Development Centre, Yanmar Holdings, 2481, Umegahara, Maibara, Shiga 521-8511, Japan
cDepartment of Chemical Engineering, Hanyang University, 222 Wangsimri-ro, Seongdong-gu, Seoul 04763, Republic of Korea. E-mail: jgseo@hanyang.ac.kr
First published on 27th August 2024
Abstract
Ammonia, which can be decomposed on-site to produce CO2-free H2, is regarded as a promising hydrogen carrier because of its high hydrogen density, wide availability, and ease of transport. Unfortunately, ammonia decomposition requires high temperatures (>773 K) to achieve complete conversion, thereby hindering its practical applicability. Here, we demonstrate that high conversion can be achieved at markedly lower temperatures using an applied electric field along with a highly active and readily producible Ru/CeO2 catalyst. Applying an electric field lowers the apparent activation energies, promotes low-temperature conversion, and even surpasses equilibrium conversion at 398 K, thereby providing a feasible route to economically attractive hydrogen production. Experimentally obtained results and neural network potential studies revealed that this reaction proceeds via HN–NH intermediate formation by virtue of surface protonics.
Introduction
Hydrogen carriers can store and transport hydrogen at high density in the form of hydrogenated compounds, thereby attracting attention as a next-generation energy resource for a sustainable society. Among hydrogen carriers, ammonia is a powerful candidate because of its high hydrogen content (17.6 wt%), carbon-free nature, and ease of liquefaction and handling.1–3 It can therefore be used directly as an alternative fuel.1,4 Moreover, it is widely produced, with established modes of distribution and transport.1,5,6 Ammonia is highly promising for use as a hydrogen carrier by ammonia decomposition (eqn (1)), but high temperatures (>773 K) must be attained to decompose it because of its endothermicity, which hinders its practical use for green hydrogen production.| NH3 → 1/2N2 + 3/2H2 ΔH = +46.0 kJ mol−1 | (1) |
Extracting hydrogen for use in fuel cells and internal combustion engines requires high ammonia conversion rates at low temperatures to develop compact processes that can be driven on-demand and onsite.
With conventional thermal catalytic systems, the reaction proceeds via *N and *H formation through dissociation of N–H bonds and the recombination of N and H, as presented below.7
| NH3 + σ → *NH3 | (2) |
| *NH3 + σ → *NH2 + *H | (3) |
| *NH2 + σ → *NH + *H | (4) |
| *NH + σ → *N + *H | (5) |
| *N + *N → N2 + 2σ | (6) |
| *H + *H → H2 + 2σ | (7) |
Many researchers have studied the rate-determining step of this reaction intensively. It is generally considered that the rate-determining step on an active metal such as Fe, Co, Ni, and Ru is the desorption of nitrogen at low temperatures, and also that the rate-determining step is the dissociation of N–H at high temperatures.7–9 By contrast, for other metals such as Rh, Ir, Pd, Pt, and Cu, N–H bond cleavage is known to limit the reaction rate at all temperatures.10 Thermal catalytic decomposition of ammonia invariably requires elevated temperatures (>773 K) to achieve complete conversion. Consequently, the design and synthesis of catalysts able to promote the conversion of ammonia to hydrogen at lower temperatures is crucially important.
Electric field (EF) assisted catalytic reactions have been explored to lower the reaction temperatures for various reactions further. Proton conduction at the catalyst surface plays a fundamentally important role in such processes.11–16 For example, in the steam reforming of methane, dry reforming of methane and dehydrogenation of methylcyclohexane, C–H dissociation proceeded through unstable intermediates (CH4–H+, C7H13–H–H+) derived from proton hopping (called surface protonics) on the catalyst support. Consequently, the same concept is applicable to ammonia decomposition, for which it markedly improves ammonia conversion at lower temperatures.17
In this work, after a fundamental analysis is made of electric field effects on catalytic ammonia decomposition at lower temperatures, the mechanism of catalytic ammonia decomposition in the electric field is elucidated.
Experimental
Catalyst preparation and reaction
Metal-impregnated catalysts supported on CeO2 were synthesized for fundamental examinations of electric field effects. Synthesis methods are presented in ESI.† Effects of applying electric fields to ammonia decomposition activity were investigated using 8.2 mol%-M/CeO2 (M = Ru, Fe, Co, and Ni) synthesized for fundamental electric field studies. In addition, 0.85, 5.0, and 8.2 mol% (0.5, 3, and 5 wt%) Ru/CeO2 catalysts were used to investigate the effect of Ru loading. The physicochemical properties of the catalysts are shown in Table S1 (ESI).† Catalytic activity tests were conducted using a fixed bed flow type reactor, as shown in Fig. S1 (ESI).† Two stainless steel electrodes (2 mm outer diameter) were inserted into the reactor and attached to the top and bottom of the catalyst bed. Direct current (0.0 mA or 6.0 mA (= 0.21 mA mm−2)) was applied using a power supply device to apply an electric field. The response voltage was monitored using an oscilloscope (TDC 2001C; Tektronix, Inc.). To measure the catalyst bed temperature accurately, a thermocouple was inserted into the reactor and was attached directly to the catalyst bed. During these experiments, no plasma was observed. In fact, the response voltage was stable: approximately 0.1 kV at a catalyst weight of 100 mg. The response voltage increased linearly with the amount of catalyst. Pre-reduction treatments were applied under conditions in which each metal was reduced sufficiently: at 723 K for 2 h (Ru/CeO2), at 873 K for 1 h (Ni/CeO2, Co/CeO2), and at 773 K for 1 h (Fe/CeO2). Each condition of activity tests is described in each section. Hydrogen and nitrogen produced were measured using GC-TCD (GC-8A; Shimadzu Corp.). In a steady state, their ratio was confirmed as H2![[thin space (1/6-em)]](https://www.rsc.org/images/entities/char_2009.gif) :
:![[thin space (1/6-em)]](https://www.rsc.org/images/entities/char_2009.gif) N2 = 3
N2 = 3![[thin space (1/6-em)]](https://www.rsc.org/images/entities/char_2009.gif) :
:![[thin space (1/6-em)]](https://www.rsc.org/images/entities/char_2009.gif) 1. Therefore, the material balances were almost 100% for all tests. Ammonia conversion was calculated from the amount of hydrogen produced.
1. Therefore, the material balances were almost 100% for all tests. Ammonia conversion was calculated from the amount of hydrogen produced.
Moreover, to elucidate the reaction mechanism, kinetic studies were conducted (Arrhenius plots, NH3, H2, and N2 partial pressures change tests, ND3 isotope exchange tests). Related details are presented in ESI† and figure captions. The experiment conditions were the same as those used for the activity test while using 0.85 mol% Ru/CeO2 as the catalyst to achieve kinetic condition (i.e. lower conversion).
Estimation of species adsorbed on the catalyst surface using quadrupole mass spectrometry
The surface-adsorbed species during thermal catalytic reaction and electric field application were estimated for evaluation of the state of surface adsorbates. Using a quadrupole mass spectrometer (Q-mass, ThermoStar GSD 350; Pfeiffer Vacuum GmbH), the outlet gas was analyzed immediately after the start of the reaction. Related details are presented in ESI.† Tests were conducted under the same conditions as those used for the activity test. In the case of electric field application, the reaction starting point was the moment at which the electric field was applied under 5% NH3/Ar gas flow. In the case of catalytic reaction by heating, the reaction start point was defined as the moment at which NH3 gas flow started at 573 K. Measurements were continued in the quantitative mode until the measured product gas reached a steady state. The outlet gas was also examined using GC. The H2/N2 ratio remained confirmed as 3 in this case.Theoretical studies of electric-field-assisted and thermal catalytic ammonia decomposition
For this study, we performed theoretical energy calculations using Matlantis,18 an atomistic simulator of density functional theory calculations. All energies of the catalyst surface model were calculated using PFP neural network potential v4.0.0![[thin space (1/6-em)]](https://www.rsc.org/images/entities/char_2009.gif) 19 based on the generalized gradient approximation of Perdew–Burke–Ernzerhof (GGA-PBE).20 As a geometric optimization method of the calculation model, we used the Broyden–Fletcher–Goldfarb–Shanno (BFGS) LineSearch algorithm21 with the convergence threshold set as 10−5 eV. Additionally, we represented van der Waals interactions using DFT-D3 proposed by Grimme.22 The transition state and activation energy on each elementary step were obtained by climbing image nudged elastic band (CI-NEB) method. In this CI-NEB calculation, we used 17 intermediate images with 0.05 eV Å−1 of spring constant. All saddle points were confirmed to have only one imaginary vibration using Sella package and frequency analysis.23 To elucidate the electric field effect for ammonia decomposition on each reaction site of Ru/CeO2 catalyst, we prepared a Ru (0001) surface model with 9 × 9 × 4 layers and a Ru–CeO2 interface model consisting of Ru cluster and CeO2 (111) surface with (6 × 6) supercell with four O–Ce–O layers, as shown in Fig. S2 (ESI).† Additionally, we set a 20 Å vacuum layer and fixed the bottom two layers for both calculation models to represent the catalyst surface. Notably, Ru (0001) surface and CeO2 (111) surface were observed using XRD measurement and TEM observation. All calculation models were depicted by visualization for electronic and structural analysis (VESTA).24
19 based on the generalized gradient approximation of Perdew–Burke–Ernzerhof (GGA-PBE).20 As a geometric optimization method of the calculation model, we used the Broyden–Fletcher–Goldfarb–Shanno (BFGS) LineSearch algorithm21 with the convergence threshold set as 10−5 eV. Additionally, we represented van der Waals interactions using DFT-D3 proposed by Grimme.22 The transition state and activation energy on each elementary step were obtained by climbing image nudged elastic band (CI-NEB) method. In this CI-NEB calculation, we used 17 intermediate images with 0.05 eV Å−1 of spring constant. All saddle points were confirmed to have only one imaginary vibration using Sella package and frequency analysis.23 To elucidate the electric field effect for ammonia decomposition on each reaction site of Ru/CeO2 catalyst, we prepared a Ru (0001) surface model with 9 × 9 × 4 layers and a Ru–CeO2 interface model consisting of Ru cluster and CeO2 (111) surface with (6 × 6) supercell with four O–Ce–O layers, as shown in Fig. S2 (ESI).† Additionally, we set a 20 Å vacuum layer and fixed the bottom two layers for both calculation models to represent the catalyst surface. Notably, Ru (0001) surface and CeO2 (111) surface were observed using XRD measurement and TEM observation. All calculation models were depicted by visualization for electronic and structural analysis (VESTA).24
Results and discussion
Electric field effects on the ammonia decomposition reaction
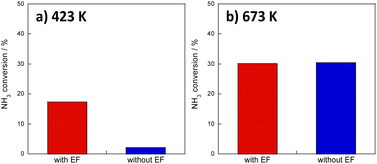
First, to facilitate ammonia decomposition at lower temperatures in an electric field, primary screening tests of activity were conducted using Ru, Ni, Fe, and Co as active metals. Also, tests were conducted using only CeO2 support as the catalyst. For these investigations, the electric field effects at a low temperature (373 K) and at a high temperature (673 K) were examined in a kinetic condition using diluted ammonia (i.e., differential conditions). Results are presented in Fig. S3 and Tables S2–S10; ESI.† Results show that even the Ru-based catalyst, which is the most active catalyst under thermocatalytic conditions, exhibits almost no ammonia decomposition activity at 373 K. However, by application of an electric field, all catalysts, not only Ru-catalyst but also the other base metal-supported catalysts, exhibited improved ammonia conversion, even at 373 K. The order of activity of the metals was found to be congruent with those of earlier reports,10 in the order of Ru > Ni > Co > Fe without an electric field at 673 K. It is noteworthy that the order of activity changes to Ru > Fe > Ni > Co in the presence of an electric field at 373 K.Screening tests up to this point have involved reactions with diluted ammonia for kinetic investigation, but given practical applications, the catalytic activity of 100% ammonia (undiluted) at low temperatures must be ascertained. Therefore, the Ru catalyst, which showed the best performance in prescreening tests, was tested for catalytic activity for ammonia decomposition at 423 K and 673 K, respectively, with and without applying an electric field. The 100% ammonia feed was not stable at 373 K. Therefore, the reactions at the lower temperature side were conducted at 423 K. Results are presented in Fig. 1. Fig. 1a presents that high activity was obtained even at 423 K with an electric field. Moreover, as shown in Fig. 1b, the effects with and without an electric field were not so different at 673 K. At lower temperatures, the previously described surface protonics can play an important role by virtue of the influence of adsorption, whereas at higher temperatures, the influence of surface protonics is reduced because of reduced adsorption: the catalytic reaction by heating might become dominant. This point is discussed specifically later.
Next, ammonia conversion at varying space velocities (i.e., GHSVs) was examined at low temperatures in the electric field using diluted ammonia in a kinetic condition. Results are presented in Fig. 2. Without an electric field, almost no activity was observed, even at low space velocity; by contrast, ammonia decomposition reached nearly 100% conversion in the presence of an electric field at low GHSVs, even at 398 K at lower space velocity. This conversion rate extends beyond the thermodynamic equilibrium at this temperature because of the irreversible pathway with hydrogen migration (i.e., surface protonics).
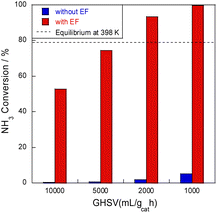 | ||
| Fig. 2 SV dependence of NH3 conversion at 398 K over 8.2 mol% Ru/CeO2: 300 mg catalyst, 0.1 MPa, and 6.0 mA. | ||
In our tests to date, the highest conversion rate obtained was 58.2 mmol-NH3 h−1 of ammonia (100%, not diluted) at SV = 4780 h−1, 550 K, and with 6.6 W of power applied, with an ammonia conversion rate of 91.2%. The catalyst's physicochemical properties were almost the same before and after the reaction (Table S11 in ESI†), so the reaction can proceed stably. The ability to decompose ammonia almost completely, even at low temperatures, is necessary for its practical use as a hydrogen carrier.
Kinetic studies of the ammonia decomposition reaction in an electric field
Meso-kinetics can reveal the relationship between catalyst structure and catalyst performance,25,26 but in this case, almost no difference in the catalyst structure was observed (as seen in ESI†), suggesting that the reaction mechanism is different. To elucidate the ammonia decomposition mechanism in an electric field, we conducted a detailed kinetic analysis using diluted ammonia to achieve a kinetic condition. Arrhenius plots of the ammonia decomposition reaction with and without an electric field are presented in Fig. 3 and Tables S12 and S13 (ESI).† Without an electric field, the plot followed the conventional Arrhenius law; the apparent activation energy was approximately 70 kJ mol−1. In the presence of an electric field, peculiar behaviour was observed. The Arrhenius plot bent in the low-temperature region at around 473 K, reflecting greater ammonia conversion at lower temperatures of 373–473 K. Such anti-Arrhenius behaviour at low temperatures was also observed in other cases along with applying an electric field.27,28 This peculiar trend suggests a change in the reaction mechanism. A lower temperature is associated with stronger adsorption and higher surface proton content on the catalyst surface. This apparent association leads to increased activity at lower temperatures corresponding to the anti-Arrhenius-like behaviour. This inference is also consistent with the fact that electric field effects were observed more strongly at lower temperatures in the activity tests.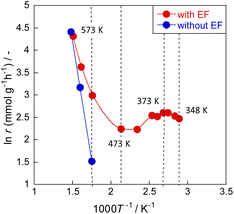 | ||
| Fig. 3 Arrhenius plots for ammonia decomposition rates over 0.85 mol% Ru/CeO2: 5% NH3/Ar = 200 SCCM, 200 mg cat, 0.1 MPa, and 0 or 6.0 mA. | ||
Up to this point, the effects of the presence or absence of an electric field on temperatures have been discussed. Nevertheless, how the effect of Joule heating caused by the application of an electric field affects the catalytic reaction remains an open question. Therefore, EXAFS was measured in situ in this system while an electric field was applied. Also, the temperature of the supported metal, Ru, at the atomic level was calculated from the Debye–Waller factor. Earlier reports have described this method.15 Detailed data are presented in Fig. S5 (ESI).† The atomic-level temperatures obtained from the Debye–Waller factor, the actual temperatures measured using a thermocouple, and the reaction results are presented in Table 1. The results indicate that below 473 K in the electric field, the temperature dependence shown by activity is minimal: reactions by the associative-type reaction mechanisms are dominant and surface proton conduction is especially important. This phenomenon is also observed in the Arrhenius plot above (Fig. 3): as the temperature is increased above 473 K, the catalytic activity attributable to heat (Langmuir–Hinshelwood type) starts to increase; the activity caused by heating becomes dominant as the temperature increases. This result is also consistent with the contents of Fig. 1b. The figure shows that the activity at low temperatures is proportional to the current value at this time: the activity at 1 mA and 3 mA is approximately 1![[thin space (1/6-em)]](https://www.rsc.org/images/entities/char_2009.gif) :
:![[thin space (1/6-em)]](https://www.rsc.org/images/entities/char_2009.gif) 3 (Table 1). As shown in Fig. S6 (ESI),† NH3 conversion increased linearly as the current density increased because surface protonics are positively correlated with the amount of current, which governs the reaction rate at low temperatures.
3 (Table 1). As shown in Fig. S6 (ESI),† NH3 conversion increased linearly as the current density increased because surface protonics are positively correlated with the amount of current, which governs the reaction rate at low temperatures.
| Current (mA) | Furnace temperature (K) | Debye–Waller factor | Estimated temperature (K) | NH3 conversion (%) |
|---|---|---|---|---|
| 1 | 323 | 0.078 | 390 | 6.1 |
| 373 | 0.079 | 413 | 7.6 | |
| 423 | 0.080 | 436 | 6.1 | |
| 3 | 323 | 0.080 | 436 | 18.1 |
| 373 | 0.082 | 482 | 19.0 |
To confirm the role of surface protonics in the reaction, catalysts with different supported Ru particle diameters in the range of 3.5–6 nm were prepared. Then the turnover frequency (TOF) values in the presence and absence of an electric field were determined respectively from the hydrogen production reaction rate. The particle size of the supported Ru metal was obtained from TEM. Also, the metal surface area and edge perimeter lengths were calculated using a hemispherical approximation. The Ru atomic weight was 101.07 g mol−1. The Ru atomic radius was 1.33 Å. The Ru density was 12.41 g cm−3. Two TOFs were calculated simultaneously. One is TOF-s, which is the general value of the reaction rate divided by the metal surface area. The other is TOF-p, which is the reaction rate divided by the sum of the metal–support interface perimeters. Reportedly, the latter is better to use in cases where surface protonics affect the reaction.11 As a result, as shown in Fig. S7 and Table S14 (ESI),† first, in the reaction at 573 K by heating, the TOF-s was constant (about 500 h−1), similar to the reaction on a typical metal catalyst. Moreover, TOF-p showed no constant correlation. Therefore, the catalytic reaction at 573 K by heating can be regarded as a general Langmuir–Hinshelwood-type reaction over the metal surface. However, the reaction which occurred under an electric field at 473 K did not result in constant TOF-s, whereas TOF-p was shown as constant (ca. 2200 h−1). This finding provides evidence that the reaction in the electric field takes place at the interface of the support and the Ru metal, indicating that the reaction results from surface protonics. The increase in activity with increasing Ru loading was greater in the thermal catalytic tests, and the activity was proportional to the Ru surface area in the thermal catalytic tests. On the other hand, it was proportional to the Ru–CeO2 interface length in the electric field catalytic tests. These results suggest that the surface proton concentration is not affected by increasing Ru loading, and the number of active sites is important for the activity. Furthermore, to examine the surface proton content, the adsorbed species on the catalyst during the reaction were trapped at low temperatures, and then the temperature was increased and the desorption peak was observed by using Q-mass. As shown in Fig. S8 and Table S15 (ESI),† it was confirmed that the desorbed H2/N2 ratio was larger when an electric field was applied during the reaction than when no electric field was applied. Therefore, it is considered that the application of an electric field contributes to the increase in the amount of adsorbed surface protons.
To elucidate differences in the reaction mechanisms between the heated catalysis and catalysis by surface protonics, the effects of varying partial pressures of ammonia, hydrogen, and nitrogen were also investigated using 0.85 mol% Ru/CeO2 to ascertain the corresponding reaction orders. These experiments were conducted at 373 K with an electric field and at 573 K without an electric field because the ammonia decomposition activity was almost identical under these two conditions, making them suitable for comparison. Table 2 and Fig. S9 (ESI)† show reaction orders found with and without an electric field. The reaction order for ammonia was zero when no electric field was applied, but became first in the order when an electric field was applied. According to earlier reports, the change in the reaction order for ammonia originates from a change in the rate-determining step. When nitrogen desorption is the rate-determining step, it is independent of the ammonia partial pressure. However, when the nitrogen desorption step is accelerated, it becomes first-order with respect to the ammonia partial pressure.7,29,30 These results agree with earlier reports describing that nitrogen desorption is considered the rate-limiting step of low-temperature thermocatalytic ammonia decomposition because of the high adsorption energy of the N atoms on the catalyst surface. That high adsorption energy hinders the decomposition reaction by higher coverage with N2. It is particularly interesting that, the ammonia reaction order changed from 0.1 to 1.4 in the presence of an electric field, reflecting acceleration of the nitrogen desorption process. Results demonstrated further that the hydrogen order changed from −0.6 to −0.2, thereby indicating a reduction in hydrogen poisoning.7,29,30 Applying an electric field accelerated the nitrogen desorption step, thereby changing the rate-determining step. That finding also suggests that hydrogen positively affects the reaction. To elucidate this phenomenon, we conducted isotopic exchange tests using ND3; those findings also supported this result. As shown in Table 3 and Fig. S10 (ESI),† no isotope effect was observed at 473 K without the electric field, indicating the nitrogen desorption process as rate-limiting. However, with the electric field, isotope effects were observed at 473 K, indicating that reactions involving H atoms are the rate-determining step.
| r = k[NH3]α[N2]β[H2]γ | |||
|---|---|---|---|
| α | β | γ | |
| Without EF | 0.1 | 0 | −0.6 |
| With EF | 1.4 | 0 | −0.2 |
| Catalyst temperature (K) | Isotope kinetic ratio, rNH3/rND3 | |
|---|---|---|
| With EF | Without EF | |
| 348 | 1.21 | — (no activity) |
| 351 | 1.30 | — (no activity) |
| 356 | 1.49 | — (no activity) |
| 373 | 1.26 | — (no activity) |
| 398 | 1.67 | — (no activity) |
| 473 | 2.10 | 0.99 |
| 523 | — | 0.81 |
| 623 | — | 1.48 |
| 673 | — | 1.22 |
| 723 | — | 1.13 |
Elucidation of the reaction mechanism by theoretical calculations
Based on these experimentally obtained results, theoretical calculations were applied to elucidate the reaction mechanism of ammonia decomposition under the electric field. Generally, ammonia decomposition is known to generate N2 molecules through dehydrogenation from ammonia molecules to N atoms and through the associative desorption process of adsorbed N atoms, as shown in eqn (2)–(7).31,32In this reaction, molecular N2 can be generated by diffusing the adsorbed N atoms on a metal surface with interaction between their 2p orbitals. However, the adsorbed N atoms have d-π* orbitals with d electrons of the metal surface.33,34 Because the d-π* orbitals engender strong interaction between N atoms and the metal surface, the associative desorption of N atoms (*N + *N → *N2 → N2 + 2σ) requires much energy. Thereby, it becomes the rate-determining step at low temperatures in the conventional catalytic decomposition of ammonia.35,36
Consequently, two types of N2 formation mechanisms are assumed after the dehydrogenation of NH3 to NH adsorbate, as portrayed in Fig. 4: (A) *N formation mechanism and (B) *N2H2 formation mechanism.37–42 The elementary steps of the respective mechanisms are presented below.
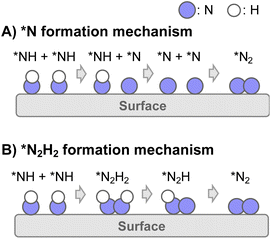 | ||
| Fig. 4 Schematic image of N2 formation mechanisms of two types: (A) *N formation mechanism and (B) *N2H2 formation mechanism. | ||
(A) *N formation mechanism
| *NH + σ → *N + *H (5 repeated) |
| *N + *N → N2 + 2σ (6 repeated) |
(B) *N2H2 formation mechanism
| 2*NH → *N2H2 + σ | (8) |
| *N2H2 + σ → *N2H + *H | (9) |
| *N2H + σ → *N2 + *H | (10) |
| *N2 → N2 + σ | (11) |
Results of theoretical investigations have indicated that the association of surface NH groups through intermediates such as N2H2 facilitates N2 desorption.37–42 Actually, in photocatalytic ammonia decomposition and plasma ammonia decomposition, N2Hx have been observed as intermediates.43
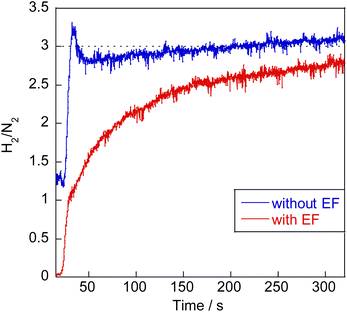
Earlier reports have described that dehydrogenation from NH3 to NH can proceed easily.31,32 Therefore, dehydrogenation from NH3 to NH is not an important step for the whole reaction performance, either with or without the electric field. Therefore, we compared two assumed mechanisms shown above (A) and (B) using the surface with two NH adsorbates as a starting model. Moreover, to represent the surface during the thermal reaction and the surface during the electric field reaction respectively, we considered the N-terminated model and the H-terminated surface model, as presented in Fig. 5, based on the Q-mass result (Fig. 6). Specifically examining the H2/N2 ratio of the outlet gas, the differences of adsorbed species with and without an electric field were investigated. The Q-mass results were normalised so that an H2/N2 ratio of 3 was obtained at a steady state. As Fig. 6 shows, the H2/N2 ratio observed immediately after the start of the reaction differed in the two conditions: under thermal catalytic conditions, hydrogen was observed to be desorbed preferentially immediately after the reaction. In other words, N atoms were regarded as covering the catalyst surface. By contrast, when an electric field was applied, nitrogen was predominantly desorbed immediately after the reaction, suggesting that H atoms remained on the catalyst surface. Additionally, the TOF tests changing the Ru particle size revealed that the thermal catalytic reaction can proceed on the Ru metal. However, the electric field applied reaction can proceed at the interface between the Ru metal and CeO2 support (Fig. S7 in ESI†).
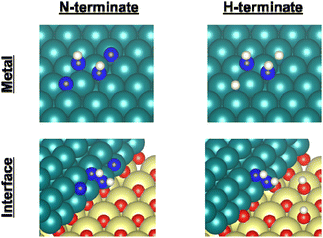 | ||
| Fig. 5 Catalyst surface models for the respective experiment conditions. Ru, Ce, O, N, and H atoms are shown respectively as green, yellow, red, blue, and white. | ||
Therefore, as presented in Fig. 5, the N-terminated Ru surface model and N-terminated Ru–CeO2 interface model were regarded as the catalyst surface under the thermal catalytic reaction. On the other hand, the H-terminated Ru surface model and H-terminated Ru–CeO2 interface model were regarded as the catalyst surface under the electric field reaction. In this constructed model, the adsorption configurations of two N or H atoms on the Ru surface were set to the most stable configurations (Fig. S11 and S12; ESI†). Based on the discussion presented above, we distinguished between the thermal catalytic reaction and the electric field applied reaction by constructing models with various terminates. Then we investigated two assumed mechanisms for the models.
The energy diagrams of each assumed mechanism and each reaction site are presented in Fig. 7 and the detailed reaction enthalpy and activation energy on each elementary step are summarized in Table S16 (ESI).† The N–N bonding formation steps and NH–NH bonding formation steps involve a large energy change in the *N formation mechanism and *N2H2 formation mechanism, respectively.
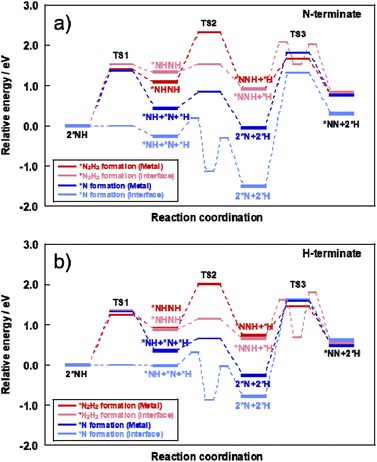 | ||
| Fig. 7 Energy diagram of *N formation mechanism and *N2H2 formation mechanism on each reaction site using (a) N-terminate model and (b) H-terminate model. | ||
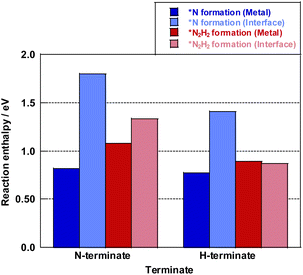
Here, the reaction enthalpy changes of each rate-determining step are presented in Fig. 8. From the viewpoint of the reaction enthalpy change in Fig. 8, the *N formation energy on the Ru metal can be smaller than other mechanisms and the reaction site in case of the N-terminated model, which indicates that the thermal reaction can proceed via the *N formation mechanism on the Ru metal. This reaction mechanism is the same as that described in earlier reports about the thermal ammonia decomposition reaction. However, the H-terminate, which represents the electric field reaction, brings the relatively small reaction enthalpy of the rate-limiting step in the *N2H2 formation mechanism on the interface. Although *N formation energy on Ru metal is smaller even in the H-terminate, the activation energy of *N2H2 formation on the interface (1.35 eV) is lower than that of *N formation on Ru metal (1.87 eV) as shown in Fig S13 (ESI).† Thus, it shows that the electric field reaction can proceed via the *N2H2 formation mechanism on the Ru–CeO2 interface at low temperatures, unlike the thermal reaction. This mechanism in the electric field reaction presented in the discussion above is also supported by experimentally obtained results of partial pressure dependence tests and isotope exchange tests. Therefore, applying the electric field can lead to high H atom coverage, changing the adsorption state of NH species and the reaction mechanism. Consequently, NH3 decomposition in the electric field can proceed even under low temperatures.
Discussion
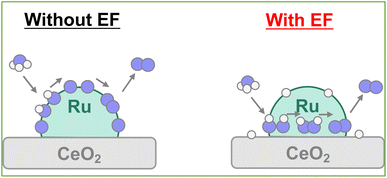
Earlier reports have described that the surface proton can migrate on the catalyst under the application of an electric field, which is called surface protonics.44,45 Actually, AC impedance measurements confirmed that surface proton conductivity was enhanced in the H-terminated support under H2 supply, as shown in Fig. S14 and Table S17 (ESI).† When measured under Ar atmosphere after the hydrogen supply was stopped, the conductivity reverted almost to its original value. Therefore, it is considered that no effect of reduction of CeO2 by hydrogen occurred, such as the generation of oxygen defects or electrons. Furthermore, the surface conductivity was enhanced under ammonia supply. It was predicted that the few protons generated by thermal decomposition would become conduction carriers when the electric field was applied. Even at room temperature, catalytic ammonia decomposition proceeded, but the formed nitrogen atoms covered the catalyst surface and prevented further reaction (Fig. S15; ESI†). When applying the electric field, the surface migration of the adsorbed hydrogen atoms at low temperatures promotes the reaction. Consequently, even if the NH adsorbates were dehydrogenated to the N atoms, the possibility exists that the surface protons can hydrogenate the N atoms to the NH adsorbates again and can retain the NH adsorbates on the surface by the surface protonics. Actually, from the perspective of the reaction enthalpy and activation energy in the dehydrogenation step from NH adsorbates to N atoms on the Ru–CeO2 interface, the reaction enthalpy and activation barrier is small in the H-terminate, which represents the electric field reaction, indicating that hydrogenation from the N atoms to NH adsorbates can occur easily near the interface. In addition, the *N2H2 intermediate formation step is particularly likely to occur on the surface with abundant NH adsorbates.40 Therefore, it is considered that the high coverage of NH adsorbate by the surface protonics under the electric field enables the different mechanisms to form N–N bonds (Fig. 9).Conclusions
Results of this study demonstrated that when Ru/CeO2 is used as a catalyst and a DC electric field is applied, ammonia decomposition proceeds efficiently even at low temperatures: below 473 K. Given a long contact time, a conversion rate of nearly 100% can be achieved even at 398 K. The transient Q-mass results show that hydrogen and nitrogen are formed on the catalyst when ammonia is fed. However, without an electric field, nitrogen desorption is slow, then the reaction stops there. However, when an electric field is applied, the hydrogen assists the surface protonics. A surface-protonics-assisted reaction via the N2H2 intermediate is regarded as proceeding. Therefore, on-demand synthesis of CO2-free hydrogen by ammonia decomposition can occur at low temperatures with an irreversible pathway to achieve high conversion and high reaction rates.Data availability
The data supporting this article have been included as part of the ESI.†Author contributions
Conceptualization, project administration and supervision: K. Mitarai, J. G. Seo and Y. Sekine, funding acquisition: Y. Sekine, data curation and formal analysis: S. Doi, Y. Ofuchi and K. Mitarai, investigation: S. Doi, Y. Ofuchi, K. Mitarai and M. Hayashi, methodology and software: K. Saegusa and H. Sampei, validation: K. Mitarai, visualization: Y. Ofuchi, K. Saegusa, S. Doi and Y. Sekine, writing – original draft and review & editing: Y. Ofuchi, K. Saegusa, S. Doi, K. Mitarai, T. Higo and Y. Sekine.Conflicts of interest
The authors have no conflict of interest.Acknowledgements
The authors thank Ms Ayaka Shigemoto (Waseda University) for her great assistance in the Q-mass analysis. The experiment of TEM measurement was performed at the Joint Research Center for Environmentally Conscious Technologies in Materials Science at ZAIKEN, Waseda University.References
- U. B. Demirci and P. Miele, Energy Environ. Sci., 2011, 4, 3334 RSC.
- F. Schüth, R. Palkovits, R. Schlögl and D. S. Su, Energy Environ. Sci., 2012, 5, 6278–6289 RSC.
- A. Klerke, C. H. Christensen, J. K. Nørskov and T. Vegge, J. Mater. Chem., 2008, 18, 2304–2310 RSC.
- B. C. Tashie-Lewis and S. G. Nnabuife, Chem. Eng. J. Adv., 2021, 8, 100172 CrossRef CAS.
- T. He, P. Pachfule, H. Wu, Q. Xu and P. Chen, Nat. Rev. Mater., 2016, 1, 16067 CrossRef.
- F. Schüth, R. Palkovits, R. Schlögl and D. S. Su, Energy Environ. Sci., 2012, 5, 6278–6289 RSC.
- J. J. Vajo, W. Tsai and W. H. Weinberg, J. Phys. Chem., 1985, 89, 3243–3251 CrossRef CAS.
- W. Tsai and W. H. Weinberg, J. Phys. Chem., 1987, 91, 5302–5307 CrossRef CAS.
- K. Tamaru, Acc. Chem. Res., 1988, 21, 88–94 CrossRef CAS.
- J. C. Ganley, F. S. Thomas, E. G. Seebauer and R. I. Masel, Catal. Lett., 2004, 96, 117–122 CrossRef CAS.
- R. Manabe, S. Okada, R. Inagaki, K. Oshima, S. Ogo and Y. Sekine, Sci. Rep., 2016, 6, 3–4 CrossRef PubMed.
- M. Torimoto, S. Ogo, D. Harjowinoto, T. Higo, J. G. Seo, S. Furukawa and Y. Sekine, Chem. Commun., 2019, 55, 6693–6695 RSC.
- K. Takise, A. Sato, K. Murakami, S. Ogo, J. G. Seo, K. Imagawa, S. Kado and Y. Sekine, RSC Adv., 2019, 9, 5918–5924 RSC.
- K. Takise, A. Sato, K. Muraguchi, S. Ogo and Y. Sekine, Appl. Catal., A, 2019, 573, 56–63 CrossRef CAS.
- Y. Hisai, Q. Ma, T. Qureishy, T. Watanabe, T. Higo, T. Norby and Y. Sekine, Chem. Commun., 2021, 57, 5737–5749 RSC.
- M. Kosaka, T. Higo, S. Ogo, J. G. Seo, K. Imagawa, S. Kado and Y. Sekine, Int. J. Hydrogen Energy, 2020, 45, 738–743 CrossRef CAS.
- M. L. T. Trivino, S. Doi, Y. S. Kang, C. U. Lee, Y. Sekine and J. G. Seo, Chem. Eng. J., 2023, 476, 146715 CrossRef CAS.
- Matlantis, https://matlantis.com/, software as a service style material discovery tool, accessed July 10, 2024 Search PubMed.
- S. Takamoto, C. Shinagawa, D. Motoki, K. Nakago, W. Li, I. Kurata, T. Watanabe, Y. Yayama, H. Iriguchi, Y. Asano, T. Onodera, T. Ishii, T. Kudo, H. Ono, R. Sawada, R. Ishitani, M. Ong, T. Yamaguchi, T. Kataoka, A. Hayashi, N. Charoenphakdee and T. Ibuka, Nat. Commun., 2022, 13, 2991 CrossRef CAS PubMed.
- J. P. Perdew, K. Burke and M. Ernzerhof, Phys. Rev. Lett., 1996, 77, 3865–3868 CrossRef CAS PubMed.
- A. H. Larsen, J. J. Mortensen, J. Blomqvist, I. E. Castelli, R. Christensen, M. Dułak, J. Friis, M. N. Groves, B. Hammer, C. Hargus, E. D. Hermes, P. C. Jennings, P. B. Jensen, J. Kermode, J. R. Kitchin, E. L. Kolsbjerg, J. Kubal, K. Kaasbjerg, S. Lysgaard, J. B. Maronsson, T. Maxson, T. Olsen, L. Pastewka, A. Peterson, C. Rostgaard, J. Schiøtz, O. Schütt, M. Strange, K. S. Thygesen, T. Vegge, L. Vilhelmsen, M. Walter, Z. Zeng and K. W. Jacobsen, J. Phys.: Condens. Matter, 2017, 29, 273002 CrossRef PubMed.
- S. Grimme, J. Antony, S. Ehrlich and S. Krieg, J. Chem. Phys., 2010, 132, 154104 CrossRef.
- E. Hermes, K. Sargsyan, H. N. Najm and J. Zádor, J. Chem. Theory Comput., 2019, 15, 6536–6549 CrossRef CAS.
- K. Momma and F. Izumi, J. Appl. Crystallogr., 2011, 44, 1272–1276 CrossRef CAS.
- W. Chen, G. Qian, Y. Wan, D. Chen, X. Zhou, W. Yuan and X. Duan, Acc. Chem. Res., 2022, 55, 3230–3241 CrossRef CAS.
- W. Chen, W. Fu, X. Duan, B. Chen, G. Qian, R. Si, X. Zhou, W. Yuan and D. Chen, Engineering, 2022, 14, 124–133 CrossRef.
- K. Murakami, Y. Tanaka, R. Sakai, K. Toko, K. Ito, A. Ishikawa, T. Higo, T. Yabe, S. Ogo, M. Ikeda, H. Tsuneki, H. Nakai and Y. Sekine, Catal. Today, 2020, 351, 119–124 CrossRef.
- K. Murakami, Y. Tanaka, R. Sakai, Y. Hisai, S. Hayashi, Y. Mizutani, T. Higo, S. Ogo, J. G. Seo, H. Tsuneki and Y. Sekine, Chem. Commun., 2020, 56, 3365–3368 RSC.
- C. Egawa, T. Nishida, S. Naito and K. Tamaru, J. Chem. Soc., Faraday Trans. 1, 1984, 80, 1567–1578 RSC.
- M. C. J. Bradford, P. E. Fanning and M. A. Vannice, J. Catal., 1997, 172, 479–484 CrossRef CAS.
- T. E. Bell and L. T. Murciano, Top. Catal., 2016, 59, 1438–1457 CrossRef CAS.
- S. Mukherjee, S. V. Devaguptapu, A. Sviripa, C. R. F. Lund and G. Wu, Appl. Catal., B, 2018, 226, 162–181 CrossRef CAS.
- J.-C. Liu, X.-L. Ma, Y. Li, Y.-G. Wang, H. Xiao and J. Li, Nat. Commun., 2018, 9, 1610 CrossRef PubMed.
- H. Zhang, C. Cui and Z. Luo, J. Phys. Chem. C, 2020, 124, 6260–6266 CrossRef CAS.
- H. Tabassum, S. Mukherjee, J. Chen, D. Holiharimanana, S. Karakalos, X. Yang, S. Hwang, T. Zhang, B. Lu, M. Chen, Z. Tang, E. A. Kyriakidou, Q. Ge and G. Wu, Energy Environ. Sci., 2022, 15, 4190–4200 RSC.
- S. R. Deshmukh, A. B. Mhadeshwar and D. G. Vlachos, Ind. Eng. Chem. Res., 2004, 43, 2986–2999 CrossRef.
- K. Yuan, P. Hao, X. Li, Y. Zhou, J. Zhang and S. Zhong, New J. Chem., 2021, 45, 15234 RSC.
- P. Xie, Y. Yao, Z. Huang, Z. Liu, J. Zhang, T. Li, G. Wang, R. S. Yassar, L. Hu and C. Wang, Nat. Commun., 2019, 10, 4011 CrossRef PubMed.
- D. Dirtu, L. Odochian, A. Pui and I. Humelnicu, Cent. Eur. J. Chem., 2006, 4(4), 666–673 Search PubMed.
- C.-z. He, H. Wang, L.-y. Huai and J.-y. Liu, J. Phys. Chem. C, 2012, 116, 24035–24045 CrossRef CAS.
- E. Moran, C. Cattaneo, H. Mishima, B. A. López, S. P. Silvetti, J. L. Rodriguez and E. Pastor, J. Solid State Electrochem., 2008, 12, 583–589 CrossRef CAS.
- A. P. C. Reed and R. M. Lambert, J. Phys. Chem., 1984, 88, 1954–1959 CrossRef CAS.
- S. Zhang, Z. He, X. Li, J. Zhang, Q. Zang and S. Wang, Nanoscale Adv., 2020, 2, 3610–3623 RSC.
- Y. Hisai, K. Murakami, Y. Kamite, Q. Ma, E. Vøllestad, R. Manabe, T. Matsuda, S. Ogo, T. Norby and Y. Sekine, Chem. Commun., 2020, 56, 2699 RSC.
- T. Matsuda, R. Ishibashi, Y. Koshizuka, H. Tsuneki and Y. Sekine, Chem. Commun., 2022, 58, 10789 RSC.
Footnotes |
| † Electronic supplementary information (ESI) available. See DOI: https://doi.org/10.1039/d4sc04790g |
| ‡ Y. O., K. M. and S. D. contributed equally. |
| This journal is © The Royal Society of Chemistry 2024 |

