
 Open Access Article
 This Open Access Article is licensed under a Creative Commons Attribution-Non Commercial 3.0 Unported Licence
Massive acceleration of SN2 reaction using the oriented external electric field†
Chun
Tang‡
,
Meiling
Su‡
,
Taige
Lu‡
,
Jueting
Zheng‡
,
Juejun
Wang
,
Yu
Zhou
,
Yu-Ling
Zou
,
Wenqing
Liu
,
Ruiyun
Huang
,
Wei
Xu
,
Lijue
Chen
,
Yanxi
Zhang
,
Jie
Bai
,
Yang
Yang
 ,
Jia
Shi
,
Junyang
Liu
* and
Wenjing
Hong
,
Jia
Shi
,
Junyang
Liu
* and
Wenjing
Hong
State Key Laboratory of Physical Chemistry of Solid Surfaces, College of Chemistry and Chemical Engineering, Innovation Laboratory for Sciences and Technologies of Energy Materials of Fujian Province (IKKEM), Xiamen University, Xiamen, China. E-mail: jyliu@xmu.edu.cn
First published on 25th July 2024
Abstract
Nucleophilic substitution is one of the most fundamental chemical reactions, and the pursuit of high reaction rates of the reaction is one of the ultimate goals in catalytic and organic chemistry. The reaction barrier of the nucleophilic substitution originates from the highly polar nature of the transition state that can be stabilized under the electric field created by the solvent environment. However, the intensity of the induced solvent-electric field is relatively small due to the random orientation of solvent molecules, which hinders the catalytic effects and restricts the reaction rates. This work shows that oriented external electric fields applied within a confined nanogap between two nanoscopic tips could accelerate the Menshutkin reaction by more than four orders of magnitude (over 39![[thin space (1/6-em)]](https://www.rsc.org/images/entities/char_2009.gif) 000 times). The theoretical calculations reveal that the electric field inside the nanogap reduces the energy barrier to increase the reaction rate. Our work suggests the great potential of electrostatic catalysis for green synthesis in the future.
000 times). The theoretical calculations reveal that the electric field inside the nanogap reduces the energy barrier to increase the reaction rate. Our work suggests the great potential of electrostatic catalysis for green synthesis in the future.
Introduction
The nucleophilic substitution (SN2) reaction constitutes one of the most fundamental reactions in chemistry and biology,1 and the Menshutkin reaction is a typical SN2 reaction widely used for converting tertiary amines into quaternary ammonium cations.2 Some previous studies revealed a slight increase when switching to highly polar solvents3–5 such as dimethylsulfoxide (DMSO).6 This effect is attributed to the electric field induced by the solvent molecules. Solvent molecules accelerate the reaction by generating field-induced stabilization energy of μ × ES (μ, the dipole moment of the molecule; ES, the strength of the field),7,8 thus lowering the reaction barrier.9 However, the Menshutkin reaction rate modulated through the solvent effect can only be changed within two orders of magnitude,10 mainly due to the relatively limited polarity of solvents to generate a limited electric field effect. Pioneering theoretical11 and recent experimental studies12,13 demonstrated that the external electric fields (EEF) can significantly influence the reaction activity, thus opening up new avenues for catalyzing organic chemical reactions14,15 through the introduction of the EEF.Towards the acceleration of reactions using EEF, the orientation control of the reactants relative to the direction of EEF remained challenging since recent studies demonstrate the importance of the reaction-axis rule14,16,17 and suggest that the catalytic effect of EEF is highly sensitive to such relative orientation. The rational design of the reaction system that aligns the reaction-axis with the external electric field becomes significant, which will effectively accelerate the Menshutkin reaction. The random orientation of the reaction-axis that occurs in the solvent environment in the ensemble system, revealed by theoretical calculations,18 hinders the efficient utilization of EEF. Previous studies introduced catalytic nanocavities such as macrocyclic organic compounds19 or carbon nanotubes (CNTs)20,21 to create a confined space for the restriction of the transitional freedom and thus speed the Menshutkin reaction up to 3 orders of magnitude. However, the EEF strength generated around the nanocavity is still relatively limited by the solvent molecules (approximately ranging from 0.4 to 1.2 × 10⁸ V m−1),18 suggesting the importance of combining highly oriented EEF with high field strength to achieve a significantly improved catalytic effect of EEF. Recently, single-molecule break junction techniques8 and nano-gapped graphene electrodes22,23 have been demonstrated to determine the reaction rate of the EEF-catalyzed reaction between the nano-spaced electrodes with an EEF strength reaching the scale of 108–10 V m−1,8,17 which will be even 1–2 orders of magnitude higher than that at the catalytic nanocavity and offers the opportunity to align the relative orientation between the reaction-axis of the SN2 reaction and EEF to obtain high reaction rate.24–28
Herein, we demonstrated that the Menshutkin reaction within the nano-spaced electrodes is significantly accelerated using the scanning tunneling microscope break junction (STM-BJ) technique and the combination of mechanically controllable break junction with Raman measurement29–31 (MCBJ-Raman, see Scheme 1). We compared the reaction rates from the STM-BJ experimental with macroscopic scale characterizations, demonstrating that the Menshutkin reaction is accelerated by over four orders of magnitude (over 39000 times) compared to the macroscopic solution, which is the largest accelerating ratio of the Menshutkin reaction reported so far. We further carried out the Raman characterizations and theoretical calculations to reveal the role of EEF in the catalysis of the reaction at the single-molecule scale.
 | ||
| Scheme 1 Scheme illustrating the EEF-catalyzed SN2 reaction detected by single-molecule electrical measurements. The upper panel shows a typical SN2 reaction of the Menshutkin reaction. | ||
Results and discussion
Single-molecule electrical characterizations
We choose 4-[4-(methylthio)phenyl]pyridine (MPP) as the nucleophile reagent and evaluate the EEF-catalysis of Menshutkin reaction when adding the 1-iodooctane (IOA) as the methyl transfer reagent. The pyridyl of MPP plays dual roles, which is not only the anchor group to vertically interact with the electrode,32 but also the reactive site to trigger the Menshutkin reaction with the IOA (see Scheme 1). The pyridinium unit generated after the reaction is still a good anchor group to interact with gold electrodes33,34 to form two-end junctions, enabling the detection of different species during the reaction. The STM-BJ experiments were carried out to investigate the Menshutkin reaction by applying a bias of 50 mV in a solution of 30 μL MPP (1.0 mM) in 1,2,4-trichlorobenzene (TCB), and then the STM-BJ experiment was continued when adding a 30 μL IOA solution with 100 equivalent amounts to the MPP solution. Using a large excess of IOA can ensure a relatively constant concentration of IOA during the reaction process. Therefore, a quasi-first-order reaction mechanism is expected according to previous results.17,35We observed that the individual conductance-distance traces exhibited a prominent conductance plateau (blue in Fig. 1a). As shown in the blue area of Fig. 1c, a narrow and well-defined peak is centered at 10−2.7G0 (G0 is the quantum conductance that is equal to 77.5 μS) through the collection of 2210 individual traces to construct the one-dimensional (1D) conductance histogram. The subtle peak observed around 10−0.5G0 is associated with the solvent molecule TCB forming Au/TCB/Au single-molecule junctions.36 After adding the IOA solution, the traces with a shorter conductance plateau became dominant (black traces, Fig. 1a), suggesting the capture of a new species by STM-BJ, and the feature of the traces is quite similar to the traces of the product (green traces, Fig. 1a), i.e., 1-octyl-1-methyl-4-[4-(methylthio)phenyl]-pyridinium (OMPP). The conductance histogram changed over time (Fig. 1b; 1834, 1757, 1627, 1740, and 1746 traces were collected within every 20 min, respectively. See Fig. S16b† for all 1D histograms), and the height of the conductance peak belonging to MPP was decreasing, suggesting the consumption of MPP after the addition of IOA (the control measurement of IOA showed that there was no distinct conductance feature, see the grey area in Fig. 1c, S11c and d†). After 150 minutes, the conductance histogram evolution ceased. We then generated a 1D conductance histogram using the traces from 101–150 min (represented by the black arrow in Fig. 1c; 3780 traces were collected). The histogram displayed a peak with a broader distribution, centered at approximately 10−3.0G0. This peak indicated the signal of the SN2 product, i.e., OMPP. To rule out the potential conflicts in analyzing the data in a log-binning and linear scales,37 we plotted the 1D histogram of solvent TCB and the reaction in both log and linear scales in Fig. S14.† We found a clear molecular peak centered around 10−3.0G0, while TCB solvent shows no explicit peak. In addition, a control experiment measuring a mixture of 4,4′-bis(methylthio)-1,1′-biphenyl and IOA (Fig. S20†) and a region-based automated data clustering algorithm (see details in Fig. S32–S36†) suggested that the STM-BJ measurement is still viable for more than 6 hours in the reaction mixture.
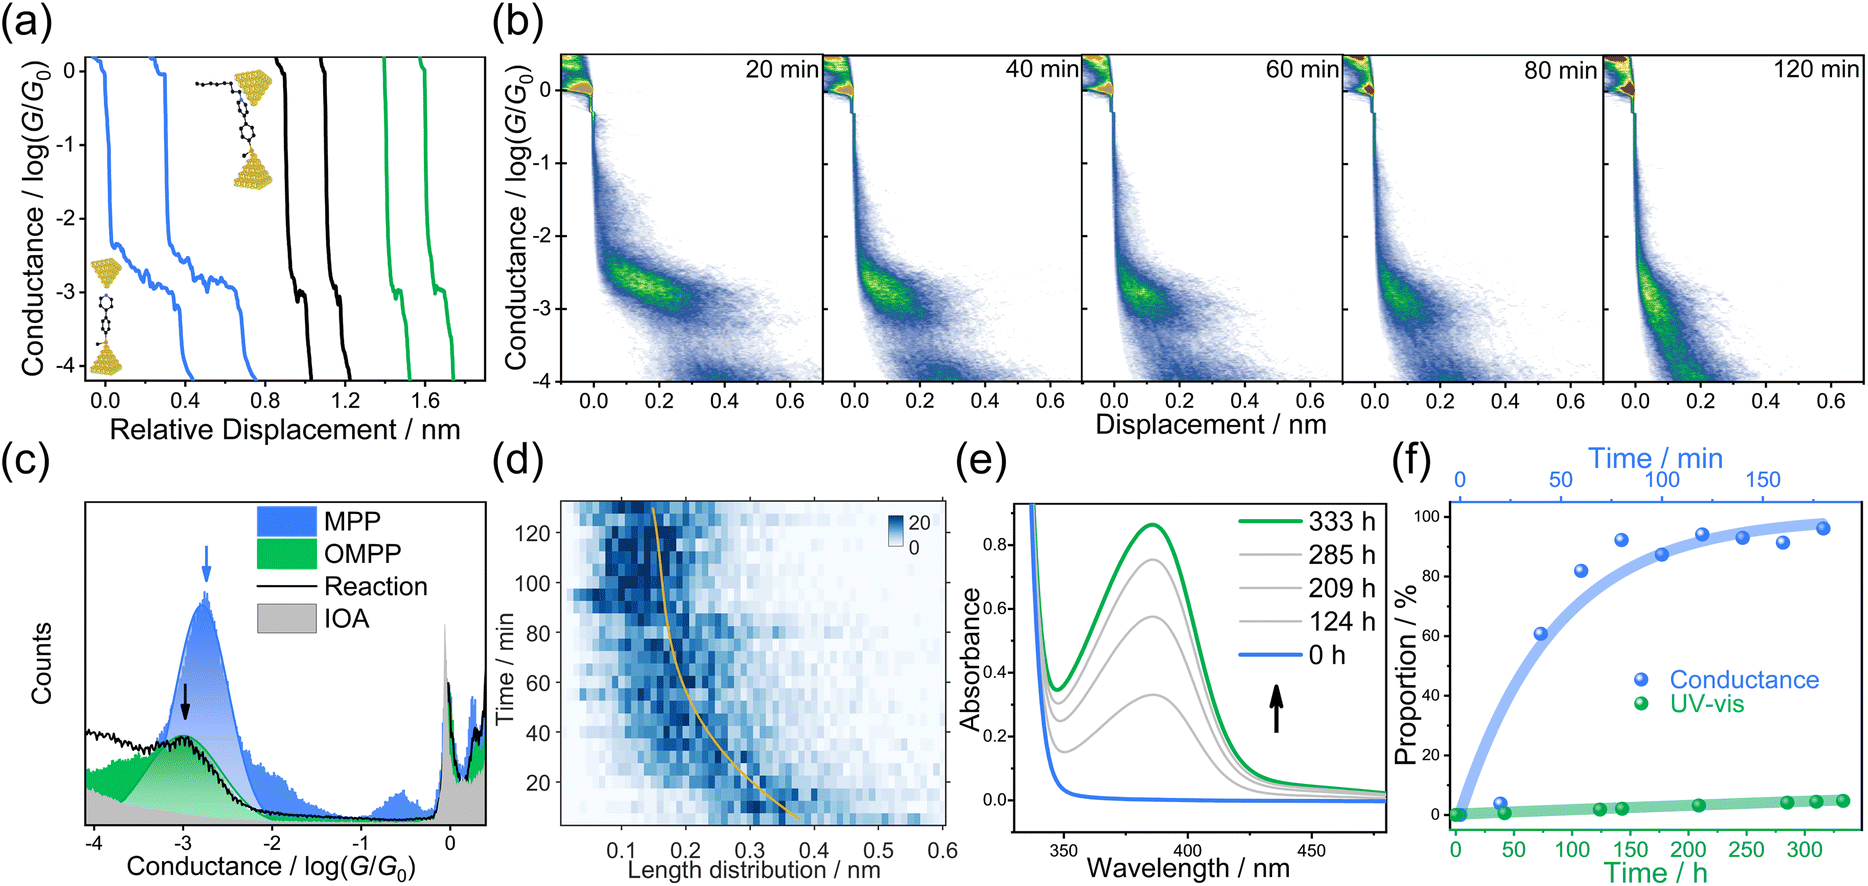 | ||
| Fig. 1 Single-molecule break junction and UV-Vis measurements of the Menshutkin reaction in the TCB solvent. (a) Typical conductance traces of pure MPP (blue), the product after adding IOA solution into MPP (black), and pure OMPPvia organic synthesis (green). Insets: schematic of the junction geometry of MPP (left-bottom) and OMPP (right-top). (b) 2D conductance-displacement histograms constructed from different time periods in TCB at a bias of 50 mV. Insets: plateau distributions of MPP and OMPP. (c) Logarithmically binned 1D histograms of MPP (blue), OMPP (green), IOA (grey), and 150 min of the reaction (black line) at a bias voltage of 50 mV. (d) Plateau length distributions as a function of time between 10−3.6G0 and 10−0.3G0, which show a clear transition from a more extended plateau at the start to a much shorter one at the end. The yellow guide line is fitted from the maximum value of each bin of the y-axis (time). (e) In situ UV-Vis monitoring of the reaction in the solution when mixing MPP with IOA. (f) The proportion of OMPP extracted from STM-BJ (blue dots) and UV-Vis (green dots) as a function of time. The proportion of OMPP from UV-Vis was obtained from pure species measurement in Fig. S5a.† The proportion of OMPP from STM-BJ was obtained from the binary Gaussian distribution in Fig. 1b. | ||
To further understand the conductance signal obtained after 150 min conductance measurement, we synthesized OMPP using a conventional organic synthetic method of Menshutkin reaction (ESI,† Materials and synthesis). The purified OMPP molecule was dissolved in TCB with a concentration of 1 mM, and the conductance was measured under the same condition. The typical conductance-distance traces of OMPP molecules shown in Fig. 1a and the corresponding 1D conductance histogram (green) constructed from 2069 curves in Fig. 1c are quite similar to the histogram with a black curve, suggesting that the reaction product after adding IOA in MPP solution was OMPP (Theoretical calculations are in Fig. S30†).
The 2D conductance-distance histogram analysis further validated the assignment of the corresponding components. Considering the addition of 0.5 nm ‘snap-back’ distance after the break of gold point contact (Fig. S11a†), the junction length of MPP was 0.88 nm, as determined in the 2D conductance histogram (Fig. S11e†), which is similar to the theoretically calculated length of the molecular junction (Fig. S29a†). The length of MPP is distinct from the junction length of OMPP with 0.64 nm (Fig. S11f†), suggesting a junction geometry with the pyridinium ring interacting with one of the gold electrodes,38 which agrees with the theoretical junction length (Fig. S29b†). Therefore, the significant change in junction length from MPP to OMPP can be a characteristic feature to distinguish these two components (insets in each column of Fig. 1b). It was shown that a clear trend of plateau lengths decreases during the reaction process and finally remains unchanged, and the 2D histogram finally became unchanged after 120 min. We plotted the average junction length distribution against the reaction time shown in Fig. 1d. The plotted heat map showed the same trend consistent with that in Fig. 1b, exhibiting a continuous decrease in the junction length. It is notable that even though the solvent environment in the nanogap is almost non-polar (dielectric constant ε = 2.3 for TCB), the Menshutkin reaction completed within hundreds of minutes as monitored from STM-BJ experiment. However, the Menshutkin reaction performed in TCB without EEF was sluggish, and took 400 hours to give a less than 10% conversion as observed from the macroscopic UV-Vis characterizations in Fig. 1e (see Fig. S5† for details), which is in agreement with the previous reports.6 The reaction at the single-molecule scale is significantly faster than that characterized in the ensemble system, which indicates the SN2 alkylation is more reactive under the STM-BJ measurement, in which a strong EEF might generate between the nanogap of gold electrodes to accelerate the reaction.
To quantitatively evaluate the acceleration effect, we analyzed the proportion evolution of OMPP (Fig. 1f, blue curve is obtained from STM-BJ; green curve is obtained from macroscopic experiments) in the STM-BJ and UV-Vis experiments, from which we can obtain the conversion ratio in different times. As shown in the insets of Fig. 1b, due to the distinctive plateau lengths between MPP and OMPP, we used single-molecule counting techniques by binary Gaussian distribution of plateau distribution histograms to determine the ratio of peak areas between OMPP (green peak) and MPP (blue peak) for relative concentration ratios.39,40 A control experiment showed that MPP and OMPP exhibited almost identical probability to be captured, demonstrating the reliability of using the ratios of peak areas for determining the component ratio between MPP and OMPP in STM-BJ experiments, see Fig. S13.† Meanwhile, we fit the height of the absorption peak in the UV-Vis experiment to acquire the proportions of the macroscopic reaction (Fig. S5†). The pseudo-first-order rate constant at 50 mV was determined to be k50 = 2.08 × 10⁻² min−1 in nanogap and kTCB = 2.46 × 10⁻⁶ min−1 in macroscale, respectively, suggesting a significantly high reaction rate promotion ratio of 846 times in the nanogap.
To evaluate the role of EEF in the Menshutkin reaction on the macro scale, we changed the TCB solvent to a strong polar solvent deuterated dimethyl sulfoxide (DMSO, ε = 47.2) and performed the 1H nuclear magnetic resonance (NMR) characterizations (See Fig. S6†). We performed the NMR characterizations instead of the UV-Vis measurements because the concentration of OMPP increased, and its absorption strength was higher than the detection limit and could not be detected during the reaction. As shown in Fig. S6c,† the signals that represent the H atoms of C2 and C6 in the pyridine ring of MPP (blue background, 8.7, 4H) are decreasing, while the peaks of OMPP (green background, 9.7, 4H of C2 and C6 in the pyridinium ring) appear and gradually become dominant. The Menshutkin reaction took more than 600 hours to achieve 95% conversion with a rate constant of kDMSO = 1.45 × 10⁻⁴ min−1 (Fig. 2a, line on the top). Therefore, these results indicate that the Menshutkin reaction is dependent on solvent polarity, which is consistent with the control experiment performed in acetone (ε = 20.7) with a rate constant of 1.97 × 10⁻⁵ min−1 (Fig. 2a, line in the middle and Fig. S6a†) that is faster than that in TCB and slower than that in DMSO. We performed ex situ control experiments by adding a gold wire in DMSO solvent (Fig. S7†) and by exposing the TCB solvent to the white light to rule out the potential electrochemical processes and the catalytic effect from the gold surface without an electric field or impurities generated from TCB (Fig. S8†), indicating the acceleration is not caused by octyl iodide becoming a better electrophile by binding to the fresh gold pyramids. It was found that the Menshtkin reaction could be accelerated by tunning the solvents to higher polarity. In investigating the role of EEF in the catalytic effect, we switched from TCB to propylene carbonate (PC), a highly polar solvent (ε = 69), while keeping other conditions constant in STM-BJ experiments. The reaction rate of the Menshutkin reaction in PC (k50_PC = 3.29 × 10⁻³ min−1) is significantly lower than that in TCB (see Fig. S23†). This decrease can be attributed to the electric field screening effect stemming from the polar solvent, even though the polar PC will enhance the reaction in the bulk environment, which proves that the electrostatic field in the nanogap plays a vital role in the Menshutkin reaction.
 | ||
| Fig. 2 Reaction kinetics in single-molecule junctions with EEF and in NMR tube/UV-Vis quartz cell. (a) The Menshutkin reaction dynamics in the macroscale extracted through NMR spectra in the solvent environments of acetone (green) and DMSO (dark green) and through UV-Vis spectra in TCB (light green, same data from Fig. 1f), respectively. (b) Reaction rates modulation through different applied bias voltages exponentially fitted by the pseudo-first-order reaction from 20 mV to 100 mV, same data of 50 mV from Fig. 1f. (c) Comparisons of the reaction constants in macroscale from NMR (green dots) and in nanogap from single-molecule electrical measurements (blue dots). (d) Summary of different Menshutkin reaction systems accelerated by solvents (green background), confined environment from macrocyclic compounds (orange background), and EEF (blue background). [a]: Ref. 41; [b]: ref. 2; [c]: ref. 42; [d]: ref. 43; [e]: ref. 44; [f] indicated by a black arrow: this work in DMSO relative to TCB; [g]: ref. 6; [h]: ref. 45; [i]: ref. 10; [j]: ref. 13 and 19; [k]: this work by STM-BJ at 100 mV relative to the reaction in macroscale in the TCB solvent. | ||
To further reveal the role of EEF in the reaction within the nanogap in a non-polar environment, we changed the bias between the two electrodes in the single-molecule conductance measurement to 20, 70, 80, and 100 mV, respectively (see Fig. S16 and S17†). The results demonstrated a trend that higher bias led to a higher reaction rate. To evaluate the influence of the bias polarity on the chemical reaction, we also flipped the sign of the applied bias, and the extracted reaction constant remained almost the same, suggesting the polarity of the bias did not have a significant effect on the kinetics of the reaction (see Fig. S18†), since the dipole moment of MPP will induce the reorientation of the molecule inside the nanogap when changing the orientation of EEF. When a single-molecule junction is formed, the relative orientation between the molecular component and the electric field is aligned. The reaction-axis of the SN2 reaction will also be aligned with the orientations of the EEF,5 offering the possibility of a high reaction rate catalyzed by EEF. As shown in Fig. 2b and summarized in Fig. 2c, quantitively, the pseudo-first-order reaction rates derived from exponential fitting are k20 mV = 1.48 × 10⁻² min−1, k50 mV = 2.08 × 10⁻² min−1, k70 mV = 4.95 × 10⁻² min−1, k80 mV = 5.28 × 10⁻² min−1 and k100 mV = 9.60 × 10⁻² min−1, respectively, further confirmed that the electric field will effectively accelerate the Menshutkin reaction. Increasing bias voltages to 300 mV will further increase the reaction rates (k200 mV = 1.77 × 10⁻¹ min−1 and k300 mV = 1.84 × 10⁻¹ min−1). The investigation of bias higher than 300 mV is limited due to the increased instability during the STM-BJ experiment, which is a result of the high bias (Fig. S22†). Taking the reaction rate in TCB on the macro scale as a reference, the acceleration effect of kDMSO/kTCB by the solvent is calculated to be 58.9 (green dots in Fig. 2c). While the reaction in nanogap under EEF has a more significant acceleration effect with an enhancing ratio of k100 mV/kTCB = ∼39000, suggesting that the using EEF can go beyond the limitation of solvent effect to achieve a significant reaction acceleration of the Menshutkin reaction, resulting in more than two orders of magnitudes higher reaction rate than that in the solution (a–i within the green shadow in Fig. 2d, see detailed information in Table S1†) and more than one order of magnitude higher reaction rate than that confined in the molecular cages19 (j within the orange shadow in Fig. 2d).
Product identification of the Menshutkin reaction
To further identify the products of the Menshutkin reaction in the nanogap, we used in situ MCBJ-Raman measurements (Fig. 3a) to obtain spectroscopic characterizations of the Menshutkin reaction between two electrodes. We developed a new method choosing silicon oxide for suspending the gold nanobridges instead of polyimide to avoid the unnecessary Raman signal interference as reported by previous fabrication methods46 (detailed fabrication process is shown in Fig. S27† and combined Raman measurement in Experimental procedures in ESI†). Single-molecule electrical characterization of the reaction in the MCBJ system47 was measured and the conductance-distance histograms of the solution of 1 mM MPP and after adding 100 mM IOA were shown in Fig. S28.† Both histograms are similar to those using the STM-BJ technique, suggesting that the reaction and the product could also be electrically monitored in the MCBJ setup. After that, the MCBJ setup was integrated into a confocal Raman microscope. Firstly, the MPP junction was hovered in the MPP solution around the conductance of 10−3G0 (see Raman experimental details in ESI†). The enhanced Raman peak around 1600 cm−1 (characteristic C![[double bond, length as m-dash]](https://www.rsc.org/images/entities/char_e001.gif) C stretching of the pyridine ring) suggested the capture of MPP (Fig. 3b, top, MPP junction). Afterward, the Menshutkin reaction was monitored by the same method when adding the IOA solution into the MPP solution. The nanogap-enhanced signal was acquired and shown in the grey background in Fig. 3b. Notably, there was a resonance peak around 1630 cm−1 identifying the CC stretching of the pyridinium ring,48,49 suggesting that the product OMPP was detected and that the Menshutkin reaction indeed occurred among the nanogap of gold electrodes. The normal Raman spectra of the powder samples and the surface-enhanced Raman spectra of MPP and OMPP adsorbed on the gold nanoparticles were measured to verify the signals from MCBJ-Raman. As shown in Fig. 3b, lines in the middle (surface enhanced Raman scattering, SERS by gold nanoparticles) and at the bottom (powder) showed good consistency with signals from single-molecule junctions (see Fig. S27b† for the complete Raman spectra of SERS measurements). Moreover, the signal of the acquired OMPP junction in the nanogap has a redshift, i.e., from 1639 cm−1 (powder) to 1633 cm−1 (SERS) and at last to 1621 cm−1 (junction), signifying the electron delocalization weakens the vibrational strength of CC bonds and therefore identifying the bonding of the single-molecule with the two gold electrodes.50 This evidence confirms that the new species of the product OMPP generated in the nanogap is produced from the Menshutkin reaction. We also performed the liquid chromatography-mass spectrometry (LC-MS) coupled characterization to the solution from the STM-BJ liquid cell to further verify the formation of OMPP (details of the LC-MS experiments detecting the reaction solution in the liquid cell after the STM-BJ can be seen in Fig. S9†). As demonstrated by the LC-MS result and Fig. S19,† there was abundant OMPP formed during the STM-BJ experiment, suggesting that not only one molecule captured by the electrodes is catalyzed during the reaction. Instead, all the molecules near the nano-confined space can be oriented and catalyzed by the distribution of the strong electric field, which is also demonstrated by varying the volume of the solution (Fig. S21†). Meanwhile, the induced solvent fields18 may also have a secondary role in catalyzing the reaction for a significant amount of reactant locating near the nano-confined space. Thus, we could observe a gradual ratio change between reactants and products.
C stretching of the pyridine ring) suggested the capture of MPP (Fig. 3b, top, MPP junction). Afterward, the Menshutkin reaction was monitored by the same method when adding the IOA solution into the MPP solution. The nanogap-enhanced signal was acquired and shown in the grey background in Fig. 3b. Notably, there was a resonance peak around 1630 cm−1 identifying the CC stretching of the pyridinium ring,48,49 suggesting that the product OMPP was detected and that the Menshutkin reaction indeed occurred among the nanogap of gold electrodes. The normal Raman spectra of the powder samples and the surface-enhanced Raman spectra of MPP and OMPP adsorbed on the gold nanoparticles were measured to verify the signals from MCBJ-Raman. As shown in Fig. 3b, lines in the middle (surface enhanced Raman scattering, SERS by gold nanoparticles) and at the bottom (powder) showed good consistency with signals from single-molecule junctions (see Fig. S27b† for the complete Raman spectra of SERS measurements). Moreover, the signal of the acquired OMPP junction in the nanogap has a redshift, i.e., from 1639 cm−1 (powder) to 1633 cm−1 (SERS) and at last to 1621 cm−1 (junction), signifying the electron delocalization weakens the vibrational strength of CC bonds and therefore identifying the bonding of the single-molecule with the two gold electrodes.50 This evidence confirms that the new species of the product OMPP generated in the nanogap is produced from the Menshutkin reaction. We also performed the liquid chromatography-mass spectrometry (LC-MS) coupled characterization to the solution from the STM-BJ liquid cell to further verify the formation of OMPP (details of the LC-MS experiments detecting the reaction solution in the liquid cell after the STM-BJ can be seen in Fig. S9†). As demonstrated by the LC-MS result and Fig. S19,† there was abundant OMPP formed during the STM-BJ experiment, suggesting that not only one molecule captured by the electrodes is catalyzed during the reaction. Instead, all the molecules near the nano-confined space can be oriented and catalyzed by the distribution of the strong electric field, which is also demonstrated by varying the volume of the solution (Fig. S21†). Meanwhile, the induced solvent fields18 may also have a secondary role in catalyzing the reaction for a significant amount of reactant locating near the nano-confined space. Thus, we could observe a gradual ratio change between reactants and products.
 | ||
| Fig. 3 Investigation of MCBJ-Raman and flicker noise characteristics. (a) Schematic of the MCBJ-Raman setup. (b) Raman signals of MPP and OMPP powder (bottom), SERS signals of MPP and OMPP (middle); the SERS signal of MPP junction, and the OMPP junction on the MCBJ chip (top). (c and d) The 2D histograms of flicker noise power density versus the average conductance for MPP and OMPP, respectively. | ||
To further characterize the junction geometries and transmission mechanism between reactant MPP and product OMPP, we used flicker noise analysis of the single-molecule junctions of MPP and OMPP.51 As shown in Fig. 3c and S24,† the noise power of MPP is scaled as G1.1, indicating the domination of through-bond coupling, which agrees with the junction geometry with Au–N and Au–S coordinations. In contrast, the noise power of OMPP is scaled as G1.7 (Fig. 3d and S25†), indicating the transformation to through-space Au–π coupling, which is consistent with the geometry of ring coupling to the electrode, signifying the pyridinium electrostatic anchoring. To further confirm the same ability for pyridinium to anchor with gold, we performed a control conductance experiment using 1-methyl-4-[4-(methylthio)phenyl]-pyridinium (MMPP), which also showed a similar plateau pattern to OMPP (Fig. S12†), suggesting that the change of the alkyl group on the nitrogen atom will not have significant changes for the ring coupling of pyridinium to gold electrodes.33 The distinct plateau displacement of OMPP prefers the strong tilting of the pyridinium–gold bond driven by the Au–π coupling, and the steric hindrance brought by the long alkyl chain (or the effect of side chain engineering52) enhances this phenomenon. In comparison, MPP with a sulfur methyl and pyridine anchor group would be fully stretched before the break of the junction.
Theoretical calculations
Based on the reaction-axis rule, the effect of the electric field increases as the direction of the electric field is aligned on the reaction-axis. The reaction reaches the maximum acceleration when the reaction-axis is aligned with the direction of the electric field. Nevertheless, the ideal alignment is not essential, while the non-parallel alignment can also accelerate the reaction. In the STM-BJ experiment, since the pyridyl in MPP acts as the anchoring group and the reaction site with IOA, as shown in Fig. 4a, the relative orientation between the electric field and the reaction-axis of the Menshutkin reaction will be in a parallel way, suggesting the most efficient electric-field-induced acceleration of chemical reaction. Hence, DFT calculations were performed to evaluate the role of EEF in the reaction. As shown in Fig. 4b, inspired by a previous work, when the direction of an oriented EEF is opposite to the dipole moment (see arrows in Fig. 4a, top), the reaction barrier is found quite sensitive to the strength of the EEF and agrees with the previous predication.5 We also noticed that the trend in barrier changes across different electric fields in a non-polar solvent (i.e. toluene) is very similar to the trend in vacuum, suggesting that non-polar solvents provide minimal screening for the external electric field. The energy barrier is significantly decreased with the increase of electric field strength. In the absence of an electric field, the activation energy is about 25 kcal mol−1, which agrees with the slow reaction rate at room temperature. According to the Arrhenius equation, the ratio of reaction rate with the change of reaction barrier (ΔEa) can be expressed as follow, | (1) |
000–58000 times fold increase in the reaction rate, which agrees well with the ratio of ∼39000 obtained from the experimental results (k100 mV/kTCB). If we only consider the fully stretched junction, we may underestimate the field strength in the experiment, considering that the field strength is significantly enhanced when the junction is tilted. Additionally, the sharp tip can also increase the field strength.53 Specifically, the field strength near the sharp tip can be 10 to 30 times higher than that in a uniform distribution, suggesting the feasibility of using a 0.1 V bias to reduce a reaction barrier of approximately 6.0 kcal mol−1 in experiments.
 | ||
| Fig. 4 Theoretical calculations. (a) Scheme of EEF-catalyzed Menshutkin reaction. (b) The computed reaction barriers (in kcal mol−1) for the reaction in vacuum (blue) and in toluene (red) as a function of the applied oriented EEF. The direction of the electric field relative to the reaction coordinate is shown in the inset. (c) The dependence of reaction barriers to different solvent environments. | ||
To evaluate the role of solvents in the reaction rates, the dependence of the reaction barrier in different solvent environments via continuum models of solvation was calculated. Previous studies based on the QM/MM calculations with solvent-involved systems can provide a more accurate evaluation of the EEF effect.16,54,55 Our calculation can also reflect the tendency observed in experiments. As shown in Fig. 4c, we observed that the change from non-polar solvent hexane to polar solvent DMSO could change the reaction barrier by 5 kcal mol−1, which is associated with a change in reaction rate in three orders of magnitudes. In comparison, our previous experimental results showed that the optimization of solvent environment could only obtain less than two orders of magnitude of reaction acceleration ratio (similar experimental results were reported by other studies as summarized by different Menshutkin reaction systems from previous literature and our work, see Fig. 2d, green background). This result may account for the random orientation of the solvent molecules and complex solvent–solvent or solvent–solute interactions. Therefore, introducing the external electric field with precise alignment with the reaction-axis could lead to a more efficient acceleration of the Menshutkin reaction than the change in the solvent environment. The EEF catalysis on the single-molecule scale thus has important significance for the synthesis applications.
Conclusion
To conclude, we demonstrate that the classical SN2 reaction can be catalyzed inside a nanogap within two electrodes via the oriented EEF to achieve a significant reaction acceleration. Compared with a series of solvents with different polarities, the acceleration effect through the external electric field was significantly higher than that through solvent polarity tuning with a magnification of ∼39000 times. The combined MCBJ-Raman characterization provides direct evidence for forming the SN2 product within the nanogap of two electrodes. The theoretical calculation suggested an energy barrier decrease of ∼6.0 kcal mol−1 under an EEF of 1.0 V nm−1, significantly larger than the reduced activation energy from the polar solvents. Our work demonstrates the great potential of using EEF for green synthesis and provides further understanding of the mechanism of electrostatic catalysis.
Experimental methods
Materials synthesis
The structural formulae, details of the synthesis and characterizations for both reactant and product compounds reported in this research can be found in the ESI.† 1-Iodooctane was purchased from Aladdin (>97.0%, GC) and used as received without further purification.NMR spectroscopies
1H NMR spectra were recorded with a Bruker ADVANCE NEO 500 (500 MHz). 1 mM MPP and 100 mM IOA solution were prepared with respective deuterated solvents for acquiring kinetic parameters under the ambient condition.Conductance measurement
Single-molecule conductance and plateau length were measured using a home-built STM-BJ setup.56,57 Gold wire (99.99%, Ø = 0.25 mm) was purchased from Beijing Jiaming Platinum Nonferrous Metal Co, Ltd to fabricate the STM tip. The gold tip is cleaned by butane flame to form a gold bead. The metallic substrates were prepared by evaporating ∼100 nm Au (99.999% purity) at ∼1 Å s−1 onto silicon substrates. We recorded conductance by breaking and forming single-molecule junctions between the gold tip and substrate in the STM-BJ equipment. To prevent leakage of solvent and contamination by other impurities, we sealed the solution of the reaction system in a polytef liquid cell containing a plastic O-ring (perfluoroelastomer 5.0 × 1.0, ZOE Sealing Technology Development Co. Ltd.). Before the experiments, piranha solution (3:1 v/v H2SO4/H2O2) followed by 18.2 MΩ cm−1 Milli-Q water (Millipore) was used to clean the ploytef liquid cells and gold substrates.
Single-molecule conductance was measured after the break of the gold-point contact, and a molecule bridged the gap between two electrodes. We recorded the conductance as a function of the two electrodes under a fixed bias voltage (20, 50, 70, 80, and 100 mV, respectively), yielding conductance-distance traces to reveal molecular-dependent conductance plateaus further. A blank experiment of 15 μL TCB was first performed in the liquid cell to correct the piezo rete for plateau length analysis and ensure there was no pollution in the reaction system at the same time. Afterward, 30 μL 1 mM MPP solution and 30 μL 100 mM IOA solution were added in sequence. Specific molecular junction conductance is obtained by compiling traces into 1D conductance histograms, and molecular backbone length is obtained via 2D conductance-distance histograms.
Time-plateau length distribution
We set a certain time interval (20 minutes, for example) to obtain plateau histograms with 20 bins in a 0.6 nm length of a certain number of curves. All histograms of a certain time interval were stacked to form a data frame and then a plateau-time heat-map for the entire reaction process.Raman characterization
The Raman spectra of MPP and OMPP powders were collected under a 532 nm laser with a power of 3.77 mW. Gold nanoparticles with a diameter of around 80 nm were used as the SERS substrate. The SERS spectra were collected under a 632.8 nm laser with a power of 0.1 mW. The spectra of the molecular junction were collected under a 785 nm laser with a power of 3.53 mW. Electron-multiplying CCD (EMCCD) was turned on to acquire stronger Raman signals.Statistical analysis
The data analysis of conductance measurements is analyzed via our open-source code XME analysis, and it is available on GitHub (https://github.com/Pilab-XMU/XMe_DataAnalysis). The computation details can be made available from the corresponding authors upon request. Instructions on how to run the data have been listed in the https://github.com/Pilab-XMU/XMe_DataAnalysis/tree/shangchi/guide. Demo data (MPP, OMPP, and a plateau histogram at the 80 min of the reaction) is available at: https://github.com/Pilab-XMU/XMe_DataAnalysis/tree/shangchi/paper-Menshutkin. Following the instructions in the README file one can obtain 1D, 2D, and plateau histograms from the raw data.Data availability
The data supporting this article have been included as part of the ESI.† Any additional information required to reanalyze the data reported in this paper is available from the contact upon request. All unique/stable reagents generated in this study are available from the lead contact with a completed materials transfer agreement.Author contributions
J. L. and C. T. originally conceived the concept and designed the experiments. T. L., M. S., J. W., Y.-L. Z., and W. X. carried out the single-molecule measurements and macroscope characterization. C. T. and T. L. developed the data analysis method. Synthetic work was carried out by J. W.; J. Z. and W. L. fabricated MCBJ chips and carried out conductance and combined Raman detection. Calculations were carried out by C. T. and Y. Z. All experimental and theoretical studies are carried out in W. H.'s Lab. W. H., J. L., C. T., T. L., M. S., J. Z., J. S., R. H., Y. Y., L. C., Y. Z. and J. B. prepared the manuscript using feedback from other authors.Conflicts of interest
There is no conflict of interest to report.Acknowledgements
We are grateful for financial support from the National Natural Science Foundation of China (No. 21933012, 22173075, 22325303, 22250003), the Fujian Provincial Department of Science and Technology (2023H6002), the Fundamental Research Funds for the Central Universities (No. 20720220020, 20720200068).Notes and references
- W. W. Cleland and A. C. Hengge, Chem. Rev., 2006, 106, 3252–3278 CrossRef CAS PubMed.
- N. Menschutkin, Z. Phys. Chem., 1890, 6, 41–57 CrossRef.
- M. Sola, A. Lledos, M. Duran, J. Bertran and J. L. M. Abboud, J. Am. Chem. Soc., 1991, 113, 2873–2879 CrossRef CAS.
- J. Gao, J. Am. Chem. Soc., 1991, 113, 7796–7797 CrossRef CAS.
- R. Ramanan, D. Danovich, D. Mandal and S. Shaik, J. Am. Chem. Soc., 2018, 140, 4354–4362 CrossRef CAS PubMed.
- T.-T. Wang and Q.-L. Iou, Chem. Eng. J., 2002, 87, 197–206 CrossRef CAS.
- C. Gu, C. Hu, Y. Wei, D. Lin, C. Jia, M. Li, D. Su, J. Guan, A. Xia, L. Xie, A. Nitzan, H. Guo and X. Guo, Nano Lett., 2018, 18, 4156–4162 CrossRef CAS PubMed.
- B. Xu and N. J. Tao, Science, 2003, 301, 1221–1223 CrossRef CAS PubMed.
- C. Yang, Z. Liu, Y. Li, S. Zhou, C. Lu, Y. Guo, M. Ramirez, Q. Zhang, Y. Li, Z. Liu, K. N. Houk, D. Zhang and X. Guo, Sci. Adv., 2021, 7, eabf0689 CrossRef CAS PubMed.
- H. Struebing, Z. Ganase, P. G. Karamertzanis, E. Siougkrou, P. Haycock, P. M. Piccione, A. Armstrong, A. Galindo and C. S. Adjiman, Nat. Chem., 2013, 5, 952–957 CrossRef CAS PubMed.
- S. Shaik, D. Danovich, K. D. Dubey and T. Stuyver, in Effects of Electric Fields on Structure and Reactivity: New Horizons in Chemistry, The Royal Society of Chemistry, 2021, pp. 12–70, 10.1039/9781839163043-00012.
- H. Chen, C. Jia, X. Zhu, C. Yang, X. Guo and J. F. Stoddart, Nat. Rev. Mater., 2023, 8, 165–185 CrossRef.
- C. Yang, Y. Li, S. Zhou, Y. Guo, C. Jia, Z. Liu, K. N. Houk, Y. Dubi and X. Guo, Nat. Chem., 2023, 15, 972–979 CrossRef CAS PubMed.
- S. Shaik, D. Danovich, J. Joy, Z. Wang and T. Stuyver, J. Am. Chem. Soc., 2020, 142, 12551–12562 CrossRef CAS PubMed.
- S. Ciampi, N. Darwish, H. M. Aitken, I. Diez-Perez and M. L. Coote, Chem. Soc. Rev., 2018, 47, 5146–5164 RSC.
- S. Shaik, R. Ramanan, D. Danovich and D. Mandal, Chem. Soc. Rev., 2018, 47, 5125–5145 RSC.
- X. Huang, C. Tang, J. Li, L.-C. Chen, J. Zheng, P. Zhang, J. Le, R. Li, X. Li, J. Liu, Y. Yang, J. Shi, Z. Chen, M. Bai, H.-L. Zhang, H. Xia, J. Cheng, Z.-Q. Tian and W. Hong, Sci. Adv., 2019, 5, aaw3072 CrossRef PubMed.
- K. Dutta Dubey, T. Stuyver, S. Kalita and S. Shaik, J. Am. Chem. Soc., 2020, 142, 9955–9965 CrossRef CAS PubMed.
- B. W. Purse, A. Gissot and J. Rebek, J. Am. Chem. Soc., 2005, 127, 11222–11223 CrossRef CAS PubMed.
- M. D. Halls and H. B. Schlegel, J. Phys. Chem. B, 2002, 106, 1921–1925 CrossRef CAS.
- M. D. Halls and K. Raghavachari, Nano Lett., 2005, 5, 1861–1866 CrossRef CAS PubMed.
- C. Yang, L. Zhang, C. Lu, S. Zhou, X. Li, Y. Li, Y. Yang, Y. Li, Z. Liu, J. Yang, K. N. Houk, F. Mo and X. Guo, Nat. Nanotechnol., 2021, 16, 1214–1223 CrossRef CAS PubMed.
- C. Yang, L. Zhang, H. Li, Y. Guo, C. Jia, W. Zhu, F. Mo and X. Guo, Matter, 2021, 4, 2874–2885 CrossRef CAS.
- A. C. Aragones, N. L. Haworth, N. Darwish, S. Ciampi, N. J. Bloomfield, G. G. Wallace, I. Diez-Perez and M. L. Coote, Nature, 2016, 531, 88–91 CrossRef CAS PubMed.
- L. Meng, N. Xin, C. Hu, J. Wang, B. Gui, J. Shi, C. Wang, C. Shen, G. Zhang, H. Guo, S. Meng and X. Guo, Nat. Commun., 2019, 10, 1450 CrossRef PubMed.
- Y. Zang, Q. Zou, T. Fu, F. Ng, B. Fowler, J. Yang, H. Li, M. L. Steigerwald, C. Nuckolls and L. Venkataraman, Nat. Commun., 2019, 10, 4482 CrossRef PubMed.
- C. Zheng, Y. Mao, J. Kozuch, A. O. Atsango, Z. Ji, T. E. Markland and S. G. Boxer, Nat. Chem., 2022, 14, 891–897 CrossRef CAS PubMed.
- L. Zhang, E. Laborda, N. Darwish, B. B. Noble, J. H. Tyrell, S. Pluczyk, A. P. Le Brun, G. G. Wallace, J. Gonzalez, M. L. Coote and S. Ciampi, J. Am. Chem. Soc., 2018, 140, 766–774 CrossRef CAS PubMed.
- L. Domulevicz, H. Jeong, N. K. Paul, J. S. Gomez-Diaz and J. Hihath, Angew. Chem., Int. Ed., 2021, 60, 16436–16441 CrossRef CAS PubMed.
- S. Kaneko, D. Murai, S. Marqués-González, H. Nakamura, Y. Komoto, S. Fujii, T. Nishino, K. Ikeda, K. Tsukagoshi and M. Kiguchi, J. Am. Chem. Soc., 2016, 138, 1294–1300 CrossRef CAS PubMed.
- J. Zheng, J. Liu, Y. Zhuo, R. Li, X. Jin, Y. Yang, Z.-B. Chen, J. Shi, Z. Xiao, W. Hong and Z.-Q. Tian, Chem. Sci., 2018, 9, 5033–5038 RSC.
- X.-S. Zhou, Z.-B. Chen, S.-H. Liu, S. Jin, L. Liu, H.-M. Zhang, Z.-X. Xie, Y.-B. Jiang and B.-W. Mao, J. Phys. Chem. C, 2008, 112, 3935–3940 CrossRef CAS.
- H. Chen, V. Brasiliense, J. Mo, L. Zhang, Y. Jiao, Z. Chen, L. O. Jones, G. He, Q.-H. Guo, X.-Y. Chen, B. Song, G. C. Schatz and J. F. Stoddart, J. Am. Chem. Soc., 2021, 143, 2886–2895 CrossRef CAS PubMed.
- H. Yu, J. Li, S. Li, Y. Liu, N. E. Jackson, J. S. Moore and C. M. Schroeder, J. Am. Chem. Soc., 2022, 144, 3162–3173 CrossRef CAS PubMed.
- Y. Hasegawa, T. Harashima, Y. Jono, T. Seki, M. Kiguchi and T. Nishino, Chem. Commun., 2019, 56, 309–312 RSC.
- S. Afsari, Z. Li and E. Borguet, Angew. Chem., Int. Ed., 2014, 53, 9771–9774 CrossRef CAS PubMed.
- M. T. González, S. Wu, R. Huber, S. J. Van Der Molen, C. Schönenberger and M. Calame, Nano Lett., 2006, 6, 2238–2242 CrossRef PubMed.
- S. Y. Quek, M. Kamenetska, M. L. Steigerwald, H. J. Choi, S. G. Louie, M. S. Hybertsen, J. B. Neaton and L. Venkataraman, Nat. Nanotechnol., 2009, 4, 230–234 CrossRef CAS PubMed.
- C. Huang, M. Jevric, A. Borges, S. T. Olsen, J. M. Hamill, J. T. Zheng, Y. Yang, A. Rudnev, M. Baghernejad, P. Broekmann, A. U. Petersen, T. Wandlowski, K. V. Mikkelsen, G. C. Solomon, M. Brondsted Nielsen and W. Hong, Nat. Commun., 2017, 8, 15436 CrossRef CAS PubMed.
- J. Zheng, W. Gao, T. Lu, L. Chen, L. Lin, R. Huang, Y. Tang, G. Dong, J. Liu, Y. Pan, W. Weng and W. Hong, CCS Chem., 2023, 5, 1888–1895 CrossRef CAS.
- A. O. Komarova, G. R. Dick and J. S. Luterbacher, Green Chem., 2021, 23, 4790–4799 RSC.
- J. D. Reinheimer, J. D. Harley and W. W. Meyers, J. Org. Chem., 1963, 28, 1575–1579 CrossRef CAS.
- J. F. Norris and S. W. Prentiss, J. Am. Chem. Soc., 1928, 50, 3042–3048 CrossRef CAS.
- H. G. Grimm, H. Ruf and H. Wolff, Z. Phys. Chem., 1931, 13B, 301–315 CrossRef.
- M. H. Abraham and P. L. Grellier, J. Chem. Soc., Perkin Trans. 2, 1976, 1735–1741 RSC.
- S. Caneva, P. Gehring, V. M. García-Suárez, A. García-Fuente, D. Stefani, I. J. Olavarria-Contreras, J. Ferrer, C. Dekker and H. S. J. Van Der Zant, Nat. Nanotechnol., 2018, 13, 1126–1131 CrossRef CAS PubMed.
- S. A. G. Vrouwe, E. Van Der Giessen, S. J. Van Der Molen, D. Dulic, M. L. Trouwborst and B. J. Van Wees, Phys. Rev. B: Condens. Matter Mater. Phys., 2005, 71, 035313 CrossRef.
- N. Wattanavichean, M. Gilby, R. J. Nichols and H. Arnolds, Anal. Chem., 2019, 91, 2644–2651 CrossRef CAS PubMed.
- Z. Yu, J. Q. Li, Y. H. Wang, J. Q. Su, J. Y. Fu, J. W. Zou, J. F. Zheng, Y. Shao and X. S. Zhou, Anal. Chem., 2022, 94, 1823–1830 CrossRef CAS PubMed.
- S. Suzuki, S. Kaneko, S. Fujii, S. Marqués-González, T. Nishino and M. Kiguchi, J. Phys. Chem. C, 2016, 120, 1038–1042 CrossRef CAS.
- O. Adak, E. Rosenthal, J. Meisner, E. F. Andrade, A. N. Pasupathy, C. Nuckolls, M. S. Hybertsen and L. Venkataraman, Nano Lett., 2015, 15, 4143–4149 CrossRef CAS PubMed.
- S. Li, E. R. Jira, N. H. Angello, J. Li, H. Yu, J. S. Moore, Y. Diao, M. D. Burke and C. M. Schroeder, Nat. Commun., 2022, 13, 2102 CrossRef CAS PubMed.
- T. Ryu, Y. Lansac and Y. H. Jang, Nano Lett., 2017, 17, 4061–4066 CrossRef CAS PubMed.
- L. Xu, E. I. Izgorodina and M. L. Coote, J. Am. Chem. Soc., 2020, 142, 12826–12833 CrossRef CAS PubMed.
- M. Belotti, X. Lyu, L. Xu, P. Halat, N. Darwish, D. S. Silvester, C. Goh, E. I. Izgorodina, M. L. Coote and S. Ciampi, J. Am. Chem. Soc., 2021, 143, 17431–17440 CrossRef CAS PubMed.
- C. Tang, L. Chen, L. Zhang, Z. Chen, G. Li, Z. Yan, L. Lin, J. Liu, L. Huang, Y. Ye, Y. Hua, J. Shi, H. Xia and W. Hong, Angew. Chem., Int. Ed., 2019, 58, 10601–10605 CrossRef CAS PubMed.
- J. Bai, A. Daaoub, S. Sangtarash, X. Li, Y. Tang, Q. Zou, H. Sadeghi, S. Liu, X. Huang, Z. Tan, J. Liu, Y. Yang, J. Shi, G. Mészáros, W. Chen, C. Lambert and W. Hong, Nat. Mater., 2019, 18, 364–369 CrossRef CAS PubMed.
Footnotes |
| † Electronic supplementary information (ESI) available. See DOI: https://doi.org/10.1039/d4sc03759f |
| ‡ C. Tang, M. Su, T. Lu and J. Zheng contributed equally to this work. |
| This journal is © The Royal Society of Chemistry 2024 |