
 Open Access Article
 This Open Access Article is licensed under a Creative Commons Attribution-Non Commercial 3.0 Unported Licence
Charge-regulated fluorescent anchors enable high-fidelity tracking of plasma membrane dynamics during biological events†
Jiaqi
Zuo‡
a,
Aohui
Peng‡
b,
Penglei
Wu
a,
Junyi
Chen
b,
Chuangye
Yao
a,
Junjun
Pan
a,
Engao
Zhu
b,
Yingye
Weng
b,
Kewei
Zhang
b,
Hui
Feng
 a,
Zhigang
Jin
*b and
Zhaosheng
Qian
*a
a,
Zhigang
Jin
*b and
Zhaosheng
Qian
*a
aKey Laboratory of the Ministry of Education for Advanced Catalysis Materials, College of Chemistry and Material Sciences, Zhejiang Normal University, Yingbin Road 688, Jinhua 321004, China. E-mail: qianzhaosheng@zjnu.cn
bCollege of Life Science, Zhejiang Normal University, YIngbin Road 688, JInhua 321004, China. E-mail: zgkin@zjnu.edu.cn
First published on 7th May 2024
Abstract
Many biological processes generally require long-term visualization tools for time-scale dynamic changes of the plasma membrane, but there is still a lack of design rules for such imaging tools based on small-molecule fluorescent probes. Herein, we revealed the key regulatory roles of charge number and species of fluorescent dyes in the anchoring ability of the plasma membrane and found that the introduction of multi-charged units and appropriate charge species is often required for fluorescent dyes with strong plasma membrane anchoring ability by systematically investigating the structure–function relationship of cyanostyrylpyridium (CSP) dyes with different charge numbers and species and their imaging performance for the plasma membrane. The CSP-DBO dye constructed exhibits strong plasma membrane anchoring ability in staining the plasma membrane of cells, in addition to many other advantages such as excellent biocompatibility and general universality of cell types. Such a fluorescent anchor has been successfully used to monitor chemically induced plasma membrane damage and dynamically track various cellular biological events such as cell fusion and cytokinesis over a long period of time by continuously monitoring the dynamic morphological changes of the plasma membrane, providing a valuable precise visualization tool to study the physiological response to chemical stimuli and reveal the structural morphological changes and functions of the plasma membrane during these important biological events from a dynamic perspective. Furthermore, CSP-DBO exhibits excellent biocompatibility and imaging capability in vivo such as labelling the plasma membrane in vivo and monitoring the metabolic process of lipofuscin as an aging indicator.
Introduction
The plasma membrane, as the defender of the most basic unit of life activities, performs important functions such as maintaining cell viability, ensuring cell integrity, regulating the transport of substances across the membrane and participating in signal transduction.1 Many important biological events, such as cell plasma membrane damage and repair, cell fusion, cytokinesis and proliferation, etc., are usually accompanied by significant changes in the morphology and dynamics of the plasma membrane.2 Therefore, high-fidelity monitoring of dynamic changes in the plasma membrane will provide intuitive and conclusive information for precise observation and in-depth understanding of various biological events. Fluorescence imaging, with its high sensitivity and resolution, allows researchers to follow dynamic changes in cellular processes in real time.3 Among the various fluorescent labelling tools for plasma membranes,4 including fluorescent proteins, fluorescently labelled biomolecules and small-molecule fluorescent dyes, small-molecule fluorescent dyes have become flexible and efficient imaging tools that can achieve real-time imaging and dynamic monitoring functions due to their versatility and adaptability, low toxicity and biocompatibility, high selectivity and affinity.5Traditional plasma membrane fluorescent dyes are mainly based on the working principle of twisted intramolecular charge transfer, such as the FM family of dyes commonly used for plant plasma membrane imaging6 and the first generation of animal plasma membrane imaging dyes represented by the DiO series.7 With the expansion of the variety of fluorophores available, a variety of dye molecules have been developed that can be used for plasma membrane imaging,8 such as traditional planar dyes9 and the recently emerging aggregation-induced emission luminogens (AIEgens).10 Compared to former plasma membrane dyes, those based on AIEgens have the advantages of fast staining, being wash-free, larger stroke displacements, better specificity and biocompatibility, and have therefore been rapidly developed recently.11–15 However, their anchoring time on the plasma membrane is usually very short (generally less than half an hour),16 and a variety of important biological events often require a long period of time, which makes them unable to follow the dynamics of the plasma membrane in real time during important biological events. Current research advances have shown that highly specific fluorescent dyes for the plasma membrane usually require the introduction of lipophilic long alkyl chains as a targeting unit, and this targeting function is achieved by the weak interaction between the dye molecule and the bilipid layer of the plasma membrane.17–19 However, this weak interaction often fails to anchor the dye molecules to the plasma membrane for a long time.20,21 To overcome this problem, we proposed a general module-based design strategy for plasma membrane fluorescent dyes which can be considered to consist of a central dye backbone module, a targeting module, as well as an impermeable module and a soluble module.15 Recently, we demonstrated the key role of the saturated alkyl chain in tuning cell permeability and regulating anchoring ability of dyes to the plasma membrane in addition to being the targeting module,22 and proved the effectiveness of the antipermeability module in extending imaging time by introducing 1,4-diazabicyclo[2.2.2]octane.23 Since the impermeable module mainly consists of charged moieties, we deduced that the charge number and charged moieties in the impermeable module could dominantly contribute to the anchoring ability of the dyes to the plasma membrane. Given that the impermeable module is predominantly composed of charged moieties and that strong interactions between the positive charges of the dye molecules and the negative charges of the phospholipid molecules in the plasma membrane can enhance the anchoring ability of the dye molecules to the plasma membrane,24,25 it can be postulated that the charge number and charged moieties in the impermeable module could dominantly contribute to the anchoring ability of the dyes to the plasma membrane. Among the few currently reported fluorescent dyes with relatively long imaging times in the plasma membrane, some dye molecules use only positively charged moieties such as pyridinium and quaternary ammonium moieties,23,26,27 whereas others introduce negatively charged sulfonate moieties in addition to positively charged pyridinium.28 Therefore, it is necessary to clarify the role of the charge number of charged moieties in improving anchoring capabilities of fluorescent dyes that can anchor to the plasma membrane for a long period of time and be used for dynamic monitoring of relevant biological events.
Based on current research progress, we believe that the differences in the number and type of charges carried by the dye molecules may result in differences in the strength of their interaction with the negatively charged phosphate moieties on the phospholipid molecules, which largely determines the anchoring ability of the dye molecules to the plasma membrane. To clarify this issue, we performed this work to demonstrate the important contribution of the charge number and charged molecules to the anchoring ability of dyes. We designed and synthesised four fluorescent dye molecules with different numbers and types of charges and systematically evaluated their imaging performance on plant and animal plasma membranes, including staining specificity, uniformity and imaging duration. As shown in Scheme 1, by using cyano-substituted styrylpyridinium as the molecular backbone, introducing two alkyl chains with six carbon atoms at one end of the molecule as targeting groups for the plasma membrane, and introducing different moieties as the anchoring group including neutral methyl and alkyl triphenylphosphonium, alkyl triethylammonium and alkyl 1,4-diazabicyclo[2.2.2]octan-1-ium with a positive charge at the other end of the molecule, a series of CSP dyes with different charge numbers and charge types were designed and prepared. These CSP dye molecules have similar emission wavelengths and similar target-activated fluorescence properties, but they exhibit different plasma membrane anchoring abilities when imaging the plasma membrane of plant and animal cells. Among them, the positively charged CSP dye can quickly pass through the plasma membrane of both plant and animal cells during staining due to its weak anchoring ability, while the CSP-TPP dye molecule containing alkyltriphenylphosphonium units can be anchored to the plasma membrane of plant cells for a short period of time, but it has strong background fluorescence and can quickly penetrate the plasma membrane of animal cells to enter the interior of the cells. The dye molecules CSP-TEA and CSP-DBO, which contain alkyl triethyl ammonium and an alkyl 1,4-diazabicyclo[2.2.2]octan-1-ium moiety, have a relatively strong plasma membrane anchoring ability, allowing high quality staining of the plasma membranes of both plant and animal cells within a short time without internalisation of the dye. However, CSP-DBO showed better performance compared to CSP-TEA for prolonged labelling of plasma membranes. These results demonstrate that the number and type of charges in the dye molecules can effectively regulate the anchoring ability of the dye molecules to the plasma membrane and thus the cell permeability of the dye molecules and the imaging duration of the plasma membrane. In addition to the critical imaging duration, CSP-DBO also exhibits excellent performance in terms of staining speed, staining pattern (wash-free), staining brightness, staining specificity and photostability, which are generally used to evaluate imaging performance of plasma membrane dyes. We used CSP-DBO with strong plasma membrane anchoring ability to follow the dynamic process of chemically induced plasma membrane damage, providing a feasible tool to study the physiological response of plant cells to chemical stimuli. Based on the long-term imaging performance of CSP-DBO on the plasma membrane, we demonstrated the ability of CSP-DBO dye to visualise and track important biological events using the dynamic fusion process of chicken red blood cells and the dynamic cytokinesis process of HEK293T cells as examples. Finally, we evaluated the biotoxicity of CSP-DBO to living organisms and demonstrated its two different labelling modes in vivo for the plasma membrane and lipofuscin.
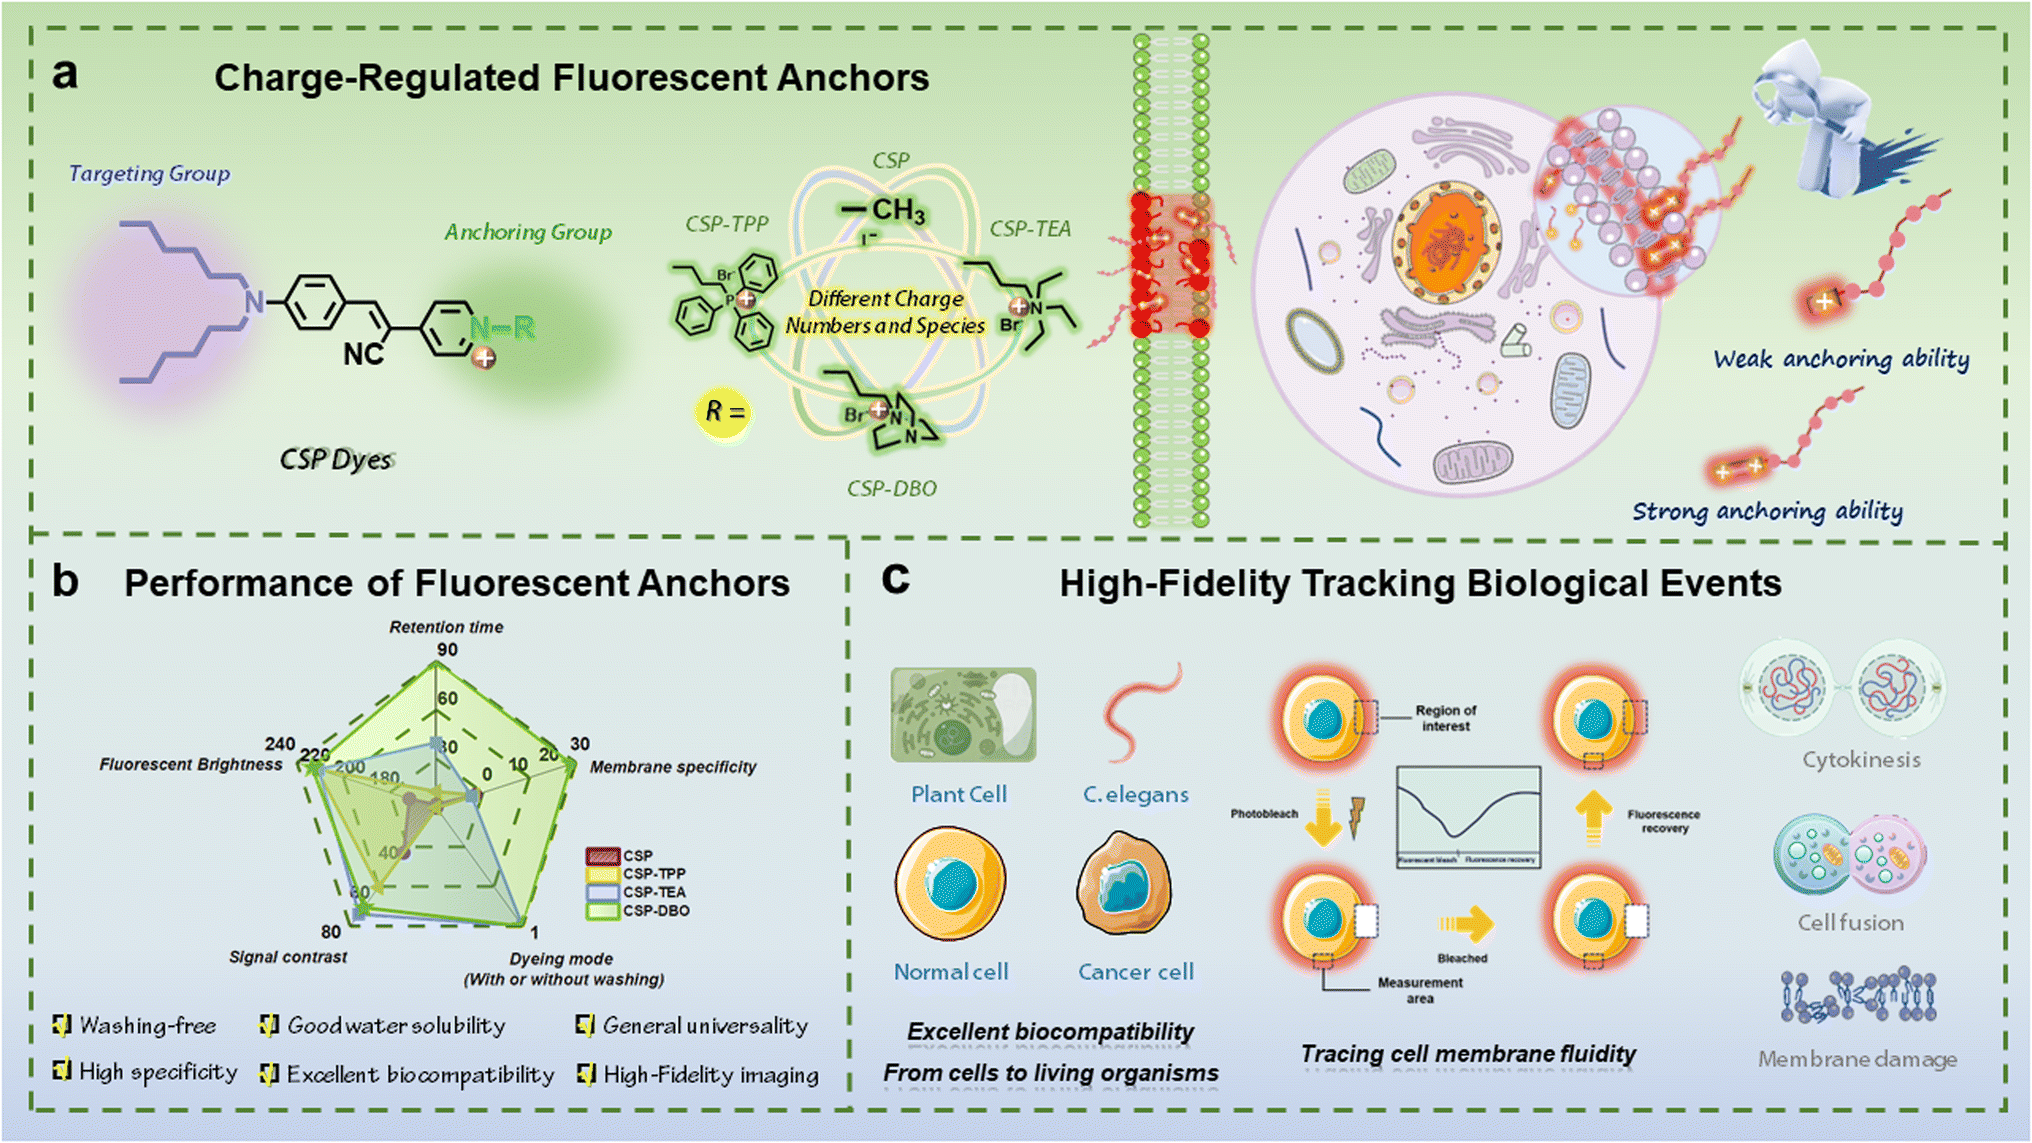 | ||
| Scheme 1 (a) Schematic illustration of the design rules for plasma membrane fluorescent anchors regulated with the charge number and type which determine the anchoring ability of the designed dyes. (b) Overall performance of charge-regulated fluorescent anchors for the plasma membrane. (c) Demonstrations of wide applications of fluorescent anchors including specific labelling of the plasma membranes of both animal and plant cells, real-time tracing of cell membrane fluidity, and high-fidelity tracking of important biological events such as cytokinesis, cell fusion and membrane damage. | ||
Results and discussion
Molecule design, synthesis and photophysical properties of charge-regulated CSP dyes
We chose aminostyrylpyridinium as the fluorescent backbone of the CSP dye molecules because the D–π–A structure of such molecules gives them typical twisted intramolecular charge transfer (TICT) properties.29 These TICT molecules are virtually non-fluorescent in aqueous solution, but can emit bright fluorescence when embedded in a low-polarity plasma membrane.30 The unique target-activated fluorescence properties of these CSP dyes allow them to achieve high-contrast fluorescent staining without washing. The length of the alkyl chain in the dyes was selected based on the findings of our recent paper on side-chain-regulated cell permeability.22 Medium-length alkyl chains with a 6 carbon number were selected in this study to ensure the targeting function of the alkyl chains and the good aqueous solubility of the entire dye molecule simultaneously. To investigate the effect of the number of charges on the anchoring ability, we designed a CSP dye molecule with one positive charge and compared its imaging performance with that of other CSP dyes with two positive charges. To investigate the role of the type of charged moiety on the modulation of its anchoring ability, we introduced a triethylalkyl quaternary ammonium moiety, a triphenylalkyl phosphonium moiety and an alkyl 1,4-diazabicyclo[2.2.2]octan-1-ium moiety with a positive charge into CSP dye molecules and compared the imaging performance of these dyes on the plasma membrane for further comparison. Evaluating the imaging performance of these dye molecules on the plasma membrane can reveal the structure–function relationship between the number and type of charges in the dye molecules and their anchoring ability, which provides effective design rules for designing plasma membrane dye molecules with longer imaging times. As shown in Scheme 1, we used cheap and readily available aniline as the starting material and obtained di-hexylaminobenzene after reaction with bromohexane, and then p-dihexylaminobenzaldehyde was obtained by the Vilsmeier–Haack–Arnold reaction. The key intermediate (Z)-3-(4-(dihexylamino)phenyl)-2-(pyridin-4-yl)acrylonitrile was obtained by the condensation reaction of p-dihexylaminobenzaldehyde with phenylacetonitrile. Finally, we used an efficient SN2 substitution reaction to introduce methyl, triethylamine, triphenylphosphine and 1,4-diazabicyclo[2.2.2]octane for the preparation of CSP, CSP-TEA, CSP-TPP and CSP-DBO respectively. All compounds were rigorously purified by column chromatography and were fully characterized by 1H NMR, 13C NMR and high-resolution mass spectrometry.These CSP dyes are well soluble in common polar organic solvents and their solutions appear red under white light. Fig. 1A shows the UV-vis absorption spectra of these CSP dyes in ethanol. The maximum absorption wavelengths of CSP-TEA, CSP-TPP and CSP-DBO are all 535 nm, but their molar absorptions are slightly different. The absorption peak of CSP has a blue shift of about 15 nm relative to the other three dye molecules, indicating that the introduction of the second charged group has some effect on the absorption of the molecules. The aqueous solutions of these dye molecules can show weak red fluorescence under UV excitation, as shown in Fig. 1B, and their fluorescence emission peaks are located at 585 nm, 601 nm, 601 nm and 598 nm, respectively, suggesting that the difference in the nature of the second charged group has an almost negligible effect on their fluorescence emission. We first evaluated the fluorescence response of these dyes to DOPC which is a commonly used plasma membrane mimic. These CSP dyes are almost non-fluorescent in aqueous solution, but they can emit bright red fluorescence when a certain amount of DOPC is added. Fig. 1C shows that their fluorescence is enhanced 50–70-fold upon addition of DOPC, depending on the dye molecule, illustrating their target-activated fluorescence-enhancing properties, which can be used for high-contrast fluorescence staining of plasma membranes. The lipid–water partition coefficient of a molecule is generally considered to be the most commonly used parameter to quantify the lipophilicity of a molecule, which tends to reflect the membrane permeability of the molecule.31 In contrast, improving the aqueous solubility of a molecule tends to decrease the membrane permeability of the molecule. Therefore, a relatively low lipid–water partition coefficient and a relatively high aqueous solubility would be advantageous to increase the anchoring ability of the dye molecules to the plasma membrane, thus effectively prolonging their retention time on the plasma membrane. To this end, we determined the lipid–water partition coefficients of the four dyes and demonstrated the differences in their solubility in aqueous solution. As shown in Fig. 1D, CSP and CSP-TPP were mainly partitioned in the octanol layer in the mixed system of octanol and water, and their lipid–water partition coefficients were 1![[thin space (1/6-em)]](https://www.rsc.org/images/entities/char_2009.gif) :001 and 1:0.15, respectively. Such large lipid–water partition coefficients imply that they can be easily distributed and rapidly cross the plasma membrane. Compared with CSP and CSP-TPP, CSP-TEA and CSP-DBO have relatively low lipid–water partition coefficients, which ensures their relatively good water solubility and prolongs their retention time in the plasma membrane by enhancing their anchoring ability. To further evaluate the lipophilic interaction of these two-charged dyes with the plasma membrane, we determined the distribution ratio of these dyes in DOPC solution and water. The results in Fig. S1† show that the distribution ratio of CSP-DBO in the organic phase containing DOPC was higher than that of CSP-TPP and CSP-TEA, suggesting that CSP-DBO might have a stronger interaction with the plasma membrane.
:001 and 1:0.15, respectively. Such large lipid–water partition coefficients imply that they can be easily distributed and rapidly cross the plasma membrane. Compared with CSP and CSP-TPP, CSP-TEA and CSP-DBO have relatively low lipid–water partition coefficients, which ensures their relatively good water solubility and prolongs their retention time in the plasma membrane by enhancing their anchoring ability. To further evaluate the lipophilic interaction of these two-charged dyes with the plasma membrane, we determined the distribution ratio of these dyes in DOPC solution and water. The results in Fig. S1† show that the distribution ratio of CSP-DBO in the organic phase containing DOPC was higher than that of CSP-TPP and CSP-TEA, suggesting that CSP-DBO might have a stronger interaction with the plasma membrane.
 | ||
| Fig. 1 (A) UV-visible spectra of CSP dyes (10.0 μM) in ethanol. (B) Normalized PL emission spectra of CSP dyes (10.0 μM) in H2O. (C) PL spectra of CSP dyes (10.0 μM) in H2O and in DOPC solution (5 mg mL−1). (D) Quantitative illustration of the partition ratios of CSP dyes (80.0 μM) between H2O and 1-octanol. | ||
Optimization of CSP dyes with strong anchoring ability and dynamic monitoring of plasma membrane damage in plant cells
The presence of plant cell walls can significantly reduce the fluidity of plant cell plasma membranes compared to more dynamic animal cell plasma membranes, making it easier to distinguish small differences in the imaging performance of CSP dyes on cellular plasma membranes. Therefore, we used onion epidermal cells and root tip cells of Arabidopsis seedlings as research platforms to evaluate the structure–function relationship between the charge difference of CSP dyes and plasma membrane imaging performance. We first optimised the optimal staining concentration of each CSP dye using Arabidopsis seedling root tip cells as a platform to achieve their respective high-quality imaging performances. We found that even at relatively low concentrations, CSP rapidly crosses the plasma membrane and enters the cell interior within a short period of time, resulting in significant dye internalisation (Fig. 2A and S2†), suggesting that dye molecules with only one positively charged moiety have a weak membrane anchoring ability and are not conducive to long-term plasma membrane imaging. CSP-TPP, CSP-TEA and CSP-DBO with two positively charged units uniformly and brightly labelled the plasma membranes under their optimal staining conditions for a short period of time without significant dye internalisation, indicating their relatively strong plasma membrane anchoring ability compared to CSP with only one positively charged moiety. The average signal-to-noise ratios of CSP-TPP, CSP-TEA and CSP-DBO were determined to be 228.5, 227.6 and 231.2, respectively (Fig. 2B), and their close mean values indicate that the difference in the positive charge species of these dye molecules did not significantly affect the brightness of the plasma membrane labelled with them. At a concentration above 10 μM, CSP-TPP not only stained the plasma membrane, but a fraction of these molecules also permeated the plasma membrane and stained a fraction of the cell interior, whereas CSP-TEA and CSP-DBO, under the same conditions, only specifically stained the plasma membrane without dye internalisation, suggesting that the introduction of the alkyltriphenylphosphonium moiety, unlike the other two, did not effectively enhance the anchoring ability of the plasma membrane. We evaluated the specific targeting properties of these CSP dyes to the plasma membrane by comparing the signal distribution of the cell wall and plasma membrane after plasmolysis of onion epidermal cells. As shown in Fig. 2, we performed plasmolysis experiments by treating CSP-stained onion epidermal cells with a 0.3 g per mL NaCl solution. After treating the onion epidermal cells with NaCl solution for 15 min, almost all plasma membranes were obviously detached from the cell wall. Fig. 2C shows the confocal images of onion epidermal cells stained with CSP dyes after plasmolysis. It can be seen that all the CSP dyes penetrated through the cell wall to stain the plasma membrane, and these dye molecules were mainly distributed in the plasma membrane, while only a very small number of dye molecules were distributed in the cell wall. Among them, the staining uniformity of CSP on the plasma membrane was relatively poor, while CSP-TPP had relatively high background signals compared to the others, which may be related to its relatively poor water solubility. Quantitative analysis of the ratio of the signal (Fig. 2D) from the plasma membrane to that from the cell wall (Smembrane/Swall) showed that CSP-DBO had the highest value (33.6), which was much higher than the values from onion cells stained with the other three dyes, suggesting that it had the best specific staining ability for the plasma membrane. Plant cells typically contain relatively large vacuoles, which necessitated a meticulous analysis of the positions of plasma membranes and vacuoles in Arabidopsis root tip cells. As illustrated in Fig. S3,† vacuoles in Arabidopsis root tip cells were clearly visible in the bright field, typically situated in the center of the cell and spherical in shape. In the dark field, the plasma membrane was distinctly marked by red colour and exhibited a rectangular cell outline. In the merged image, it is evident that the stained plasma membrane is situated on the peripheral outline of the cell, while the rounded vacuoles are located in the center of the cell without staining, without any superimposition of the two. This clearly demonstrates that our dye labels the plasma membrane and not the vacuole membrane, indicating the excellent staining specificity of our dyes to the plasma membrane. Furthermore, the 3D morphological changes of the plasma membrane in onion epidermal cells can be real-time tracked using CSP-DBO dye, as demonstrated in Fig. S4,† which provides a multi-angle, omnidirectional imaging mode. | ||
| Fig. 2 (A) Laser scanning confocal microscopy images of seedling root cells of Arabidopsis thaliana stained with CSP dyes at optimal time and concentration, (a and e) CSP (5.0 μM, 2 min); (b and f) CSP-TPP (5.0 μM, 2 min); (c and g) CSP-TEA (10.0 μM, 2 min); (d and h) CSP-DBO (10.0 μM, 2 min). Scale bar = 10 μm. (B) The average values of fsignal/fbackground for Arabidopsis thaliana root tip cells stained with CSP dyes. (C) Confocal images of onion epidermal cells stained with CSP dyes. (a–d) Stained with CSP, CSP-TPP, CSP-TEA, and CSP-DBO (10.0 μM, 2 min); (e–h) stained with CSP, CSP-TPP, CSP-TEA, and CSP-DBO after plasmolysis (10.0 μM, 15 min); scale bar = 50 μm. (D) The average values of Smembrane/Swall for onion epidermal cells stained with CSP dyes. | ||
In contrast to CSP, CSP-TPP, CSP-TEA and CSP-DBO all specifically labelled the plasma membrane for a short period of time at their optimal use concentrations without significant dye internalisation. To further compare the differences in their anchoring ability to the plasma membrane, we examined the duration of their specific imaging of the plasma membrane. As shown in Fig. S5,† CSP-TPP entered the cell interior after 2 min of staining and stained a portion of the cytoplasm and CSP-TEA only stained the plasma membrane within 20 min of duration after staining, but after more than 20 min, the dye molecules gradually penetrated through the plasma membrane to enter the cell interior, and most of the cytoplasm and nuclear membranes were labelled after 40 min, while the brightness of the signal from the plasma membrane was significantly reduced, indicating that CSP-TEA could only specifically track the plasma membrane for a short period of time. Under the same conditions, CSP-DBO still labelled the plasma membrane with high specificity up to 4 h after staining, and the signal from the dye was barely observed inside the cell (Fig. 3A). After 4 h a small amount of dye internalisation was observed, but CSP-DBO was still able to stain the plasma membrane very clearly. As shown in Fig. 3B, the average values for fsignal/fbackground are maintained within a stable range of 156.94–159.83 over such a long period of imaging time. Such strong plasma membrane anchoring ability of CSP-DBO allows it to specifically label the plasma membrane for a long period of time. With such a long and high-quality imaging time, CSP-DBO fulfils one of the necessary requirements for dynamic tracking of biological events related to the plasma membrane. Long-term real-time tracking of biological events also requires that the dyes have good photostability, and for this reason we evaluated the anti-photo-bleaching ability of CSP-DBO. As shown in Fig. S6 and S7,† we first determined the changes in the fluorescence intensity at 598 nm and the absorbance value of the absorption peak at 535 nm of CSP-DBO under continuous light irradiation at 561 nm. It can be seen that its fluorescence intensity under up to 100 minutes of light irradiation shows almost no significant change compared to the original intensity, while its absorbance value of the absorption peak at 535 nm shows no apparent decrease under the same conditions. In order to more accurately assess the photostability of CSP-DBO under confocal imaging conditions, we used the excitation light source of the confocal microscope to irradiate its stained plant cells for a long time. As shown in Fig. S8,† we collected confocal images of CSP-DBO-stained Arabidopsis root tip cells at different time points at 15 min intervals throughout the 90 min of continuous illumination, and it showed that the fluorescence signals did not observably decrease throughout the irradiation time. Meanwhile, quantitative analysis showed that there was only about an 8% decrease in fluorescence intensity. These data show that CSP-DBO has good photostability under prolonged illumination and is suitable for long-term monitoring of biological events related to the plasma membrane. We further assessed the toxicity of CSP-DBO dye to plant cells using the overall morphological changes in Arabidopsis. As shown in the toxicity experiment in Fig. S9,† the overall morphology of CSP-DBO-treated Arabidopsis seedlings was comparable to that of the control group, and the root length of dye-treated Arabidopsis seedlings did not change significantly relative to that of the control group even when used at a concentration of up to 50 μM, indicating that CSP-DBO has good biocompatibility with living plant cells.
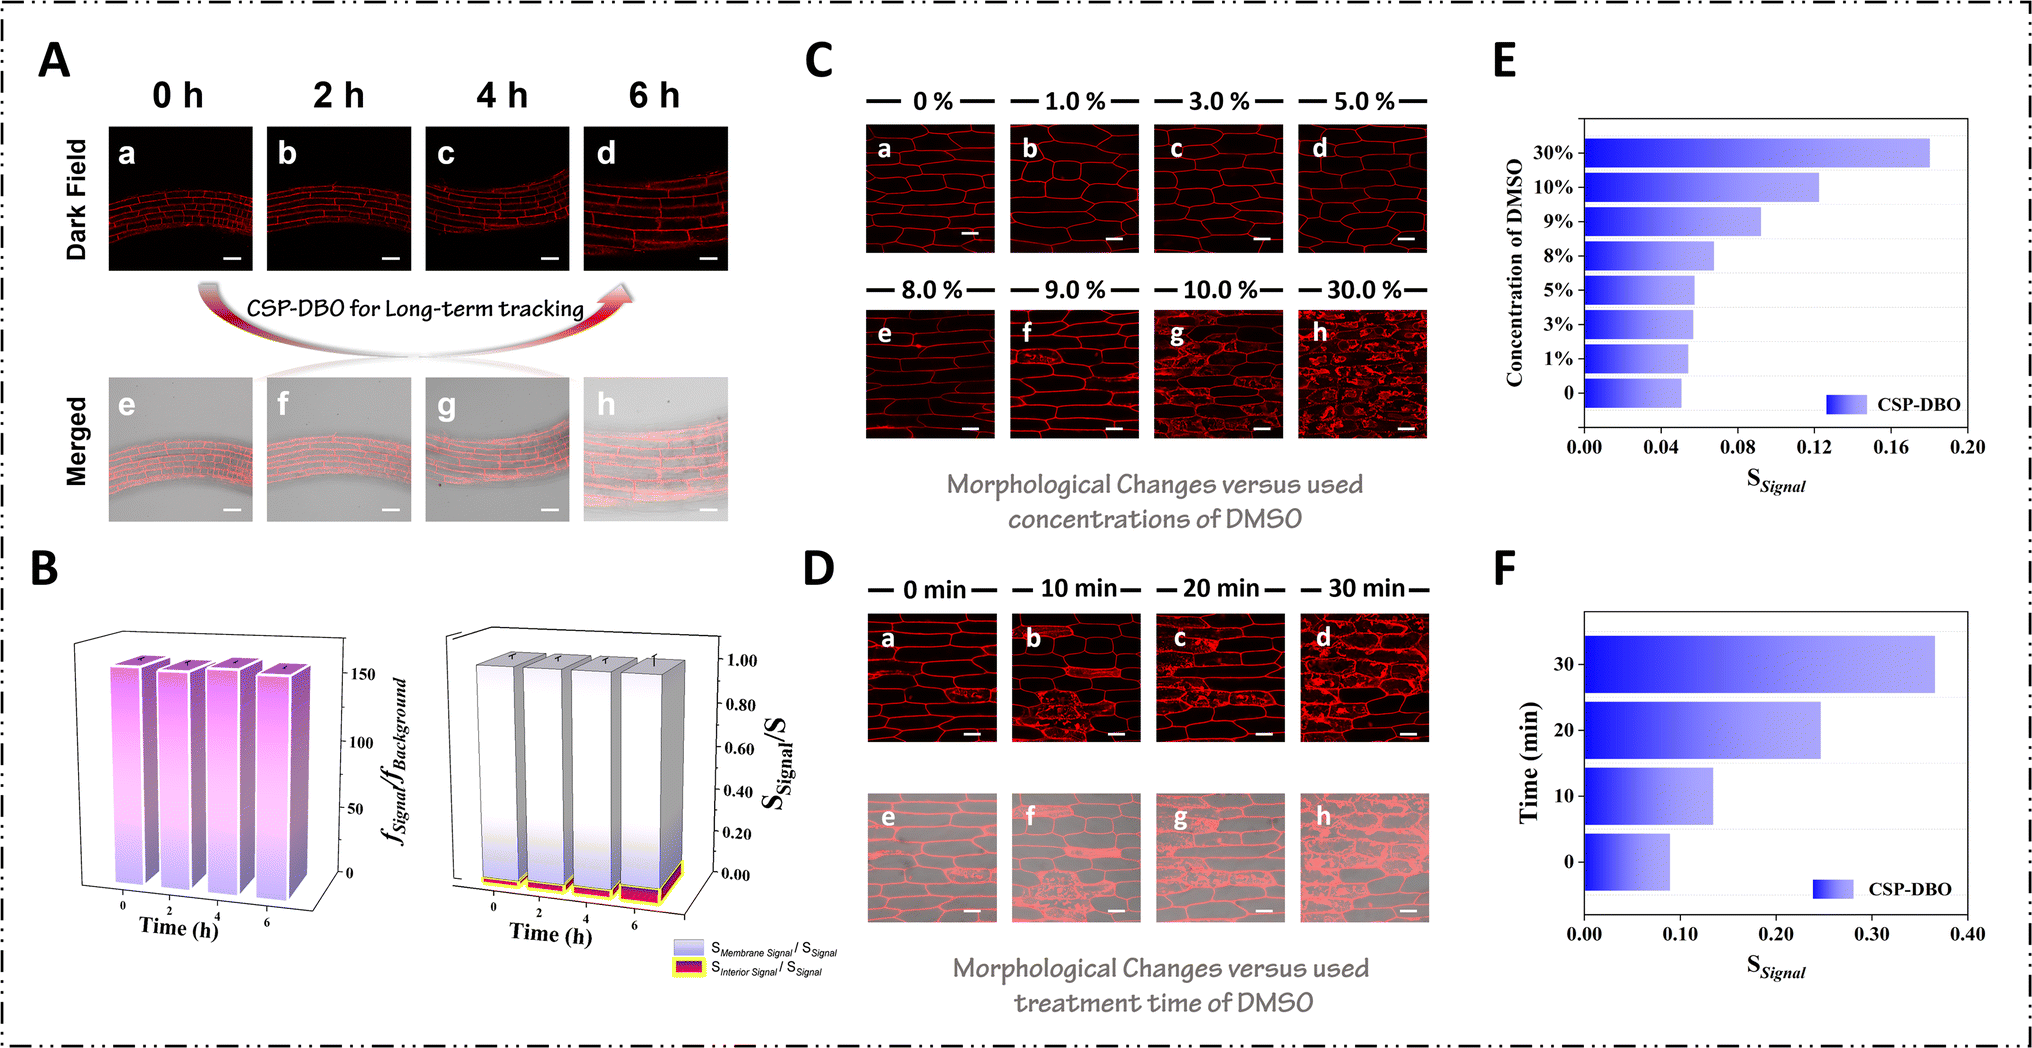 | ||
| Fig. 3 (A) High-resolution images of seedling roots of Arabidopsis thaliana stained with CSP-DBO under 561 nm excitation. Scale bar = 50 μm. (B) Quantitative analysis results (fsignal/fbackground, Smembrane signal/Stotal signal and Sinterior signal/Stotal signal) of high-resolution images of Arabidopsis thaliana seedling roots stained with CSP-DBO under 561 nm excitation. (C) Laser scanning confocal microscopy images of onion epidermal cells stained with CSP-DBO to monitor morphological changes versus the DMSO concentration at certain treatment times. Scale bar = 100 μm. (D) Laser scanning confocal microscopy images of onion epidermal cells stained with CSP-DBO to monitor morphological changes versus treatment time of DMSO at a specified concentration. Scale bar = 100 μm. (E) Quantitative analysis results (Ssignal) of laser scanning confocal microscopy images of stained onion epidermal cells treated with different concentrations of DMSO under 561 nm excitation. (F) Quantitative analysis results (Ssignal) of laser scanning confocal microscopy images of stained onion epidermal cells treated with 9% DMSO solution for different treatment times under 561 nm excitation. | ||
Living cells are susceptible to plasma membrane damage induced by pathogens, chemicals, inflammatory responses and mechanical stress, but there is a lack of visualisation tools that can track the process of plasma membrane damage over time.32 The CSP-DBO dye we have developed has the ability to specifically label the plasma membrane over a long period of time and is expected to be used for real-time tracking of plasma membrane damage. Many small-molecule fluorescent dyes, due to their poor aqueous solubility, often require large amounts of DMSO aqueous solution for solubilisation, which often causes damage to the plasma membrane when treating live cells with such dye solutions, resulting in false-positive experimental results. Therefore, we monitored the process of DMSO-induced plasma membrane damage in real time with CSP-DBO using onion inner epidermal cells as a typical chemical and explored the appropriate concentration and time of DMSO application. Prior to the commencement of the experiment, the pH resistance of CSP-DBO was tested in order to exclude the possibility of fluorescence fluctuations resulting from intracellular pH variation. As illustrated in Fig. S10,† the fluorescence intensity of CSP-DBO exhibited minimal fluctuations of less than 5% when the pH shifted from 4.6 to 7.5, thereby demonstrating the remarkable resistance of the dye to minor fluctuations in pH. As shown in Fig. 3C, we first treated onion epidermal cells with aqueous solutions containing different concentrations of DMSO for 2 min and then observed the cell changes under a confocal microscope. When an aqueous solution of DMSO with a concentration of less than 9% was used, it was observed that the plasma membrane was clearly labelled by the dye molecules and no observable dye internalisation occurred, indicating that the plasma membrane was still intact at this time. When the working concentration of DMSO was increased to 9%, fluorescent signals from the plasma membrane as well as fluorescent signals from the interior of the cell were observed in some cells, indicating that the plasma membrane of some cells had been damaged, resulting in the fluorescent dyes entering the interior of the cells. When the concentration reached 10%, the plasma membrane of most of the cells was damaged, and when the concentration reached 30%, the plasma membrane of most of the original cells had almost completely disappeared and almost all of the fluorescent signals were coming from inside the cells. Quantitative analyses showed that as the concentration of DMSO increased, the degree of damage to the plasma membrane of the cells gradually increased until the plasma membrane of all cells was completely destroyed (Fig. 3E). Similarly, when the used concentration of DMSO was constant, the degree of damage to the plasma membrane of the cells gradually increased with increasing treatment time, and the plasma membrane of the majority of the cells was essentially completely destroyed when the treatment time reached 30 minutes (Fig. 3D and F). These data indicate that CSP-DBO is capable of tracking chemically induced plasma membrane damage over a long period of time in real time and suggest that the maximum amount of DMSO used as a co-solvent in the dissolution of small molecule fluorescent dyes must be less than 9% in order not to disrupt the integrity of the plasma membrane within a short period of time. The chemically induced plasma membrane damage process tracked using CSP-DBO also provides a valuable opportunity to study the physiological response of plant cells to chemical stimuli. The process of chemically induced plasma membrane damage tracked using CSP-DBO also provides a valuable reference for studying the physiological response of plant cells to chemical stimuli and sets higher standards and requirements for the design of water-soluble biofluorescent dyes.
High-fidelity imaging of the plasma membrane of animal cells using CSP dyes with strong anchoring ability
We used HeLa cells as an example of animal cells to further validate the possibility that the number of charges carried by dye molecules and the type of charge determine their plasma membrane anchoring ability. As shown in Fig. 4A, similar to plant cell imaging, in CSP and CSP-TPP stained HeLa cells, fluorescent signals were observed not only in the plasma membrane, but also inside the cells, indicating the relatively weak anchoring ability of these two dyes to the plasma membrane of HeLa cells. CSP and CSP-TPP are prone to being internalized and thus unsuitable for long-term tracking of plasma membranes in animal cells. In comparison, CSP-TEA and CSP-DBO both clearly and specifically labelled the plasma membrane without obvious internalization. We also noticed that CSP-DBO stained the plasma membrane entirely and more uniformly than CSP-TEA, suggesting that dyes containing the alkyl 1,4-diazabicyclo [2.2.2]octan-1-ium moiety have a greater ability to stain the plasma membrane in animal cells. | ||
| Fig. 4 (A) Laser scanning confocal microscopy images of HeLa cells stained with CSP dyes, (a and e) CSP (10.0 μM, 5 min); (b and f) CSP-TPP (10.0 μM, 5 min); (c and g) CSP-TEA (10.0 μM, 5 min); (d and h) CSP-DBO (10.0 μM, 5 min) at various time points. Scale bar = 20 μm. (B) Co-localization of fluorescence signals in HeLa cells stained with CSP-DBO (20 μM, 5 min) and CellMask green (1 μM). Scale bar = 20 μm. (C) Laser scanning confocal microscopy images of seedling roots of HeLa cells stained with DiO (10.0 μM, 5 min), CellMask Green (10.0 μM, 5 min) and CSP-DBO (10.0 μM, 5 min) at various time points. Scale bar = 20 μm. (D) Bioimaging of normal cells (HEK293T and CRBCs) and cancer cells (HeLa and SH-SY5Y) stained with 10.0 μM CSP-DBO. Scale bar = 10 μm (a, b, c, e, f and g) and 20 μm (d and h). | ||
To further validate the staining specificity of CSP-DBO dye on the plasma membrane in animal cells, we co-stained HeLa cells with CSP-DBO and commercial membrane dyes such as DiO and CellMask Green.33 As shown in Fig. 4B, the red fluorescence signal of CSP-DBO in stained HeLa cells overlapped well with the green fluorescence signal of CellMask Green with a high Pearson coefficient. In addition, the signal intensity curves of CSP-DBO and CellMask Green showed great agreement, indicating that both CSP-DBO and CellMask Green can specifically label the plasma membrane. We further compared the imaging duration of CSP-DBO, CellMask Green and DiO by real-time tracing of membrane-specific fluorescence in living HeLa cells. As shown in Fig. 4C, 5 min after staining HeLa cells with 10 μM DiO, the plasma membrane and part of the cytoplasm of HeLa cells were simultaneously labelled by DiO. With the increasing time, the fluorescence signal from the plasma membrane became weaker while the intracellular signal became stronger, indicating the weak membrane-anchoring ability and the quick internalization of DiO. In contrast to DiO, both CSP-DBO and CellMask Green were able to stain the plasma membrane uniformly and clearly even after 30 min, suggesting that they have comparable membrane-anchoring durations. However, a small amount of green fluorescence caused by dye internalization was observed in CellMask Green stained HeLa cells after 10 minutes, and the area of intracellular fluorescence gradually increased with time. In addition, we found that very strong irradiation power is required to obtain confocal images with the desired brightness for CellMask Green and the power required is more than 20 times that of CSP-DBO, which easily leads to high phototoxicity to living cells, making it unsuitable for long-term imaging of living cells. Under the same conditions, the fluorescence signal of CSP-DBO remained clear, uniform and intact in the plasma membrane and almost invisible in the cytoplasm, confirming its strong ability to anchor to the plasma membrane. Compared with CellMask Green, the longitudinal width of the fluorescence covering the plasma membrane is smaller in CSP-DBO-stained HeLa cells, indicating that CSP-DBO can more accurately reflect the true thickness of the plasma membrane. We also stained chicken red blood cells (CRBCs), HEK293T cells and human neuroblastoma SH-SY5Y cells with the CSP-DBO dye to assess its staining ability in different animal cells. As shown in Fig. 4D, in addition to HeLa cells, CSP-DBO dye specifically labelled the plasma membranes of three other cell types including CRBCs, HEK293T and SH-SY5Y, indicating its broad applicability to a wide range of cell line types.
Dynamic tracking of morphological changes of the plasma membrane during cellular biological events and in vivo imaging
The excellent properties of CSP-DBO in labeling the plasma membrane encouraged us to apply CSP-DBO in dynamic tracing of plasma membrane-related biological processes in animal cells, including motility of membrane lipids, cytokinesis and cell fusion. We first evaluated the cytotoxicity of CSP-DBO to animal cells including HEK293T cells and HeLa cells. The viability of HEK293T cells gradually decreased after treatment with the increasing concentration of CSP-DBO for 24 h (Fig. S11†). HeLa cells maintained nearly 100% cell viability after treatment with the dye in the range of 5–35 μM, and it still remained at 84% cell viability for normal HEK293T cells stained with the dye at 10 μM. This demonstrates that CSP-DBO exhibits little cytotoxicity to animal cells at the working concentrations (10 μM) for labeling the plasma membrane and can be safely used for long-term monitoring of important biological events in living cells.34Next, we employed CSP-DBO dye to visualize the motility of membrane lipids via fluorescence recovery after photobleaching (FRAP), a conventional method to study the dynamics of membrane associated molecules in living cells.35 We first labelled the plasma membrane of living HeLa cells with CSP-DBO and then photobleached a selected area of the labelled plasma membrane with intensive laser light. As shown in Fig. 5A, we found that the fluorescence of the photobleached plasma membrane was gradually restored within 60 s, indicating that adjacent membrane lipids carrying CSP-DBO dye molecules with unbleached fluorescence diffused into the bleached area (Video S1†). This demonstrates that CSP-DBO dye is capable of real-time tracking the two-dimensional lateral diffusion of lipids within membranes of living cells. As the fluidity of the plasma membrane is a prerequisite for biological processes such as cytokinesis and cell fusion, we then tracked these processes by staining the plasma membrane with CSP-DBO. During the long-term monitoring of cytokinesis in CSP-DBO-stained HEK293T cells, we observed the morphological changes in the plasma membrane during cytokinesis, the final stage of cytokinesis which divides the cytoplasm, organelles, and cellular membrane into two daughter cells.36 As shown in Fig. 5B(a–c), labelling the plasma membrane with CSP-DBO enabled visualization of the sudden appearance of a cleavage furrow in the plasma membrane (Fig. 5B(b)), the first visible change of cytokinesis. As cytokinesis progressed, the cleavage furrow ingressed inward (Fig. 5B(c)) and finally bisected the mother cell. We also tracked cell fusion of polyethylene glycol (PEG)-treated CRBCs, which is a preferred model for cell fusion experiment.37 The plasma membrane of CRBCs was clearly labelled by incubation of CRBCs with 10 μM CSP-DBO (Fig. 5B(g)), which allowed us to track the whole process of cell fusion. Initially, several cells gradually approached each other and adhered together. As the fusion proceeded, the plasma membranes between two or more cells gradually joined together at a specific region but their cytoplasms still separated (Fig. 5B(h)). Eventually, the gap between cells disappeared, the cytoplasms began to fuse and two or more nuclei were enclosed in a single cell (Fig. 5B(i)). Of note, PEG that increases membrane permeability not only facilitated cell fusion, but also facilitated internalization of CSP-DBO, leading to simultaneous staining of plasma and nuclear membranes and making it more convenient for tracking cell fusion. Throughout the cell fusion process, changes in the structure and morphology of the plasma membrane were clearly tracked using CSP-DBO dye. To our knowledge, this is the first time that a fluorescent dye for the plasma membrane has been used to track the dynamics of the plasma membrane in animal cells during important biological events, including cytokinesis and cell fusion.
 | ||
| Fig. 5 Dynamic tracking of changes in plasma membrane morphology during in vitro and in vivo imaging of animals. (A) The motility of membrane lipids assayed by FRAP in living HeLa cells. (a) The area photobleached using the laser was represented as a red rectangular box, the green rectangular box was used as a control and the blue rectangular box represents the background; scale bar = 10 μm. (b–e) Representative images of laser-bleached areas and recovery of CSP-DBO fluorescence; scale bar = 2 μm. (f) Plot showing the time course of recovery after photobleaching of CSP-DBO fluorescence. (B) (a–f) Membrane dynamics during cytokinesis of HEK293T cells; (g–l) membrane dynamics during cell fusion of CRBCs treated with PEG. HEK293T cells and CRBCs were stained with 10 μM CSP-DBO for 5 min; scale bar = 10 μm. (C) Co-localization of fluorescence signals from CSP-DBO and lipofuscin in C. elegans. Confocal imaging of lipofuscin (a, f, k and p) and CSP-DBO (b, g, l and q) in worms at different stages of life; (c, h, m and r) enlarged images for higher magnification of the selected area shown in the left panel; (d, i, n and s) co-localisation coefficients of CSP-DBO with lipofuscin. (e, j, o and t) Enlarged images for higher magnification of the selected area shown in the left panel. Worms at different stages were fed with 1 μM CSP-DBO for 24 h before imaging; scale bar = 40 μm (a, b, d, f, g, i, k, l, n, p, q and s), 20 μm (c, e, h, j, m, o, r and t). | ||
Finally, we investigated the biocompatibility and imaging performance of CSP-DBO in vivo. Nematode Caenorhabditis elegans (C. elegans) is a classic model animal to assess environmental toxicity and neurotoxicity of hazardous chemicals,38 as well as in vivo imaging capability of fluorescent dyes.39 First, we evaluated the neurotoxicity of CSP-DBO in C. elegans exposed to various concentrations of CSP-DBO for 5 days. Locomotion behaviors such as body bending and head thrashing were thus measured to reflect the functional state of motor neurons.40 We found that CSP-DBO up to 40 μM did not significantly affect body bend or head thrash of the worms (Fig. S12†), indicating that CSP-DBO had no obvious neurotoxic effect in C. elegans. Furthermore, the life cycle of C. elegans was quantified by counting their survival days, and the impact of CSP-DBO on C. elegans lifespan was evaluated. As shown in Fig. S13,† up to 20 μM of CSP-DBO did not affect the life cycle of C. elegans, indicating that CSP-DBO has no significant toxic effect on the lifespan of C. elegans. To assess imaging capability of CSP-DBO in vivo, we directly stained the living worms with CSP-DBO. As shown in Fig. S14,† we found that a direct staining of worms with CSP-DBO for 30 min successfully labelled the epidermal cells of the worms in addition to the head area, indicating that CSP-DBO is capable of brightly labelling the plasma membrane of cells in vivo. When the dye molecules were absorbed by ingestion of organism in vivo, their distribution might be greatly altered through internal metabolism and they might finally deposit in areas rich in lipid-like substances such as lipofuscin. Lipofuscin is an autofluorescent, heterogeneous byproduct of failed intracellular catabolism accumulated in lysosomes of aging cells.41 The main components of lipofuscin are oxidized proteins and lipids such as triglycerides, free fatty acids, cholesterol and lipoproteins. We hypothesized that CSP-DBO might enter the intestinal epithelial cells after ingestion of the dye by the worms and be deposited in lipofusion due to the lipophilic properties of CSP-DBO and its specific binding to lipids of lipofuscin. To evaluate the capability of CSP-DBO in monitoring lipofuscin during different growth periods, worms at different stages were fed with 1 μM CSP-DBO for 24 h before imaging. As shown in Fig. 5C, the fluorescence of CSP-DBO in worms at L2 and L3 stages was mainly distributed along the middle portion of intestine, and only a small portion of the red signal overlapped the blue autofluorescence from lipofuscin because only a very small amount of lipofuscin is produced in the two stages. However, lipofuscin markedly increases at the L4 stage as evidenced by the substantially enhanced blue autofluorescence of lipofuscin, and it is clearly seen that the red signal from CSP-DBO is largely overlapped with the areas labelled by the autofluorescence of lipofuscin. The colocalized areas in adult worms become larger, and the co-localization coefficient is up to 0.76, indicating that CSP-DBO can track the dynamic change of lipofuscin in vivo. Consistent with that lipofuscin has been widely used as a reliable biomarker for aging cells, we found a positive correlation between fluorescence intensity of lipofuscin and worm age (Fig. 5C(a, f, k and p)) and between fluorescence intensity of CSP-DBO and worm age (Fig. 5C(b, g, l and q)). Interestingly, the co-localization results showed that the co-localization coefficient of CSP-DBO with lipofuscin increased with worm age (Fig. 5C(d, i, n and s)). This indicates that CSP-DBO could be used to reflect the aging process by labelling lipofuscin. In conclusion, CSP-DBO exhibits excellent biocompatibility and could be used for labelling the plasma membrane and monitoring specific byproducts of failed intracellular catabolism such as lipofuscin to reflect the aging process in vivo.
Conclusions
In summary, by systematically investigating the effects of dye molecules with different charge numbers and species on the imaging properties of plasma membranes, we have revealed the key regulatory roles of charge number and species on the anchoring ability of the plasma membrane and found that dye molecules with a higher charge number effectively prevent them from rapidly crossing the plasma membrane and that dye molecules with an alkyl 1,4,diazabicyclo[2.2.2]octan-1-ium moiety have a stronger plasma membrane anchoring ability compared to dye molecules with a triethylalkyl quaternary ammonium moiety and a triphenylalkyl phosphonium moiety, which provides a solid basis for long-term imaging of plasma membranes. The CSP dye molecules designed in this paper are based on a TICT molecular backbone, whose target-activated fluorescence properties allow them to achieve high-contrast fluorescent staining without washing. Among all the designed dye molecules, CSP-DBO has better plasma membrane targeting and the best plasma membrane anchoring ability and thus can be used for prolonged, high-fidelity labelling of the plasma membrane of animal and plant cells. Compared to the commercial DiO series of dyes, CSP-DBO has better water solubility, plasma membrane targeting specificity and longer imaging time; while compared to the commercial CellMask family, CSP-DBO has comparable imaging time but stronger signal brightness under the same conditions and can more realistically display the longitudinal structural width of the plasma membrane. Based on these excellent properties of CSP-DBO, we have used it for the first time to dynamically monitor the plasma membrane damage in plant cells and dynamically follow the morphological changes of the plasma membrane during cell biological events such as cell fusion and cell cytokinesis. Finally, due to its low toxicity to cells and live C. elegans, it can also be used for high quality in vivo imaging of the plasma membrane. The charge-modulated fluorescent anchor strategy proposed in this work provides an effective rule for the design of long-lasting plasma membrane imaging dyes, which is expected to greatly improve the imaging duration of plasma membranes with dye molecules and be used for the visualisation and dynamic tracking of more relevant biological processes.Data availability
The datasets supporting this article have been uploaded as part of the ESI.†Author contributions
Jiaqi Zuo, Aohui Peng — conceived the study, performed live-cell imaging and wrote the original draft (contributed equally); Penglei Wu, Chuangye Yao, Junjun Pan — assisting in the characterisation of photophysical properties, discussing the results and imaging experiments; Junyi Chen, Yingye Weng — Caenorhabditis elegans imaging experiments; Kewei Zhang — discussing the results and refining the ideas; Hui Feng — review & editing; Zhigang Jin— review & editing, funding acquisition, and supervision; Zhaosheng Qian — design of central ideas, carried out additional analyses, finalized this article, funding acquisition, and supervision.Conflicts of interest
There are no conflicts to declare.Acknowledgements
We gratefully acknowledge financial support from the Natural Science Foundation of Zhejiang Province (Grant No. LZ24B050001 and LY22B050001).Notes and references
- (a) D. Lingwood and K. Simons, Science, 2010, 327, 46–50 CrossRef CAS PubMed; (b) E. Sezgin, I. Levental, S. Mayor and C. Eggeling, Nat. Rev. Mol. Cell Biol., 2017, 18, 361–374 CrossRef CAS PubMed; (c) M. Vasconcelos-Cardoso, D. Batista-Almeida, L. V. Rios-Barros, T. Castro-Gomes and H. Girao, J. Cell Sci., 2022, 135, jcs259806 CrossRef CAS PubMed.
- (a) C. Dias and J. Nylandsted, Cell Discovery, 2021, 7, 4 CrossRef CAS; (b) P. S. Aguilar, M. K. Baylies, A. Fleissner, L. Helming, N. Inoue, B. Podbilewicz, H. Wang and M. Wong, Trends Genet., 2013, 29, 427–437 CrossRef CAS PubMed.
- (a) B. Huang, M. Bates and X. W. Zhuang, Annu. Rev. Biochem., 2009, 78, 993–1016 CrossRef CAS; (b) A. M. Achimovich, H. W. Ai and A. Gahlmann, Curr. Opin. Struct. Biol., 2019, 58, 224–232 CrossRef CAS.
- (a) K. A. Lukyanov, D. M. Chudakov, S. Lukyanov and V. V. Verkhusha, Nat. Rev. Mol. Cell Biol., 2005, 6, 885–890 CrossRef CAS PubMed; (b) J. R. Enterina, L. S. Wu and R. E. Campbell, Curr. Opin. Chem. Biol., 2015, 27, 10–17 CrossRef CAS PubMed.
- (a) O. Kocaoglu and E. E. Carlson, Nat. Chem. Biol., 2016, 12, 472–478 CrossRef CAS PubMed; (b) L. Wang, M. S. Frei, A. Salim and K. Johnson, J. Am. Chem. Soc., 2019, 141, 2770–2781 CrossRef CAS PubMed.
- (a) A. Jelinkova, K. Malinska, S. Simon, J. Kleine-Vehn, M. Parezova, P. Pejchar, M. Kubes, J. Martinec, J. Friml, E. Zazimalova and J. Petrasek, Plant J., 2010, 61, 883–892 CrossRef CAS PubMed; (b) N. Yagi, A. Yoshinari, R. J. Iwatate, R. Isoda, W. B. Frommer and M. Nkamura, Plant Cell Physiol., 2021, 62, 1259–1268 CrossRef CAS.
- C. Liu, X. Gao, J. Yuan and R. Zhang, TrAC, Trends Anal. Chem., 2020, 133, 116092 CrossRef CAS.
- L. Yang, Q. Chen, Z. Wang, H. Zhang and H. Sun, Coord. Chem. Rev., 2023, 474, 214862 CrossRef CAS.
- (a) M. H. Lee, H. M. Jeon, J. J. Han, N. Park, C. Kang, J. L Sessler and J. S. Kim, J. Am. Chem. Soc., 2014, 136, 8430–8437 CrossRef CAS PubMed; (b) T. Heek, J. Nikolaus, R. Schwarzer, C. Fasting, P. Welker, K. Licha, A. Herrmann and R. Haag, Bioconjugate Chem., 2013, 24, 153–158 CrossRef CAS PubMed.
- (a) J. Mei, N. L. C. Leung, R. T. K. Kwok, J. W. Y. Lam and B. Z. Tang, Chem. Rev., 2015, 115, 11718–11940 CrossRef CAS PubMed; (b) X. Cai and B. Liu, Angew. Chem., Int. Ed., 2020, 59, 9868–9886 CrossRef CAS PubMed.
- D. Wang, H. Su, R. T. K. Kwok, X. Hu, H. Zou, Q. Luo, M. M. S. Lee, W. Xu, J. W. Y. Lam and B. Z. Tang, Chem. Sci., 2018, 9, 3685–3693 RSC.
- X. Zheng, D. Wang, W. Xu, S. Cao, Q. Peng and B. Z. Tang, Mater. Horiz., 2019, 6, 2016–2023 RSC.
- S. M. Sayed, H. Jia, Y. Jiang, Y. Zhu, L. Ma, F. Yin, I. Hussain, A. Khan, Q. Ma, F. Wu and X. Lu, J. Mater. Chem. B, 2021, 9, 4303–4308 RSC.
- Y. Zheng, Y. Ding, X. Zheng, C. Zhang, Y. Zhang, Y. Xiang and A. Tong, Anal. Chem., 2021, 93, 10272–10281 CrossRef CAS PubMed.
- J. Zuo, E. Zhu, W. Yin, C. Yao, J. Liao, X. Ping, Y. Zhu, X. Cai, Y. Rao, H. Feng, K. Zhang and Z. Qian, Chem. Sci., 2023, 14, 2139–2148 RSC.
- A. S. Klymchenko, Acc. Chem. Res., 2023, 56, 1–12 CrossRef CAS.
- W. Zhang, Y. Huang, Y. Chen, E. Zhao, Y. Hong, S. Chen, J. W. Y. Lam, Y. Chen, J. Hou and B. Z. Tang, ACS Appl. Mater. Interfaces, 2019, 11, 10567–10577 CrossRef CAS PubMed.
- J. Wang, J. Li, Z. Shen, D. Wang and B. Z. Tang, ACS Nano, 2023, 17, 4239–4249 CrossRef CAS PubMed.
- L. Shi, K. Li, Y. Liu, X. Liu, Q. Zhou, Q. Xu, S. Chen and X. Yu, Chem. Commun., 2020, 56, 3661–3664 RSC.
- Y. Zheng, Y. Ding, J. Ren, Y. Xiang, Z. Shuai and A. Tong, Anal. Chem., 2020, 92, 14494–14500 CrossRef CAS PubMed.
- L. Huang, L. Zhu, W. Su, X. Liang, W. Li and W. Lin, Anal. Chem., 2022, 94, 11643–11649 CrossRef CAS PubMed.
- C. Yao, J. Zuo, P. Wu, J. Liu, J. Pan, E. Zhu, H. Feng, K. Zhang and Z. Qian, Talanta, 2024, 275, 126105–126114 CrossRef CAS PubMed.
- X. Zhang, Z. Wang, H. Chu, Z. Xiong, Y. Li, Y. Chen, Q. Zhu, H. Feng, E. Zhu, J. Zhou, P. Huang and Z. Qian, Anal. Chem., 2022, 94, 4048–4058 CrossRef CAS.
- L. Shi, Y. Liu, K. Li, A. Sharma, K. Yu, M. S. Ji, L. Li, Q. Zhou, H. Zhang, J. S. Kim and X. Yu, Angew. Chem., Int. Ed., 2020, 59, 9962–9966 CrossRef CAS.
- Q. Li, J. Hong, S. Feng, S. Gong and G. Feng, Anal. Chem., 2022, 94, 11089–11095 CrossRef CAS.
- M. Wu, J. Leung, C. Kam, B. Situ, Z. Wu, T. Y. Chou, S. Feng and S. Chen, Cell Rep. Phys. Sci., 2022, 3, 100735 CrossRef CAS.
- Y. Bu, M. Rong, J. Wang, X. Zhu, J. Zhang, L. Wang, Z. Yu, Y. Tian, H. Zhou and Y. Xie, Anal. Chem., 2022, 94, 8373–8381 CrossRef CAS PubMed.
- M. Collot, P. Ashokkumar, H. Anton, E. Boutant, O. Faklaris, T. Galli, Y. Mely, L. Danglot and A. S. Klymchenko, Cell Chem. Biol., 2019, 26, 600–614 CrossRef CAS PubMed.
- C. Wang, W. Chi, Q. Qiao, D. Tan, Z. Xu and X. Liu, Chem. Soc. Rev., 2021, 50, 12656–12678 RSC.
- A. S. Klymchenko, Acc. Chem. Res., 2017, 50, 366–375 CrossRef CAS PubMed.
- M. R. Naylor, A. M. Ly, M. J. Handford, D. P. Ramos, C. R. Pye, A. Furukawa, V. G. Klein, R. P. Noland, Q. Edmondson, A. C. Turmon, W. M. Hewitt, J. Schwochert, C. E. Townsend, C. N. Kelly, M. Blanco and R. S. Lokey, J. Med. Chem., 2018, 61, 11169–11182 CrossRef CAS PubMed.
- C. Barisch, J. C. M. Holthuis and K. Cosentino, Biol. Chem., 2023, 404, 467–490 CrossRef CAS PubMed.
- (a) S. Sowinski, C. Jolly, O. Berninghausen, M. Purbhoo, A. Chauveau, K. Köhler, S. Oddos, P. Eissmann, F. Brodsky, C. Hopkins, B. Önfelt, Q. Sattentau and D. Davis, Nat. Cell Biol., 2008, 10, 211–219 CrossRef CAS PubMed; (b) E. Vogt, K. Tokuhiro, M. Guo, R. Dale, G. Yang, S. Shin, M. Movilla, H. Shroff and J. Dean, Nat. Commun., 2019, 10, 2271 CrossRef PubMed.
- (a) N. Gauthier, M. Fardin, P. Roca-Cusachs and M. Sheetz, Proc. Natl. Acad. Sci. U.S.A., 2011, 108, 14467–14472 CrossRef CAS PubMed; (b) C. Tam, V. Idone, C. Devlin, M. Fernandes, A. Flannery, X. He, E. Schuchman, I. Tabas and N. Andrews, J. Cell Biol., 2010, 189, 1027–1038 CrossRef CAS PubMed; (c) R. Mercier, Y. Kawai and J. Errington, Cell, 2013, 152, 997–1007 CrossRef CAS PubMed.
- M. Carnell, A. Macmillan and R. Whan, Methods Mol. Biol., 2015, 1232, 255–271 CrossRef CAS PubMed.
- S. Oliferenko, T. Chew and M. Balasubramanian, Genes Dev., 2009, 23, 660–674 CrossRef CAS.
- S. Knutton, J. Cell Sci., 1979, 36, 61–72 CrossRef CAS PubMed.
- (a) X. Hua, X. Feng, G. Liang, J. Chao and D. Wang, Environ. Sci. Technol., 2023, 57, 4940–4950 CrossRef CAS PubMed; (b) M. Leung, P. Williams, A. Benedetto, C. Au, K. Helmcke, M. Aschner and J. Meyer, Toxicol. Sci., 2008, 106, 5–28 CrossRef CAS PubMed.
- (a) J. Alagarasan, S. Shasikala, S. Ganesan, M. Arunachalam, U. Manojkumar, S. Palaninaicker, D. Nguyen, S. Chang, M. Lee and H. Lo, Environ. Res., 2023, 224, 115402 CrossRef CAS PubMed; (b) S. Das, A. Batra, S. Kundu, R. Sharma and A. Patra, Chem. Sci., 2024, 15, 102–112 RSC.
- F. Zheng, C. Chen and M. Aschner, Curr. Protoc., 2022, 2, e496 CrossRef CAS PubMed.
- A. Moreno-García, A. Kun, O. Calero, M. Medina and M. Calero, Front. Neurosci., 2018, 12, 464 CrossRef PubMed.
Footnotes |
| † Electronic supplementary information (ESI) available. See DOI: https://doi.org/10.1039/d4sc01423e |
| ‡ These authors contributed to this work equally. |
| This journal is © The Royal Society of Chemistry 2024 |