
 Open Access Article
 This Open Access Article is licensed under a Creative Commons Attribution-Non Commercial 3.0 Unported Licence
A near-IR ratiometric fluorescent probe for the precise tracking of senescence: a multidimensional sensing assay of biomarkers in cell senescence pathways†
Haihong
Liu
,
Ruidian
Lv
,
Fuxiang
Song
,
Yaqun
Yang
,
Fei
Zhang
,
Liantao
Xin
,
Peng
Zhang
 *,
Qian
Zhang
* and
Caifeng
Ding
*
*,
Qian
Zhang
* and
Caifeng
Ding
*
Key Laboratory of Optic-electric Sensing and Analytical Chemistry for Life Science, MOE, Shandong Key Laboratory of Biochemical Analysis, Key Laboratory of Analytical Chemistry for Life Science in Universities of Shandong, College of Chemistry and Molecular Engineering, Qingdao University of Science and Technology, Qingdao 266042, China. E-mail: pengzhang@qust.edu.cn; zhangq_chem@qust.edu.cn; dingcaifeng@qust.edu.cn
First published on 13th March 2024
Abstract
Senescence is a complex physiological process that can be induced by a range of factors, and cellular damage caused by reactive oxygen species (ROS) is one of the major triggers. In order to learn and solve age-related diseases, tracking strategies through biomarkers, including senescence-associated β-galactosidase (SA-β-gal), with high sensitivity and accuracy, have been considered as a promising solution. However, endogenous β-gal accumulation is not only associated with senescence but also with other physiological processes. Therefore, additional assays are needed to define cellular senescence further. In this work, a fancy fluorescent probe SA-HCy-1 for accurately monitoring senescence is developed, with SA-β-gal and HClO as targets under high lysosomal pH conditions (pH > 6.0) specifically, on account of the role β-gal commonly played as an ovarian cancer biomarker. Therefore, precise tracking of cellular senescence could be achieved in view of these three dimensions, with response in dual fluorescence channels providing a ratiometric sensing pattern. This elaborate strategy has been verified to be suitable for biological applications by skin photo-aging evaluation and cellular passage tracing, displaying a significantly improved sensitivity compared with the commercial X-gal kit measurement.
Introduction
Senescence is a multifaceted process triggered by various factors, including genetic and epigenetic alterations to DNA, mitochondrial dysfunction, stem cell exhaustion, telomere shortening, and cellular damage from reactive oxygen species (ROS) produced by incomplete aerobic metabolism.1,2 ROS, including hydrogen peroxide (H2O2), hydroxyl radicals (˙OH) and hypochlorous acid (HClO), is not only an intracellular signal and growth stimulant but also a well-known trigger of senescence.3–6 Exploring the internal mechanism and development of aging has become a great concern, and also a huge challenge faced by researchers.Cellular senescence is a crucial factor in aging, with senescent cells becoming more prevalent in tissues as they age, particularly in adipose tissue, muscle and skin,7 which is believed to be the result of replicative exhaustion, and each individual cell has a finite potential for cell division. The main purpose of cellular senescence is to prevent the proliferation of damaged or stressed cells and trigger tissue repair,8,9 which proceeds throughout the entire cellular activity, playing a vital role in various physiological and pathological processes such as embryogenesis, wound healing and tumor suppression.10–13 However, the chronic accumulation of senescent cells in tissues impairs organismal functions and exacerbates aging.14 As a potential breakthrough point for age-related diseases, the topic of cellular senescence has gained considerable concern, tending to be a research focus nowadays.
In order to learn aging comprehensively, several biomarkers have been developed to illustrate this process and the related diseases, which provide insights into this research at a specific biological level.15 It is a general acknowledgement that precise tracking of aging procedures through biomarkers and effective early interventions has been considered as a promising resolution to ameliorate aging.16 β-galactosidase (β-gal), a member of glycoside hydrolases widely present in tissues, is capable of catalyzing the hydrolysis of the glycosidic bond between galactose and organic groups, which is associated with several physiological processes including aging. However, β-gal in human cells is usually derived from GLB1 genes expressed in lysosomes and is a typical biomarker of ovarian cancer.17,18 In recent years, many fluorescent probes targeting β-gal have been developed to detect senescent cells,19–22 but it still remains a great challenge to monitor the aging process precisely by distinguishing senescence-associated β-gal (SA-β-gal) from other sources of β-gal (for example, ovarian cancer) through the introduction of recognition units of other dimensions.17,18
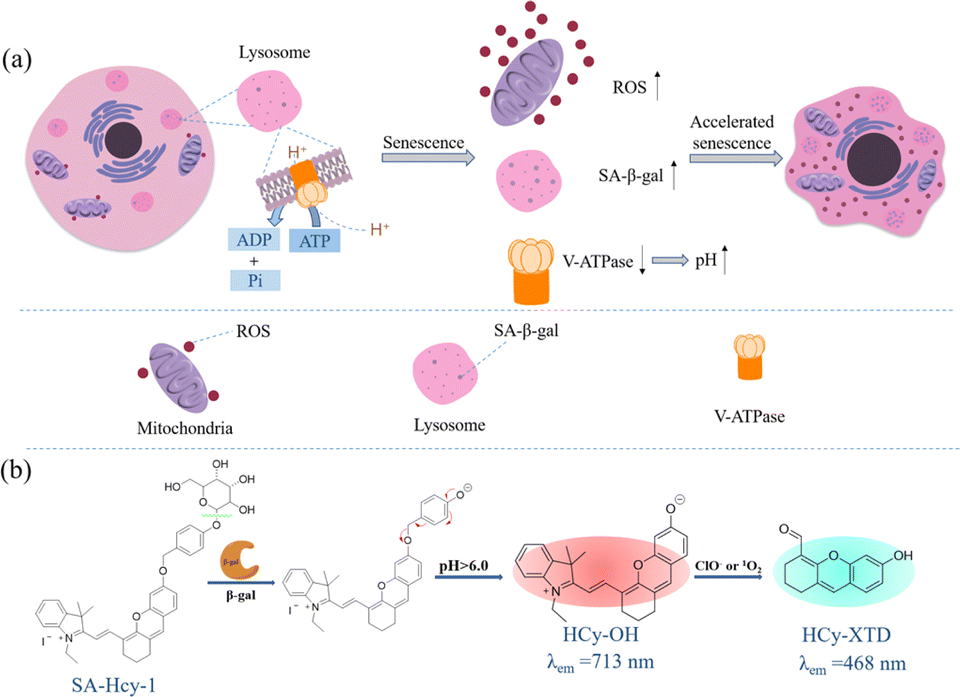
The pH value of lysosomes is within the range of 4.5–5.5 in the normal state,23 which is mainly maintained by V-type ATPases (V-ATPases), serving as a proton pump to drive protons produced upon ATP hydrolysis into the lysosomal cavity, as shown in Scheme 1a. During cellular senescence, V-ATPase activity is reduced, leading to the failure in pumping H+ into lysosomes and the dysregulated lysosomal pH, so senescent cells exhibit a higher pH value in lysosomes.24 However, a relatively low pH value is found in lysosomes in cancer cells (3.8–4.7),25 contributed by a higher metabolic capacity, and lysosomal pH could be thereby treated as a key to distinguish senescent cells from cancer cells. Collectively, overexpressed ROS, a rise in lysosomal pH and the accumulation of SA-β-gal were the essential indicators for senescence tracking, and a judicious design from these three viewpoints could make a multidimensional strategy to monitor senescence precisely and rapidly.
 | ||
| Scheme 1 (a) Schematic diagram of signaling pathways for cellular senescence. (b) Proposed sensing mechanism of probe SA-HCy-1 for β-gal and ROS in a high lysosomal pH environment. | ||
Encouraged by the aforementioned considerations, a novel fluorescence receptor SA-HCy-1 for precise tracking of senescence based on the triple responsive mechanism is developed in this work, employing NIR-emissive cyanine as the skeleton, decorated with galactose through a self-immolative linker. The NIR fluorescence at 713 nm could be recovered after the selective cleavage by SA-β-gal followed by the spontaneous 1,6-elimination of 4-hydroxybenzyl linkage under neutral or alkaline conditions, which is unavailable for β-gal derived from ovarian cancer lysosomes. The double bond on the cyanine framework could be broken by ROS (taking ClO− as an example), generating cyan-emissive products, which provide ratiometric fluorescence centered at 468 nm and 713 nm to report the senescence degree.26 This elaborate receptor has been verified to be capable of tracking the senescence procedure with high accuracy contributed by the overall control of 3 dimensions of SA-β-gal, pH and ROS (Table S1†). In view of this, probe SA-HCy-1 can effectively distinguish β-gal from senescence and ovarian cancer cells. The real-time monitoring of cellular senescence could be visualized in dual channels with improved performance in sensitivity compared with the commercial reagent X-gal. It is worth mentioning that the actual application was further proceeded at the organism level by the skin photo-senescence model, which declared that probe SA-HCy-1 is promising for evaluating the degree of skin-senescence and the working efficiency of sunscreen products.
Results and discussion
Design and synthesis of probe SA-HCy-1
The synthetic route of SA-HCy-1 is illustrated in Scheme 2. The intermediate HCy-OH was synthesized by conjugating cyanine derivative Cy-Cl with resorcin under basic conditions, which contributed to a phenolic hemicyanine skeleton.27,28SA-HCy-1 was then obtained through a nucleophilic substitution of HCy-OH and etra-O-acetyl-α-D-galactopyranosyl-1-bromide under the catalysis of Cs2CO3 and deacetylation in the presence of CH3ONa successively. The chemical structures of SA-HCy-1 and HCy-OH were confirmed using NMR spectra and high-resolution mass spectra (HR-MS), as displayed in Fig. S1–S7, in the ESI†.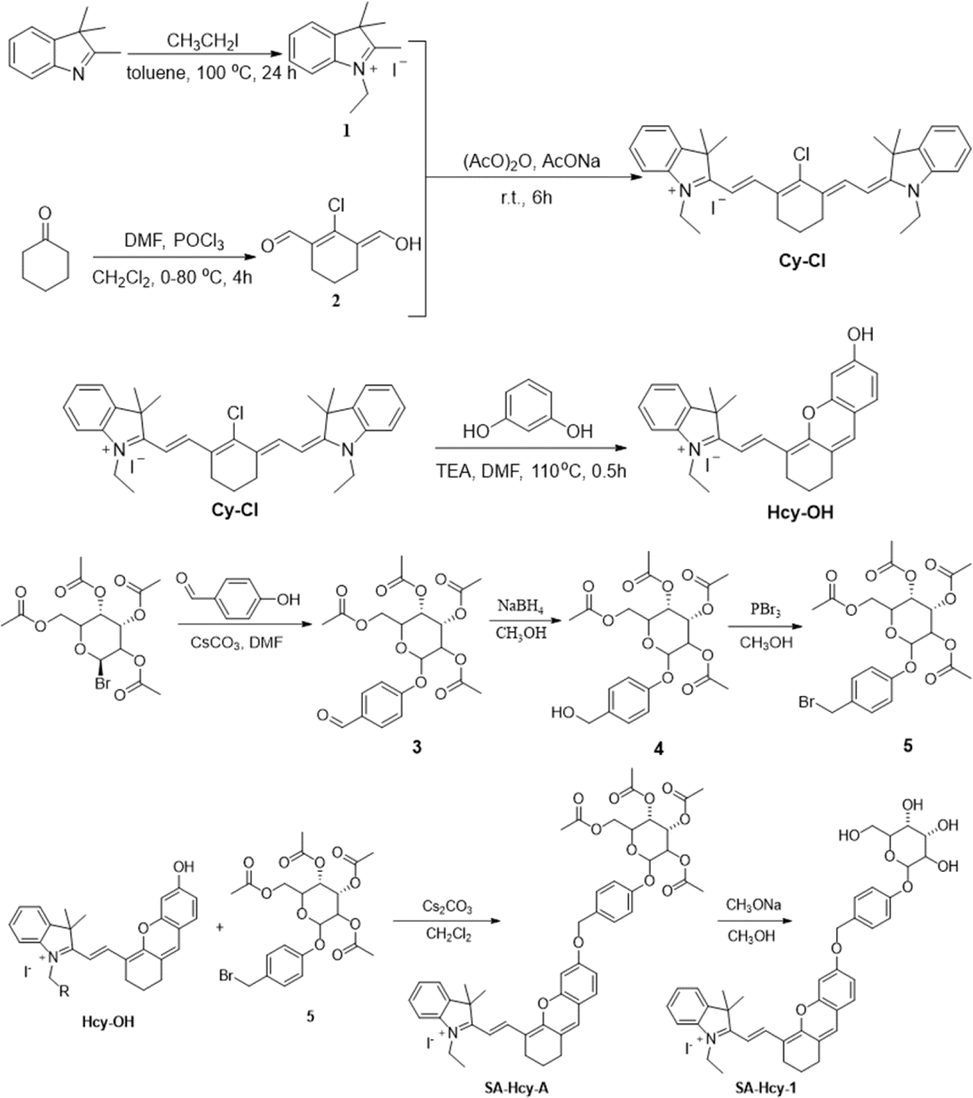 | ||
| Scheme 2 Synthesis route of probe SA-HCy-1. | ||
By the introduction of a self-immolative linker, 4-(hydroxymethyl)phenol, between the NIR fluorescent dye HCy-OH and galactose, SA-HCy-1 is expected to have a lower spatial site resistance and faster response in living cells. SA-HCy-1 exhibits weak fluorescence in aqueous solution when the phenolic hydroxyl moiety of HCy-OH for regulating electron-donating capability is blocked by the β-galactopyranoside derivative. β-Gal could induce the cleavage of the galactopyranoside group in SA-HCy-1. After removing the galactose residue, SA-HCy-1 is supposed to form a phenolate intermediate subsequently and undergo 1,6-elimination of 4-hydroxybenzyl spontaneously to generate the fluorophore HCy-OH with strong NIR emission. It is worth mentioning that the 1,6-elimination of 4-hydroxybenzyl is clarified to be pH-dependent and can be accelerated in the high pH environment specifically.29 The subsequent reaction with ROS results in oxidative cleavage of the alkene linker of HCy-OH to generate xanthene derivative HCy-XTD,30,31 which leads to a large blue shift of ∼245 nm in fluorescence, achieving a excellent detection scheme for ROS in a ratiometric pattern.
Optical sensing of probe SA-HCy-1 to β-gal and ROS
The spectroscopic properties of SA-HCy-1 and its performance upon the sensing event were first investigated in 10 mM PBS using absorption and fluorescence spectra, as displayed in Fig. 1. There were observed two main absorption peaks at 600 nm and 650 nm respectively with a weak shoulder peak at 566 nm for SA-HCy-1, and weak fluorescence centered at 675 nm could be captured when excited at 600 nm. The concentration dependent experiments showed that there was a linear relationship between the concentrations of SA-HCy-1 and the absorbance at 600 nm at low concentrations (<20 μM), indicating that the probe had good water solubility (Fig. S8†). Upon incubation with 100 mU mL−1 β-gal for 20 minutes, the intrinsic absorbance showed an obvious decrease, along with a new absorption at around 680 nm (Fig. 1a). Accordingly, a relatively weak emission centered at 468 nm could be measured upon excitation at 360 nm, whereas NIR fluorescence at 713 nm for excitation at 600 nm was further monitored as a response for the reaction with β-gal (Fig. 1b and c), which was believed to originate from the envisaged intermediate HCy-OH after the enzymatic reaction with β-gal and spontaneous elimination illustrated in Scheme 1. The solution color was found to turn blue-green from blue during the enzymatic reaction, contributing to a color development sensing assay. Subsequent addition of 100 μM ClO− further triggered a decrease in the NIR fluorescence and a large enhancement in emission located at 468 nm.32 This conversion in fluorescence could be rationalized by the oxidation of HCy-OH by ClO−, generating the cyan emissive HCy-XTD as the product, as shown in Scheme 1b. It was intriguing that negligible response could be obtained for ClO− without pretreatment with β-gal, further confirming that receptor SA-HCy-1 underwent the enzymatic reaction and oxidation successively as displayed in Scheme 1b, suggesting an “AND” logic sensing pattern.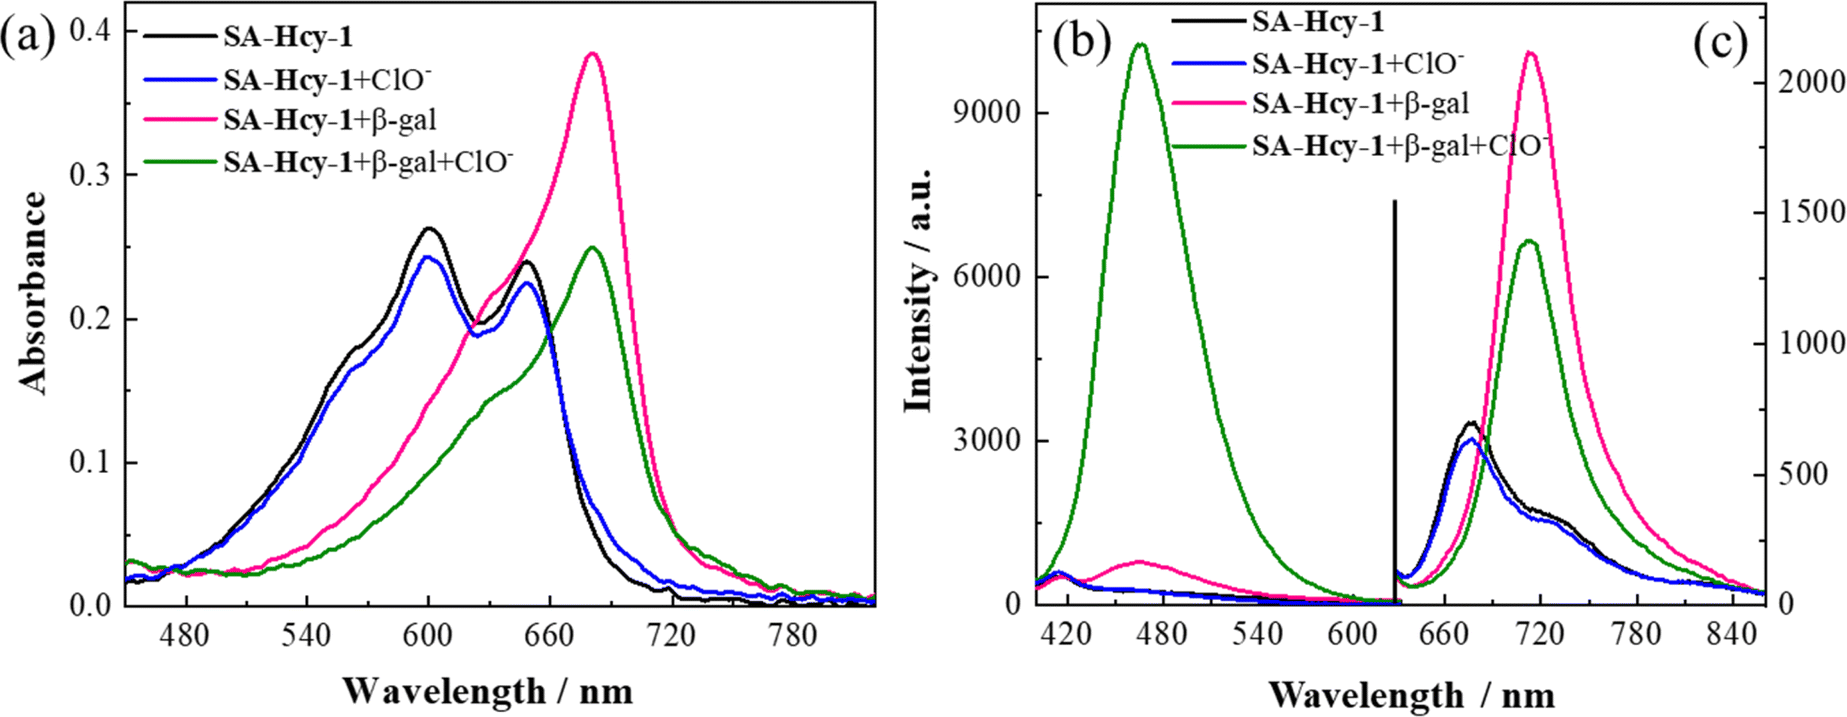 | ||
| Fig. 1 (a) Absorbance and (b and c) fluorescence spectra of SA-HCy-1 (black line), SA-HCy-1 incubated with 100 μM ClO− (blue line), SA-HCy-1 incubated with 100 mU mL−1 β-gal (red line), and SA-HCy-1 incubated with 100 mU mL−1 β-gal and 100 μM ClO− (green line) in 10 mM PBS of pH 8.0. [SA-HCy-1] = 10 μM, λex = 360 nm for (b) and λex = 600 nm for (c). | ||
Inspired by the appealing spectral behavior, a series of detailed investigations were then carried out to determine the optimal working conditions.33,34 The specific response to ROS, including H2O2, t-BuOO−, ONOO−, ClO−, O2−, ˙OH and 1O2, was first determined by absorption and fluorescence respectively following the above experimental process, as shown in Fig. S9.† Receptor SA-HCy-1 displayed negligible response towards ROS except 1O2 and ClO− after pretreatment with β-gal, and little response could be obtained towards ROS in the absence of β-gal. This spectral performance was confirmed from the histogram in Fig. S9d,† exhibiting a large enhancement in fluorescence at 468 nm upon the introduction of ClO−. The proposed logic assay was therefore suggested to be workable for 1O2 and ClO−,25 and ClO− was chosen for further exploration considering the superior spectral performance and mutually convertible nature of ROS.
pH condition was then optimized using the pH-dependent spectra, and the absorption and fluorescence response were measured after the enzymatic reaction in 20 minutes, as displayed in Fig. S10.† It is noteworthy that the spectra barely changed in an acidic medium (pH < 6.0), with the maximum absorption and fluorescence peak located at 600 and 673 nm respectively. Upon changing the alkalization of the working conditions from pH 4.0 to 9.0, the intrinsic spectra of SA-HCy-1 diminished, along with new typical absorption and fluorescence centered at 680 and 713 nm respectively. There exhibited isosbestic points during the investigation of absorption at 656 nm and 680 nm for emission, implying a constant conversion of the immediate structures. According to the fluorescence tendency at 713 nm towards pH shown in Fig. S10d,† receptor SA-HCy-1 almost remained stable for the exploration, whereas an “S”-type enhancement was recorded for the enzymatic reaction, clarifying that emission at 713 nm arose from the reaction product under the influence of pH. The responsive emission at 713 nm revealed an abrupt increase for pH of 6.0–8.0, which tended to be gentle at pH above 8.0, so the response was available in solutions with a pH value above 6.0. Based on the above results, in order to obtain significant spectral changes, in vitro experiments in the solution phase were conducted in a buffer solution with a pH of 8.0. Nevertheless, our research showed that the detection performance for senescence biomarkers remained excellent in physiological environments (pH 7.4), as described in Fig. S11.†
In order to figure out the mechanism for the pH-dependent spectral performance above, further study on the fluorophore HCy-OH was performed, on account of the pH-sensitive phenolic hydroxyl group in this intermediate. The optical performance of HCy-OH towards pH values was measured by pH-dependent absorption and fluorescence, as shown in Fig. S12.† The absorption and fluorescence of HCy-OH tended to be similar to that of receptor SA-HCy-1 under acidic conditions, with a maximum emission located at 673 nm, indicating that the skeleton of the chromophore was the same one. When the working condition was alkalized, an obvious bathochromic shift of the spectra was captured, giving rise to a maximum fluorescence at 713 nm. According to the intensity plot versus pH values in Fig. S12d,† an increase was recorded when the pH was above 6.0, reaching the plateau point at pH 10.0. The pKa of HCy-OH was hence measured to be 7.41, and deprotonated HCy-OH was available in senescence tissues with a higher pH value. Therefore, the pH-sensitive HCy-OH was responsible for the pH-dependent spectral conversion, capable of measuring β-gal under senescence conditions with red emission at 713 nm.
It is known that the activity of β-gal can be affected by working temperature, so the optimal temperature was determined by examining the responsive emission in the temperature range of 5–60 °C. As shown in Fig. S13,† a stable fluorescence intensity was observed within 5–50 °C, indicating that the probe was workable for β-gal over a wide temperature range. However, a prodigious drop in the response was captured at higher temperature (60 °C), suggestive of a loss in β-gal activity at excessive temperature. In addition, the influence of temperature on receptor SA-HCy-1 was also determined, and the structure was confirmed to remain stable learning from the unchanged emission during the experiment. Based on an overall consideration of β-gal activity and future usage in the bioenvironment, 37 °C was hence maintained for the following experiment.
The reaction time for β-gal and ClO− was then optimized respectively by tracking the fluorescence after incubation. After treatment with 100 mU mL−1 β-gal, the responsive emission was recorded under the excitation of 600 nm, as revealed in Fig. S14,† and the fluorescence intensity at 713 nm was collected. The fluorescence response could be readily obtained in 5 minutes, indicative of a quick reaction with β-gal, which levelled off in 20 minutes, suggesting the completion of this sensing event. However, the fluorescence emission of SA-HCy-1 itself remained unchanged under the same conditions, indicating that the probe was sufficiently stable under the sensing conditions. After the subsequent introduction of 100 μM ClO−, the reaction procedure was evaluated using responsive fluorescence centered at 468 nm upon irradiation at 360 nm, as depicted in Fig. S15.† The abrupt enhancement in intensity was captured for the first 20 minutes, and the oxidation by ROS slowed down during the following 60 minutes. Therefore, the reaction time was optimized at 60 minutes to ensure that the entire sensing procedure was complete.
The working performance of receptor SA-HCy-1 was discussed in terms of sensitivity and selectivity respectively, and sensitivity was studied in two aspects.35–37 For the first stage of the sensing event, fluorescence was recorded upon addition of β-gal of increasing concentration from 0 to 500 mU mL−1 in 20 minutes. There was observed a concomitant growth towards the β-gal level during the experiment, which reached the saturated state in 100 mU mL−1, as displayed in Fig. 2a. A well-defined linearity (I713nm = 38.73 [β-gal] + 314.51, R2 = 0.991) within the range of 0–30 mU mL−1 was exhibited herein (Fig. 2b), contributing to a detection limit of 0.25 mU mL−1, which was considered to be superior to most reports. After treatment with 100 mU mL−1 β-gal for 20 minutes, 0–250 μM ClO− was applied for another 60 minutes, and fluorescence was monitored in Fig. 2d upon excitation at 360 and 600 nm respectively. A constant increase of the cyan fluorescence centered at 468 nm could be observed, accompanied by a continuous loss in the red region at 713 nm, giving rise to a ratiometric pattern depicted in Fig. 2e, which tended to be stable in 100 μM. A linear relationship (I468nm/I713nm = 0.25 [ClO−] + 0.69, R2 = 0.993) could be obtained within a ClO− concentration of 0–30 μM, leading to a detection limit of 184.0 nM.
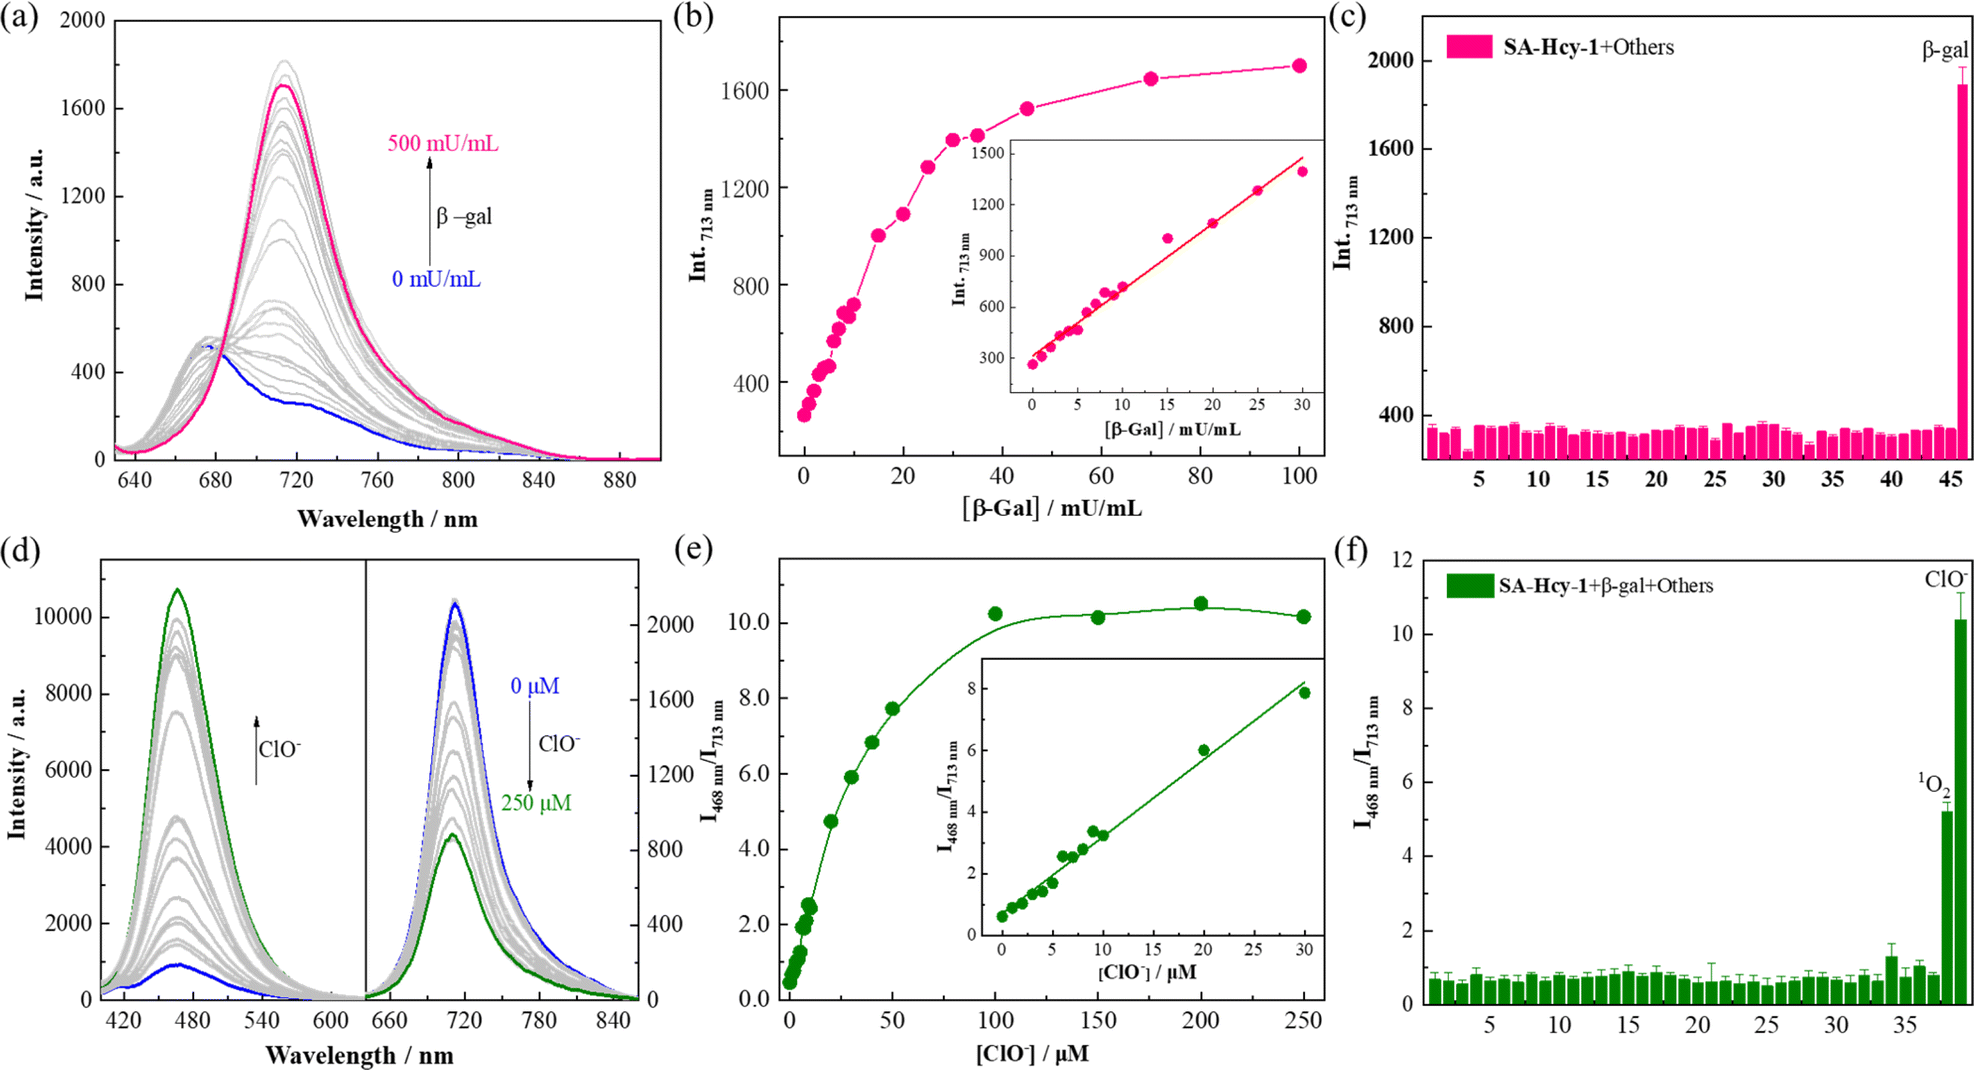 | ||
| Fig. 2 (a) Fluorescence spectra of SA-HCy-1 upon incubation with increasing concentration of β-gal from 0 to 500 mU mL−1 at 37 °C for 30 minutes in 10 mM PBS of pH 8.0. [SA-HCy-1] = 10 μM, λex = 600 nm. (b) Fluorescence intensity of SA-HCy-1 at 713 nm after incubation with increasing concentration of β-gal from 0 to 100 mU mL−1 at 37 °C for 30 minutes. (Inset) Linear relationship between I713nm and β-gal of concentrations from 0 to 30 mU mL−1. (c) Fluorescence intensity of SA-HCy-1 at 713 nm after the addition of various biological species. 1: blank; 2–19 (100 μM amino acid): Lys, Try, Met, Leu, Ser, His, Ary, Phe, Val, Gln, Thr, Ile, Glu, Gly, Asn, Ala, Cys, GSH; 20–28 (100 μM cations): Zn2+, Ca2+, Mg2+, Ni2+, Fe3+, Hg2+, K+, Co2+, Pb2+; 29–32 (100 μM anions): S2−, CO32−, SO42−, NO3−; 33–39 (100 μM ROS): H2O2, t-BuOO−, OONO−, O2−, ˙OH, 1O2, ClO−; 40–45 (200 mU mL−1 enzymes): esterase, acetylcholinesterase, butyrylcholinesterase, γ-glutamyltransferase, acid phosphatase, alkaline phosphatase; and 46: (100 mU mL−1) β-gal. (d) Fluorescence spectra of SA-HCy-1 upon incubation with 100 mU mL−1 β-gal and increasing concentration of ClO− from 0 to 250 μM at 37 °C for 60 minutes in 10 mM PBS of pH 8.0. λex = 360 nm for left and λex = 600 nm for right. (e) I468nm/I713nm of SA-HCy-1 after incubation with 100 mU mL−1 β-gal and increasing concentration of ClO− from 0 to 250 μM at 37 °C for 60 minutes in 10 mM PBS of pH 8.0. (Inset) Linear relationship between I468nm/I713nm and ClO− of concentrations from 0 to 30 μM. (f) I468nm/I713nm of SA-HCy-1 after the addition of 100 mU mL−1 β-gal and various biological species. 1: blank; 2–19 (100 μM amino acid): Lys, Try, Met, Leu, Ser, His, Ary, Phe, Val, Gln, Thr, Ile, Glu, Gly, Asn, Ala, Cys, GSH; 20–28 (100 μM cations): Zn2+, Ca2+, Mg2+, Ni2+, Fe3+, Hg2+, K+, Co2+, Pb2+; 29–32 (100 μM anions): S2−, CO32−, SO42−, NO3−; 33–39 (100 μM ROS): H2O2, t-BuOO−, OONO−, O2−, ˙OH, 1O2, ClO−). | ||
To ensure adaptability to a complex physiological environment, the optical selectivity of SA-HCy-1 towards β-gal and ROS was evaluated in vitro. Selectivity for β-gal and ClO− was then estimated from the responsive fluorescence following the aforementioned operation, and amino acids (Lys, Try, Met, Leu, Ser, His, Ary, Phe, Val, Gln, Thr, Ile, Glu, Gly, Asn, Ala, Cys and GSH), cations (Zn2+, Ca2+, Mg2+, Ni2+, Fe3+, Hg2+, K+, Co2+ and Pb2+), anions (S2−, CO32−, SO42− and NO3−), ROS (H2O2, t-BuOO−, OONO−, O2−, ˙OH, 1O2 and ClO−), and bio-active enzymes (esterase, acetylcholinesterase, butyrylcholinesterase, γ-glutamyltransferase, acid phosphatase and alkaline phosphatase) were involved for this investigation. After incubation with these species, the responsive fluorescence of SA-HCy-1 was monitored respectively, and the intensity at 713 nm was displayed in Fig. 2c. Negligible response was observed in the presence of the interferents, and the red emissive HCy-OH could only be produced upon the reaction with β-gal, as evidenced by the intense response. After the reaction with β-gal, this system was further treated with these interferents, and the response was recorded as the ratiometric pattern of I468nm/I713nm shown in Fig. 2f. It was obvious that only ClO− and 1O2 could trigger the ratiometric response, and ClO− caused a response twice as strong as 1O2. Moreover, in a solution with a pH value of 7.4, only ClO− could induce the enhancement of cyan fluorescence, indicating that SA-HCy-1 has better selectivity towards ClO− in physiological environments (Fig. S11†). Therefore, receptor SA-HCy-1 was verified to possess superior selectivity for β-gal and ClO−, with the fluorescence change from NIR to cyan for indicating the reaction process.
This elaborate probe was thereby perceived to be a typical logic probe for β-gal and ROS. The determinant for this logic probe was the co-existence of two reactive species, which improved the diagnosis accuracy for cellular senescence as shown in Scheme 1. To further confirm the proposed “AND” logic sensing mechanism, high-resolution mass spectra measurements were therefore carried out. As shown in Fig. S16,† a significant signal at m/z of 398.2119 corresponding to HCy-OH (calculated value: 398.2115) was observed in the reaction of SA-HCy-1 and β-gal in PBS, which clarified the occurrence of the enzyme catalyzed reaction. Furthermore, a signal at m/z of 228.1104 corresponding to HCy-XTD (calculated value: 228.0786) appeared after ClO− was added to the mixture of SA-HCy-1 and β-gal (Fig. S17†), demonstrating the oxidation reaction of HCy-OH and ClO−.
Live cell fluorescence imaging
Encouraged by the excellent spectroscopic performance, the bio-application of this dual-responsive receptor was then investigated.38–40 Prior to this, the stability of SA-HCy-1 in different physiological environments was investigated, as shown in Fig. S18 and S19,†SA-HCy-1 was stable in PBS with pH values of 6.5 and 7.4. Furthermore, in order to investigate the application prospects of SA-HCy-1 in living cells, the stability of SA-HCy-1 in culture medium was also investigated, and it could be seen that SA-HCy-1 is relatively stable in DMEM culture medium (Fig. S20†). Then the biocompatibility of SA-HCy-1 was tested employing cell counting kit-8 (CCK-8) assay. The RAW 264.7 cell line, which was considered a typical model of cellular senescence capable of generating ROS, was applied for the cellular experiment. After incubation with SA-HCy-1 of increasing concentration from 0 to 30 μM for 12 h, the survival rate of cells exceeded 80%, according to Fig. S21.† Therefore, SA-HCy-1 was demonstrated to govern low cytotoxicity, providing a foundation for future biological applications.Doxorubicin (DOX), an anticancer drug, is known to induce senescence by damaging DNA,41 making it workable for stimulating the premature senescence of RAW 264.7 cells. The overexpression of β-gal was treated as the indicator for the degree of senescence, which was confirmed by the shades of blue upon X-gal staining, as illustrated in Fig. 3g. The normal cells were stained yellow, and those treated with DOX for 3 d were stained blue indicative of a senescence state. This was also confirmed by Sudan black B staining experiments (Fig. S22†) and qPCR results of IL-6, a kind of typical senescence-associated secretory phenotype (SASP, Fig. S23†). Furthermore, the pH value of lysosomes in RAW 264.7 cells treated with DOX for 3 d was measured to be 6.14 with the LysoSensor yellow/blue DND-160 kit, which further confirmed the high pH of lysosomes in senescence cells. The control sample showed negligible signal in the NIR and cyan channels in Fig. 3a after incubation with 10 μM SA-HCy-1, suggesting that SA-HCy-1 was silent to normal cells because of little β-gal expressed intracellularly. 1.0 μg mL−1 lipopolysaccharide (LPS) and 0.5 μg mL−1 phorbol 12-myristate 13-acetate (PMA) have been treated as a typical set of ROS stimulator,42,43 so they were employed herein to trigger the production of ROS in live cells before the incubation with SA-HCy-1. Referring to Fig. 3b, the fluorescence in both channels still remained blank, suggesting that the increase in the ROS level could hardly trigger the response mechanism. As for the cells that have been cleaned of ROS with N-acetyl-L-cysteine (NAC), a widely used reactive oxygen scavenger,44 the loss of ROS was also confirmed to make little influence to turn on the fluorescence, as evaluated by little response in both channels in Fig. 3c. The relatively weak fluorescence presented in these first 3 sets could be assigned to the lack of β-gal in normal cells, which made it unable to produce NIR-emissive HCy-OH upon the enzymatic reaction and inhibited the following ROS oxidation, as indicated by the low quantitative intensity in Fig. 3h and the total value in Fig. 3j. The ratio profile of Icyan/INIR for these 3 group samples remained at around 1.0, which could be rationalized by the low reaction efficiency.
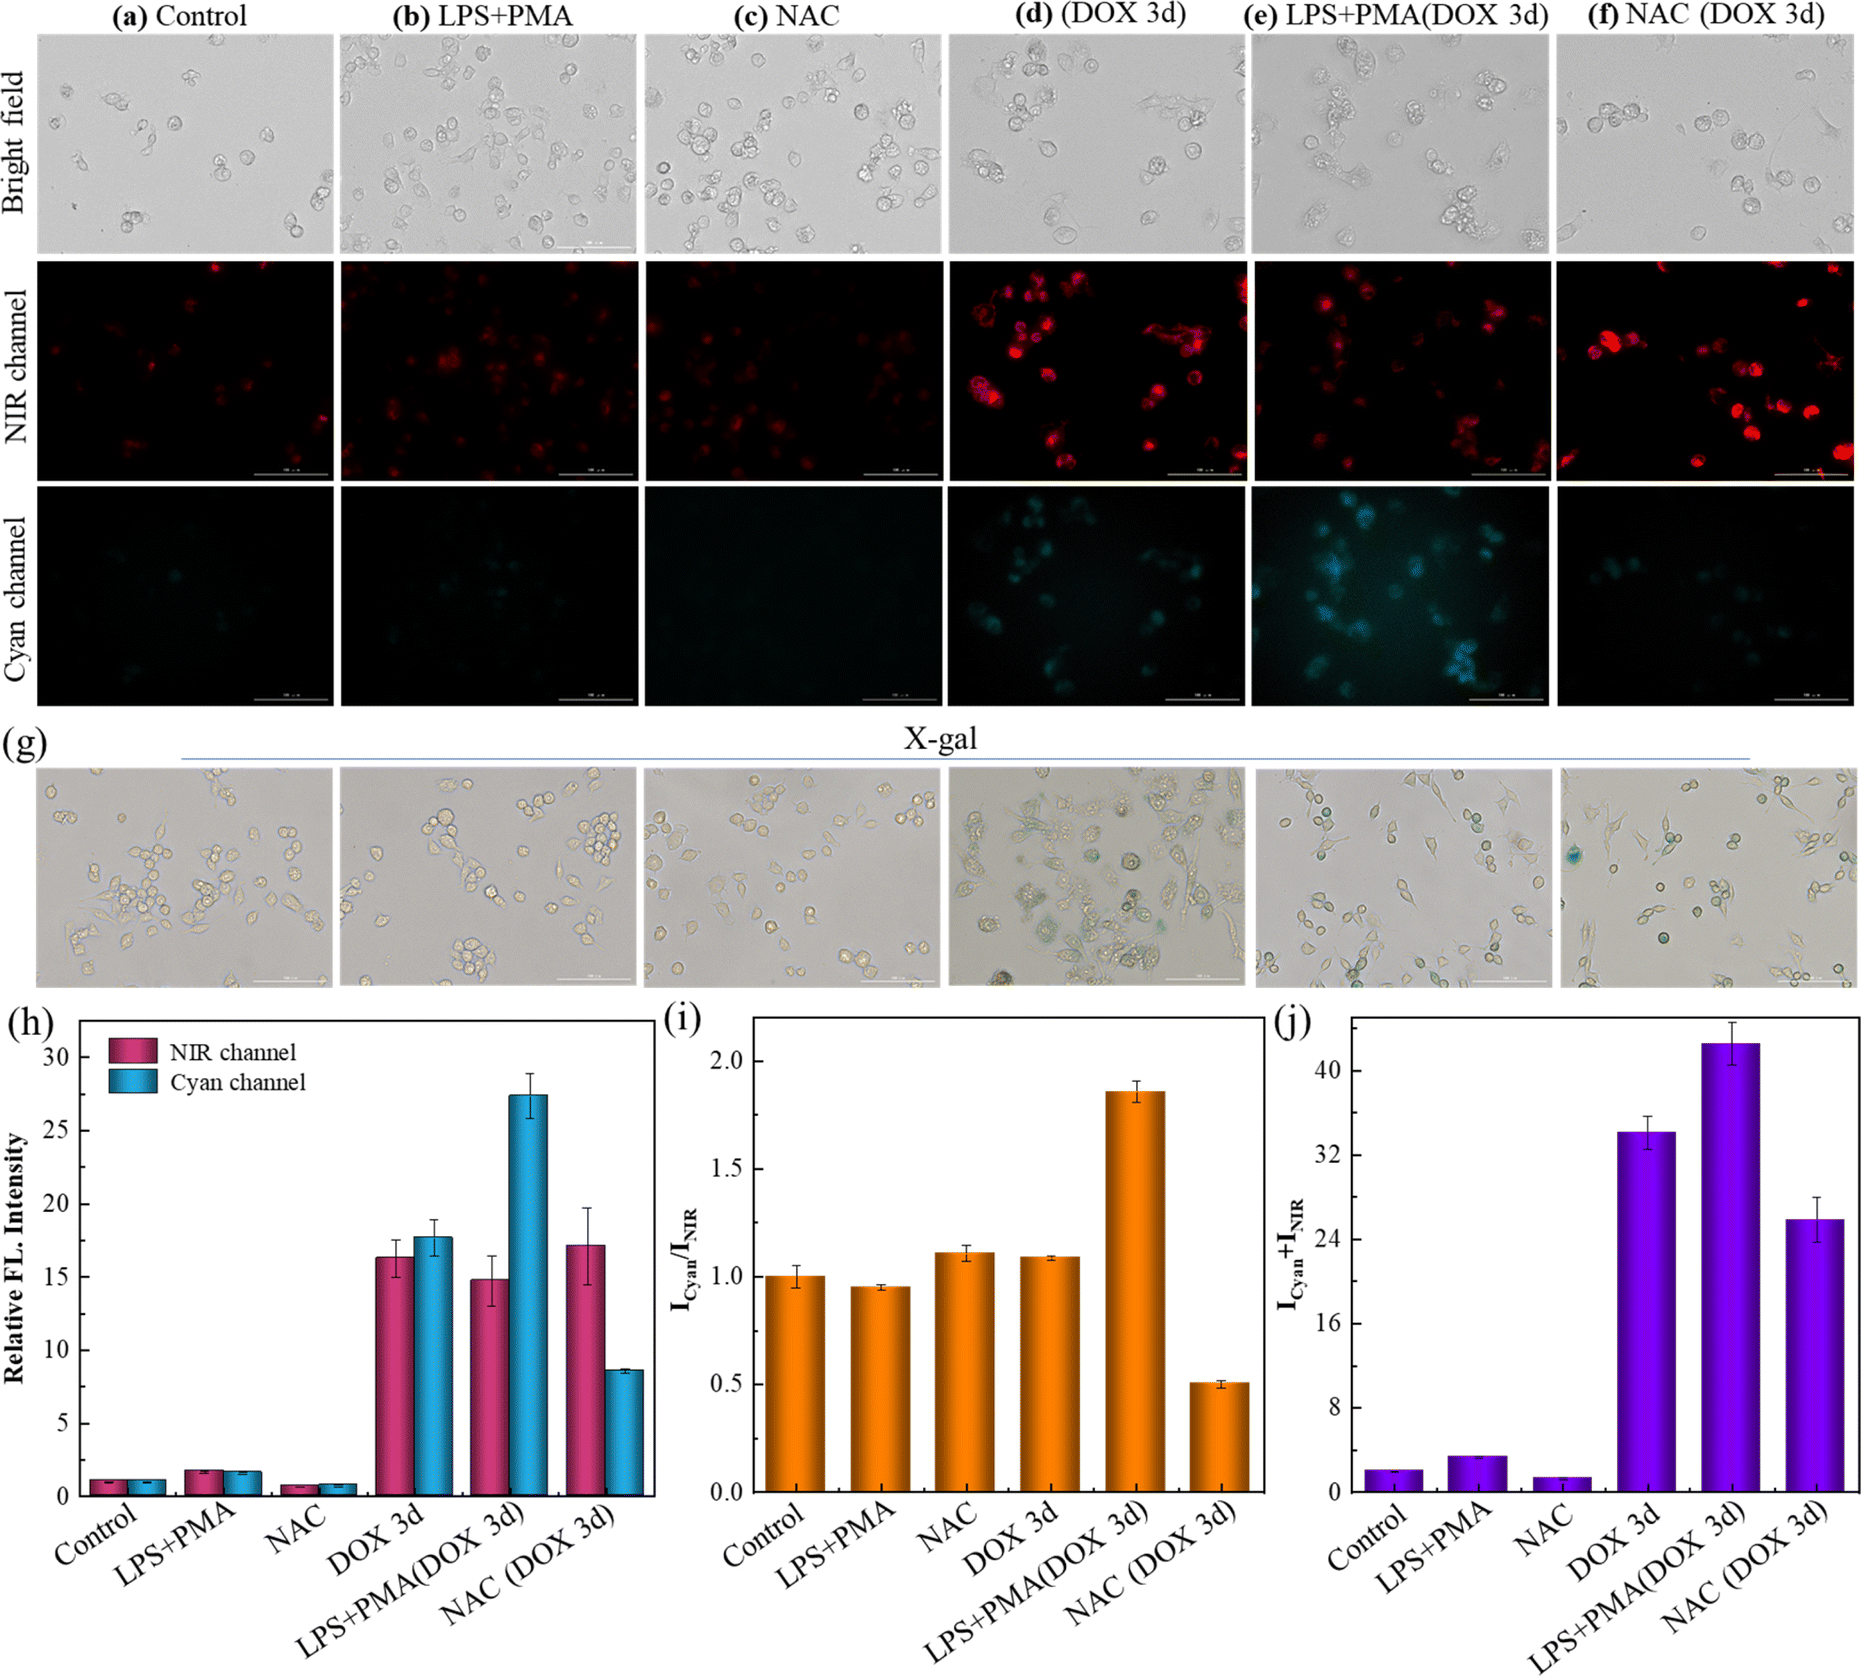 | ||
| Fig. 3 (a–f) Fluorescent images of RAW 264.7 cells after incubation with 10 μM SA-HCy-1. (a) The control group (normal RAW 264.7 cells); (b) the cells were pretreated with LPS (1.0 μg mL−1) and PMA (0.5 μg mL−1) for 60 min; (c) the cells were pretreated with NAC (10 mM) for 60 min; (d) the cells were pretreated with DOX (0.1 μM) for 3 days; (e) the cells were pretreated with 0.1 μM DOX for 3 days and then treated with LPS (1.0 μg mL−1) and PMA (0.5 μg mL−1) for 60 min. (f) The cells were pretreated with 0.1 μM DOX for 3 days and then treated with NAC (10 mM) for 60 min. Top: bright field; middle: NIR channel: ground: cyan channel. For the NIR channel: λex = 628 nm, λem = 670–730 nm; for the cyan channel: λex = 377 nm, λem = 450–500 nm, scale bar = 100 μm. (g) X-gal staining of RAW 264.7 cells with different treatments of (a–f). (h) Relative fluorescence intensities of (a)–(f) from NIR (red bars) and cyan (blue bars) channels. (i) Quantification of fluorescence intensity ratios (Icyan/INIR) of the images from (a)–(f). (j) Quantification of fluorescence intensity sums (Icyan + INIR) of the images from (a) to (f). Error bars represent the standard deviation (±S.D.), n = 3. | ||
When the cellular state was changed by treatment with DOX for 3 days to induce cell senescence, a bright NIR fluorescence could be captured in Fig. 3d, arising from HCy-OH generated upon the enzymatic reaction with β-gal in senescent cells. A response in the cyan emissive window was also available, which was attributed to HCy-XTD produced by ROS oxidation. The great enhancement in fluorescence intensity could be further quantified in Fig. 3h and j. While the DOX-induced senescence cells were treated with D-galactose (which can compete with SA-HCy-1 in living cells), the fluorescence emission of both NIR and cyan channels was weakened (Fig. S24†). This further confirmed that NIR and cyan fluorescence of SA-HCy-1 were logically regulated by β-gal and ROS in senescence cells. In order to illustrate the relativity, the ROS level was then controlled by exogenous addition (HClO), endogenous induction (LPS + PMA), and reactive oxygen species scavengers (NAC) respectively. After incubation with 0.1 μM DOX for 3 days, the addition of HClO could lead to a decrease in NIR fluorescence and an enhancement of emission in the cyan channel (Fig. S25†). When the senescence cells were treated with 1.0 μg mL−1 LPS and 0.5 μg mL−1 PMA for another 60 minutes to induce more endogenous ROS expression. As observed in Fig. 3e, there was a decrease in the NIR fluorescence, along with an obvious growth in the cyan channel, which could be rationalized by the improved ROS oxidation efficiency by the ROS stimulator. It was also observed in the quantitative profile in Fig. 3h with an enhanced ratio over 50% exhibited in Fig. 3i. When the ROS level was reduced by the introduction of NAC, the NIR emission gained an abrupt enhancement and negligible fluorescence could be captured in the cyan window, as shown in Fig. 3f and h. The concentrated NIR-emissive HCy-OH was barely oxidized into cyan-emissive HCy-XTD, because of the clearing effect of NAC, leading to a decreased ratio by ∼50% compared with the control sample. The total intensity in Fig. 3j was closely related to the receptor concentration, β-gal level and senescence degree, which was at a similar intensity level (with an enhancement below 30%) for samples d and e accounting for the treatment with β-gal of the same concentration. As observed in Fig. 3b and e, this “AND”-logic receptor obeyed a strict reaction order of β-gal catalysis and ROS oxidation, avoiding response to non-senescent cells under oxidative stress. Therefore, the elaborate receptor SA-HCy-1 was verified to be workable for visualizing cellular senescence in dual channels with considerable accuracy.
In order to evaluate the generality of this sensing strategy, a type of tumor cell line, B16 cells were then employed. The cells treated with 0.1 μM DOX for 2 d were stained blue with X-gal, and the control sample was yellow, as exhibited in Fig. S26,† suggesting that the senescence state of B16 could be triggered by DOX. Fluorescence could be hardly monitored in NIR and cyan emissive channels for the control sample after incubation with 10 μM SA-HCy-1 in Fig. S26a,† because of the low-expressed β-gal and ROS in normal cells. The response in both channels was relatively strong with an enhancement of ca. 13-fold for cells pretreated with DOX, as shown in Fig. S26b and c,† signaling cellular senescence induced by DOX with Icyan/INIR increasing from ∼0.7 to ∼0.85. Therefore, SA-HCy-1 was affirmed to be capable of staining senescent cells in dual channels selectively with broad application scope.
To verify the discriminative ability of the proposed probe SA-HCy-1 against senescence cells and tumor cells, especially for ovarian cancer cells, co-localization experiments were therefore conducted. As displayed in Fig. 4, the senescence RAW 264.7 cells (pre-incubated with 0.1 μM DOX for 3 days) and Caov-3 cells were co-incubated with 100 nM Lyso-Tracker Green (a commercial lysosomal localization dye) or Mito-Tracker Green (a commercial mitochondria localization dye) and 10 μM SA-HCy-1 for 30 minutes. After overlapping the NIR emission from SA-HCy-1 with the green emission from Lyso-Tracker green or Mito-Tracker green, Pearson's co-localization coefficients were calculated to be 0.91 and 0.68, respectively for senescence cells, indicating that SA-β-gal activity mainly occurred in lysosomal compartments (Fig. 4a and b). For the co-localization experiments of Caov-3 cells, the two Pearson's co-localization coefficients were 0.73 and 0.94 (Fig. 4c and d), respectively, which was mainly due to the presence of β-gal in different locations in Caov-3 cancer cells. These co-localization results indicated that the NIR emission of SA-HCy-1 could be specifically lighted up by lysosomal β-gal in senescence cells and mitochondrial β-gal in Caov-3 cells. The difference in fluorescence imaging of β-gal positions provides an effective basis for distinguishing senescence cells from Caov-3 cancer cells.
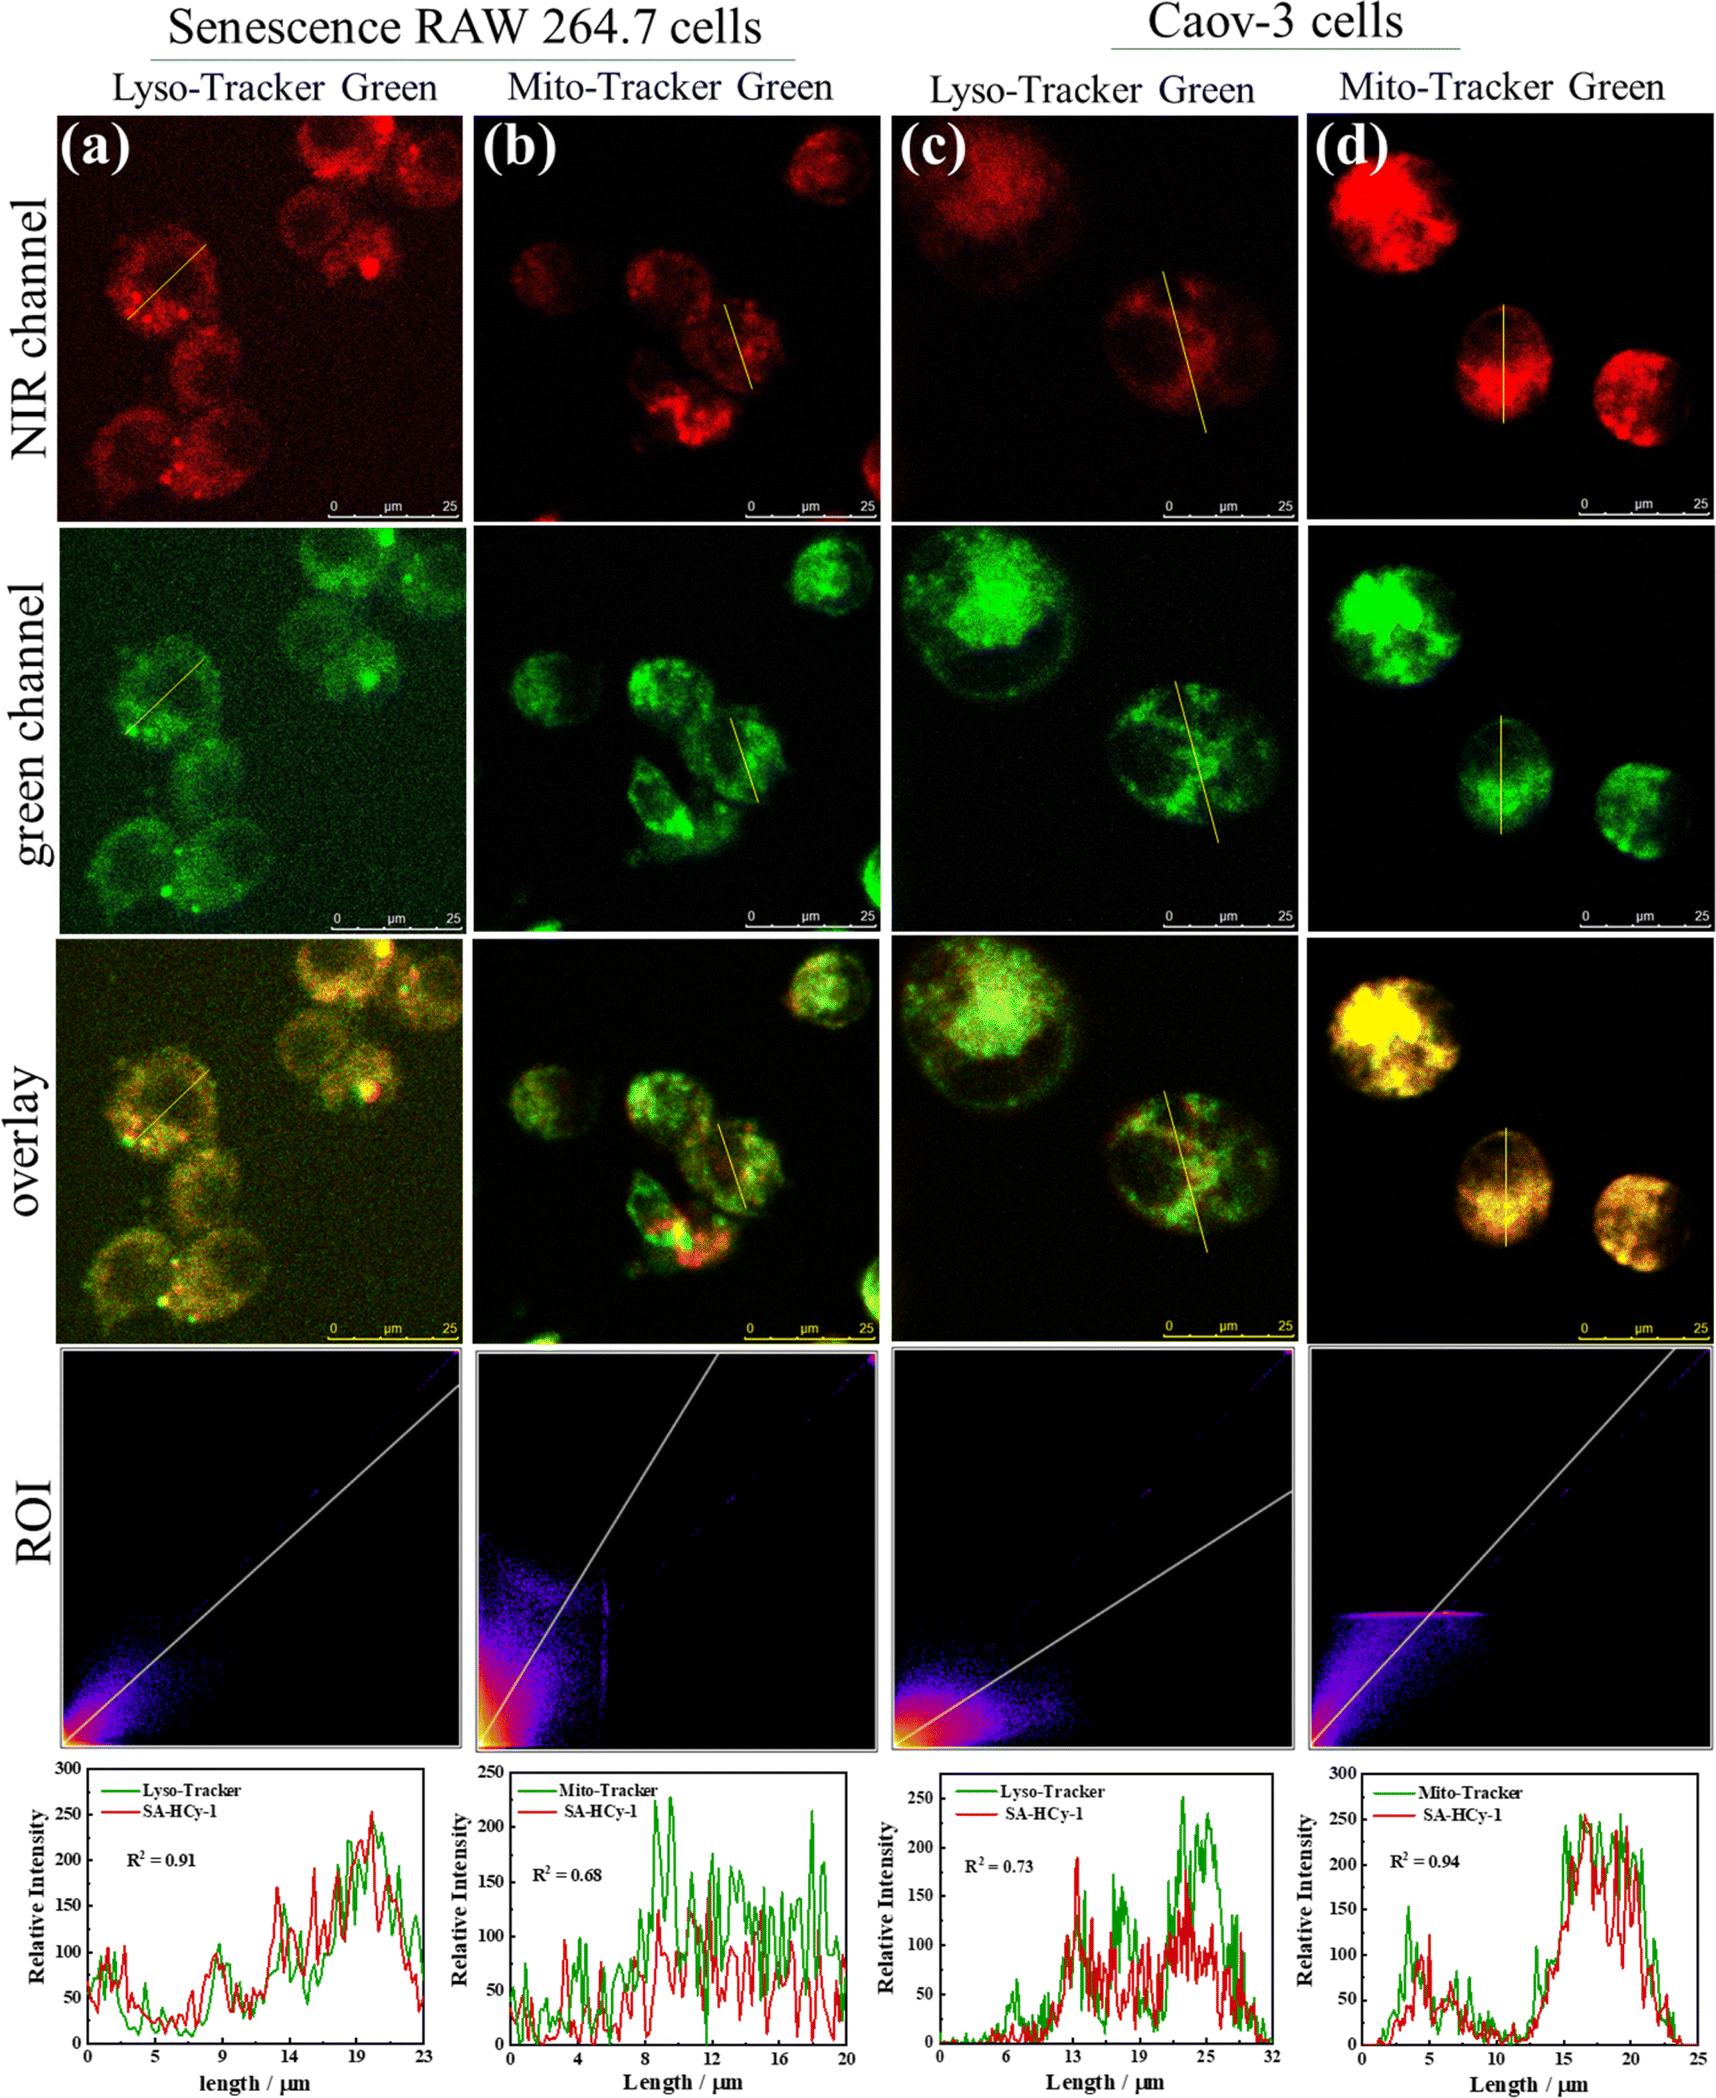 | ||
| Fig. 4 Fluorescence co-localization images of senescence RAW 264.7 cells (a and b) and Caov-3 cells (c and d). The cells were co-incubated 100 nM Lyso-Tracker Green (a and c) or Mito-Tracker Green (b and d) and 10 μM SA-HCy-1 for 30 minutes. RAW 264.7 cells were pretreated with 0.1 μM DOX for 3 days. For the NIR channel: λex = 628 nm, λem = 670–730 nm; for the green channel: λex = 488 nm, λem = 500–540 nm, scale bar = 25 μm. | ||
In addition to the DOX-triggered senescence imaging, this protocol was further applied for tracking the natural senescence process by staining cells with receptor SA-HCy-1, and X-gal was employed for verification and comparison, as exhibited in Fig. 5a and b. RAW 264.7 cells were cultured from passage 2 (P2) to passage 13 (P13) to obtain replicative senescent cells at different stages, and fluorescence was taken in NIR and cyan windows respectively after incubation with 10 μM SA-HCy-1. There displayed negligible fluorescence in dual channels, and cells were stained yellow by X-gal, suggesting that cells at P2 were quite energetic. A constant growth in the responsive fluorescence upon passages could be observed, especially from the quantified intensity represented in the form of summation in Fig. 5e, which could be rationalized by the continuous accumulation of β-gal and ROS during senescence. A significant enhancement in NIR fluorescence could be captured at P5 arising from HCy-OH produced by β-gal catalysis, and the cyan emission was available at P7 generated by ROS oxidation, according to Fig. 5a–c, indicative of cellular senescence at an early stage. It is noteworthy that cells remained yellow till P9, whereas the responsive fluorescence was relatively strong at this stage, as shown in Fig. 5c and e. Therefore, SA-HCy-1 was clarified to be capable of tracking early cellular senescence by dual fluorescence imaging, which improved the sensitivity and accuracy to a large extent, demonstrating a better performance than the commercial reagent X-gal with earlier indication for cellular senescence.
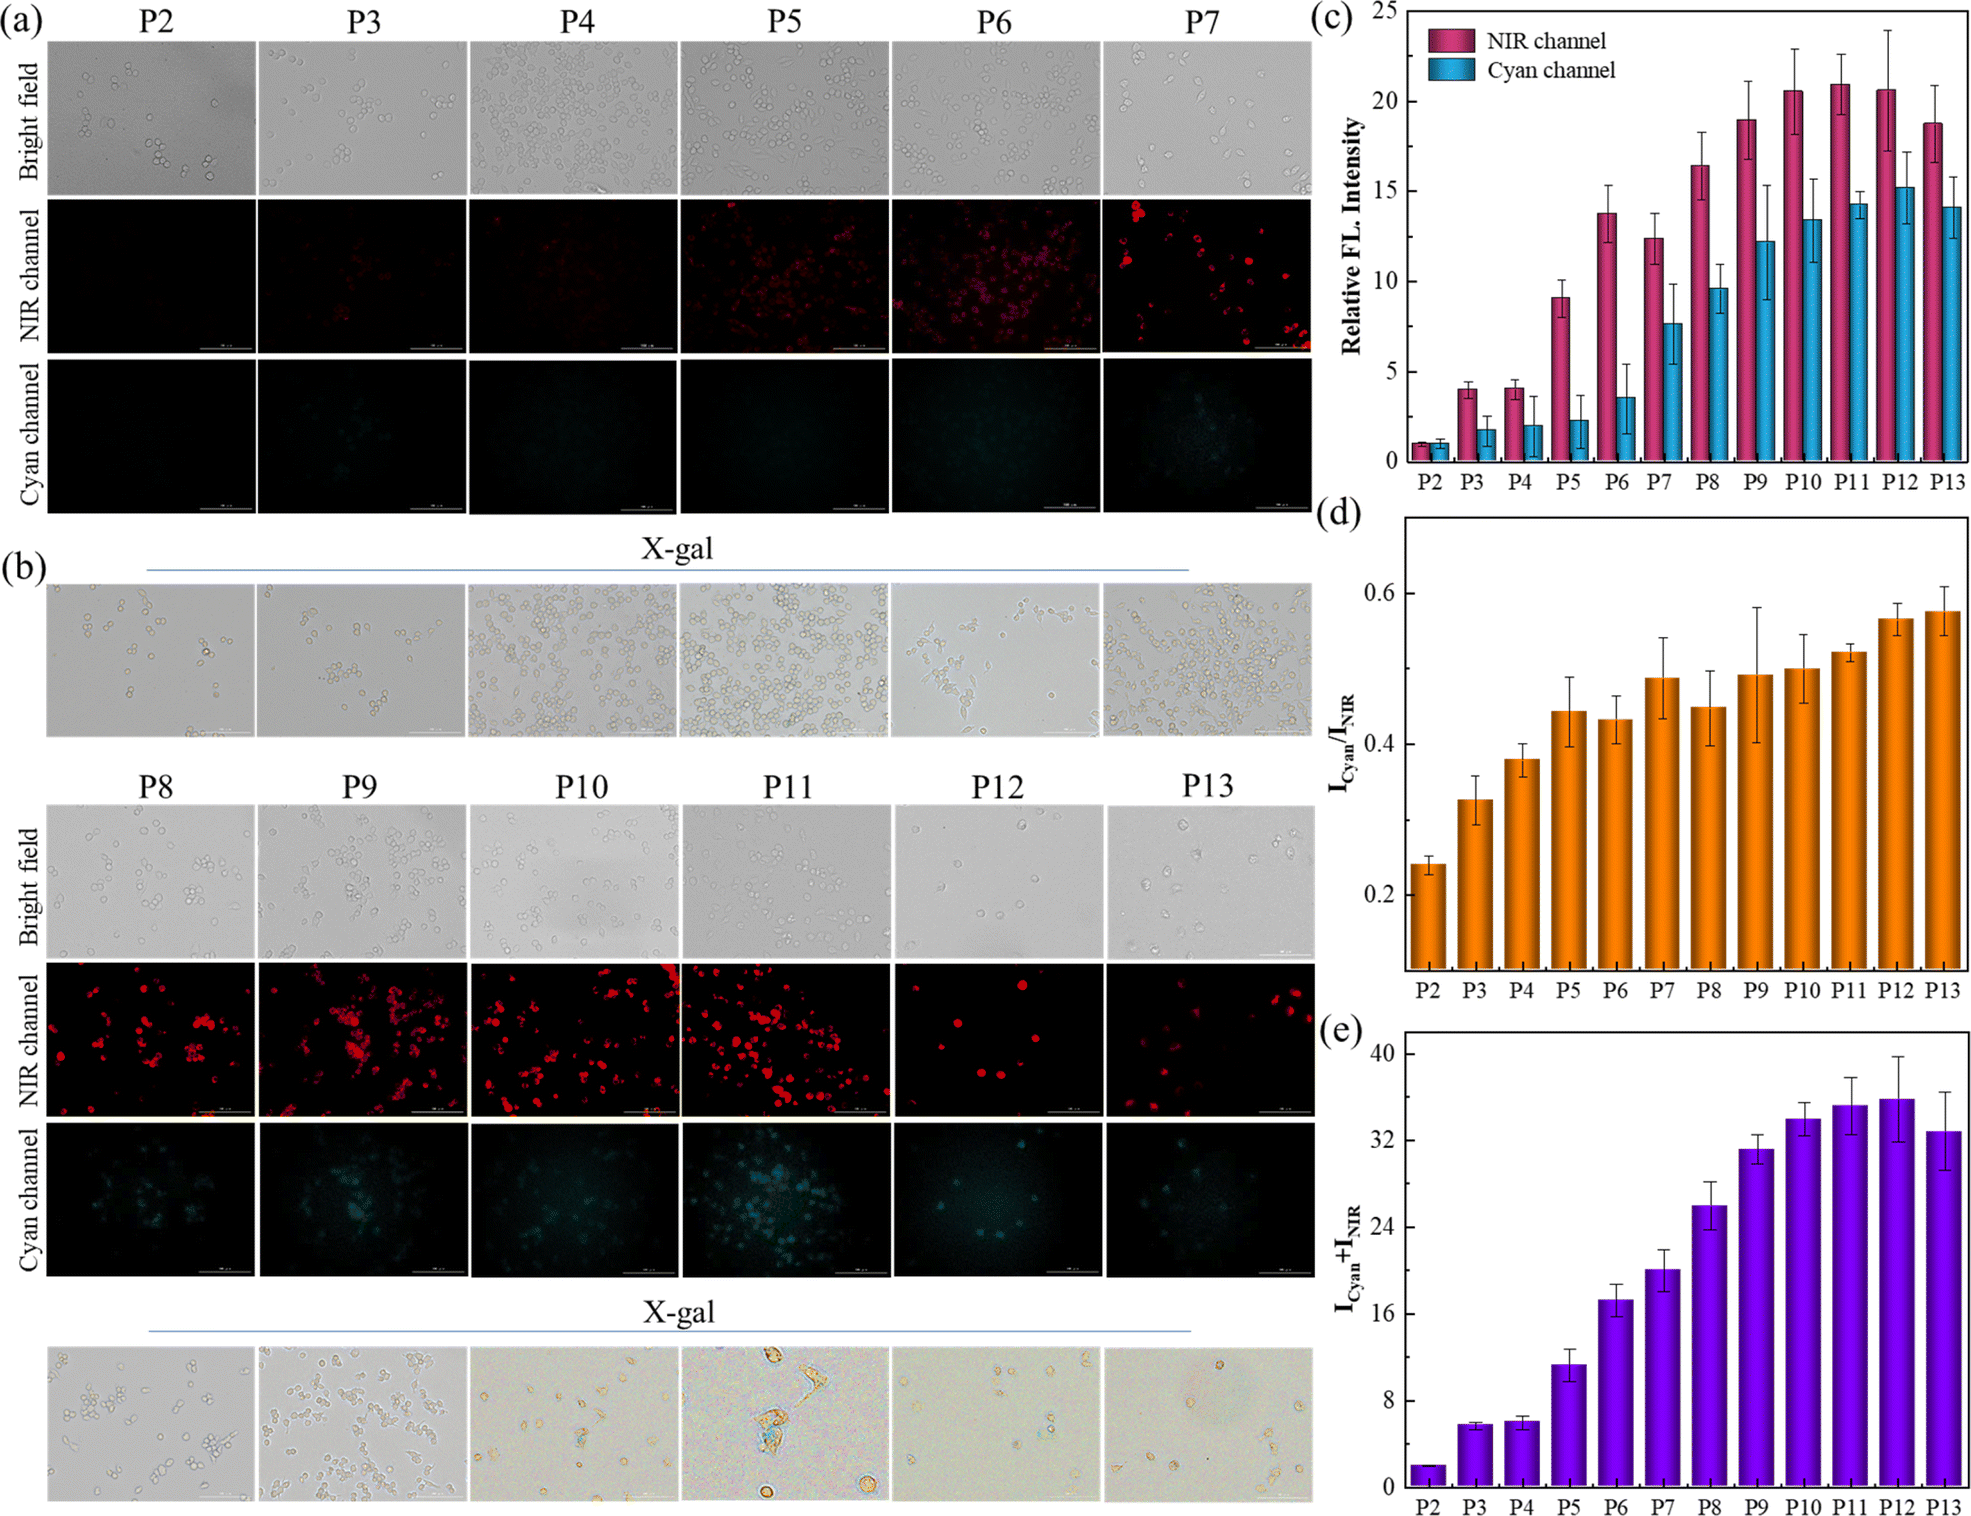 | ||
| Fig. 5 (a) Fluorescent images of RAW 264.7 cells from P2 to P13 after incubation with 10 μM SA-HCy-1 for 30 min. Top: bright field; middle: NIR channel: ground: cyan channel. For the NIR channel: λex = 628 nm, λem = 670–730 nm; for the cyan channel: λex = 377 nm, λem = 450–500 nm, scale bar = 100 μm. (b) X-gal staining of RAW 264.7 cells from P2 to P13. (c) Quantification of fluorescence intensities of (a) from NIR (red bars) and cyan (blue bars) channels. (d) Quantification of fluorescence intensity ratios (Icyan/INIR) of the images from (a). (e) Quantification of fluorescence intensity sums (Icyan + INIR) of the images from (a). Error bars represent the standard deviation (±S.D.), n = 3. | ||
Azithromycin and vitamin E (VE) are known anti-aging drugs. The former could effectively eliminate senescent cells, and VE was capable of delaying the senescent process by removing radicals.45,46 The efficiency of these drugs was tried to be evaluated by SA-HCy-1 imaging in this work. The induced senescence degree of RAW 264.7 cells was controlled using the DOX incubation time ranging from 1 to 3 days before treatment with receptor SA-HCy-1, and X-gal was introduced to confirm the cellular status. After incubation with DOX for 1 day, the cells were found to become round, which continued to shrink in future 3 days, as displayed in Fig. 6g. An increase in the responsive fluorescence in both channels could be visualized upon the DOX incubation period, as exhibited in Fig. 6a–d and the quantified profiles in Fig. 6h and j, implying a gradual senescence process upon treatment with DOX, which was in accord with the deepening blue stained by X-gal in Fig. 6g. After treatment with azithromycin and VE, senescent cells induced by DOX displayed in Fig. 6e–f were barely monitored, which could be confirmed by the negligible fluorescence response indicating little SA-β-gal or ROS expression intracellularly. An obvious reduction of over 90% in the quantified intensity depicted in Fig. 6h and j further supported this conclusion. Accordingly, these cells were stained yellow by X-gal in Fig. 6g, suggesting a good cell state upon treatment with anti-aging drugs. Therefore, this multi-dimensional probe was believed to be a promising tool to evaluate the efficacy of these types of drugs with excellent sensitivity and feasibility.
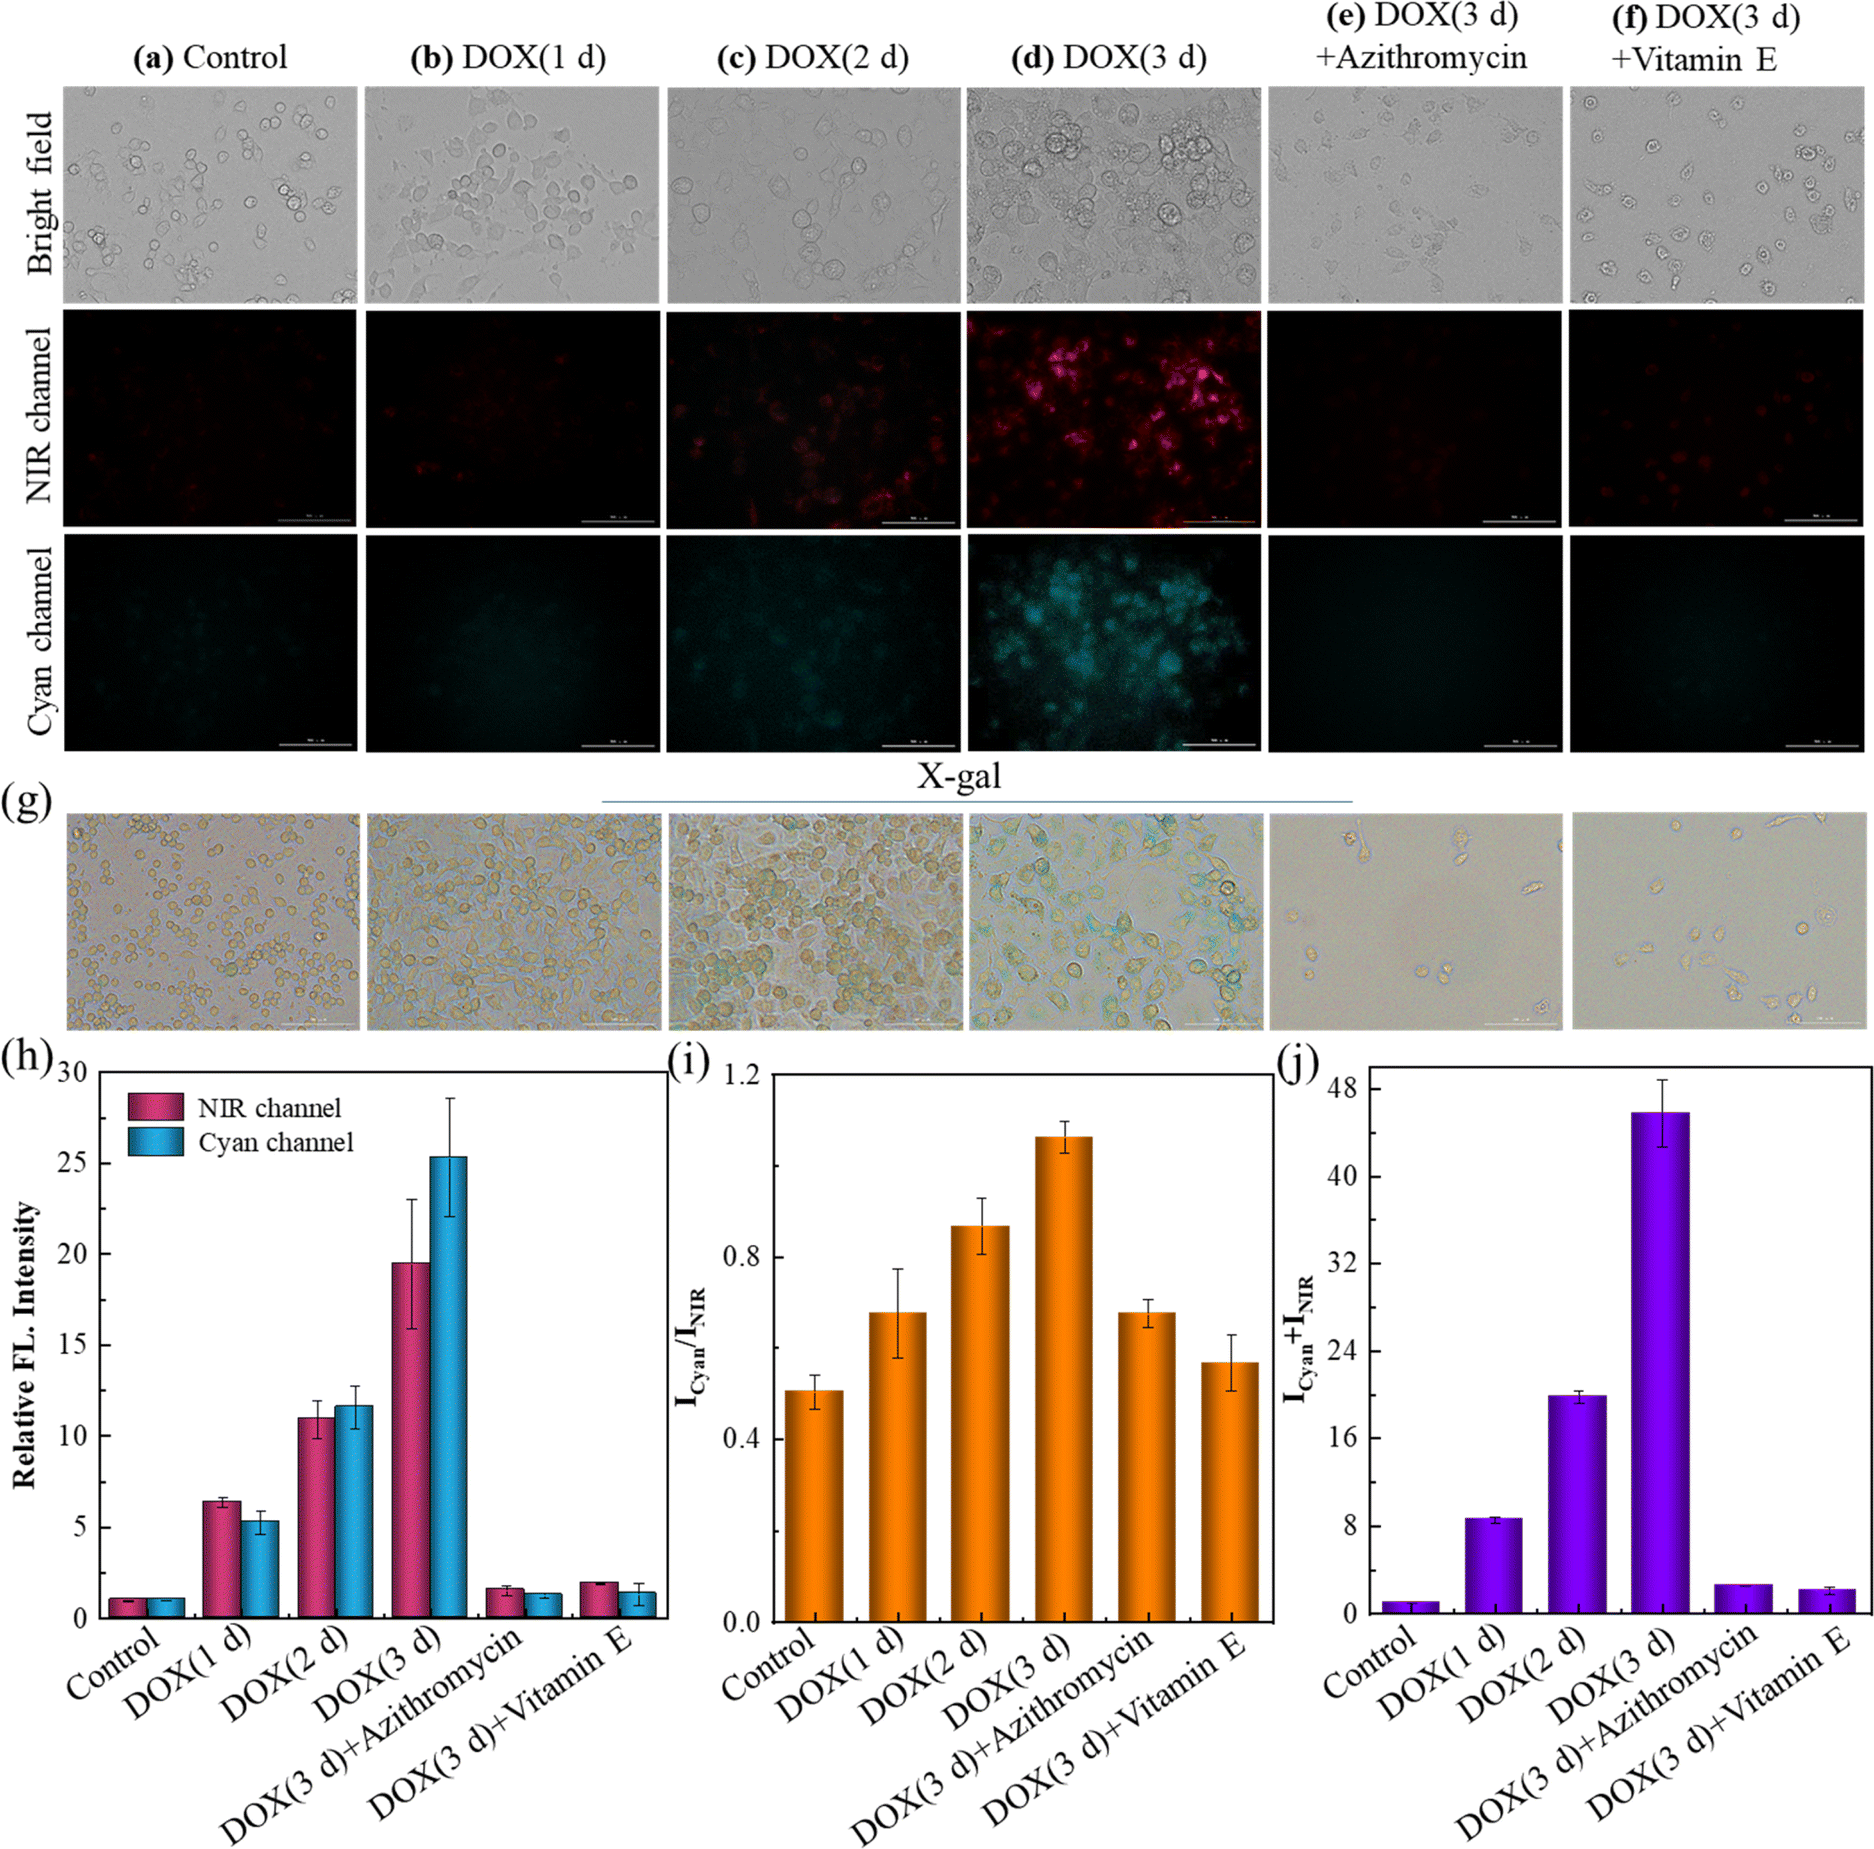 | ||
| Fig. 6 (a–f) Fluorescent images of RAW 264.7 cells after incubation with 10 μM SA-HCy-1. (a) The control group (normal RAW 264.7 cells); (b–d) the cells were pretreated with 0.1 μM DOX for 1, 2 and 3 days. (e) The cells were pretreated with 0.1 μM DOX for 3 d and then treated with 100 μM azithromycin for 60 min. (f) The cells were pretreated with 0.1 μM DOX for 3 d and then treated with 100 μM vitamin E for 60 min. Top: bright field; middle: NIR channel: ground: cyan channel. For the NIR channel: λex = 628 nm, λem = 670–730 nm; for the cyan channel: λex = 377 nm, λem = 450–500 nm, scale bar = 100 μm. (g) X-gal staining of RAW 264.7 cells, the treatments of the cells corresponded to (a)–(f). (h) Quantification of the fluorescence intensities from the images in (a)–(f) for NIR (red bars) and cyan (blue bars) channels. (i) Quantification of fluorescence intensity ratios (Icyan/INIR) of the images from (a) to (f). (j) Quantification of fluorescence intensity sums (Icyan + INIR) of the images from (a) to (f). Error bars represent the standard deviation (±S.D.), n = 3. | ||
Fluorescence imaging of UV-induced skin photoaging
Encouraged by the excellent performance in cellular imaging, further application for evaluating the skin senescence was investigated on the mice model of skin photoaging. Excessive ROS in skin tissues could be produced upon oxidative stress under long term ultraviolet (UV) light irradiation of high intensity, which caused considerable damage to the integrity of cell membranes and the intracellular antioxidant system, leading to pathological changes such as inflammatory factor infiltration and apoptosis.47 Therefore, photoaging damage, such as skin redness, pigmentation and even skin tumors, could be caused by severe UV exposure.48Isoflavone, a member of the flavonoid group with a similar molecular structure to that of human estrogen,49 has been found to be capable of reducing UV-induced photodamage and further preventing skin ageing.50 During the experiment for skin senescence evaluation, the mice were coated with 3% isoflavone and sesame oil, a pure substrate as control, on each side of the bare back respectively, as indicated in Fig. 7a. The mice were exposed to irradiation under an ultraviolet lamp of 365 nm for 20, 40 and 60 minutes per irradiation (from Monday to Friday) from week 1 to week 3, and 80 min per irradiation from week 4 and week 5, for a total of 5 weeks. The weekly dual-channel fluorescence imaging was recorded 5 weeks after in situ treatment with receptor SA-HCy-1 for 30 minutes, as depicted in Fig. 7b and c.
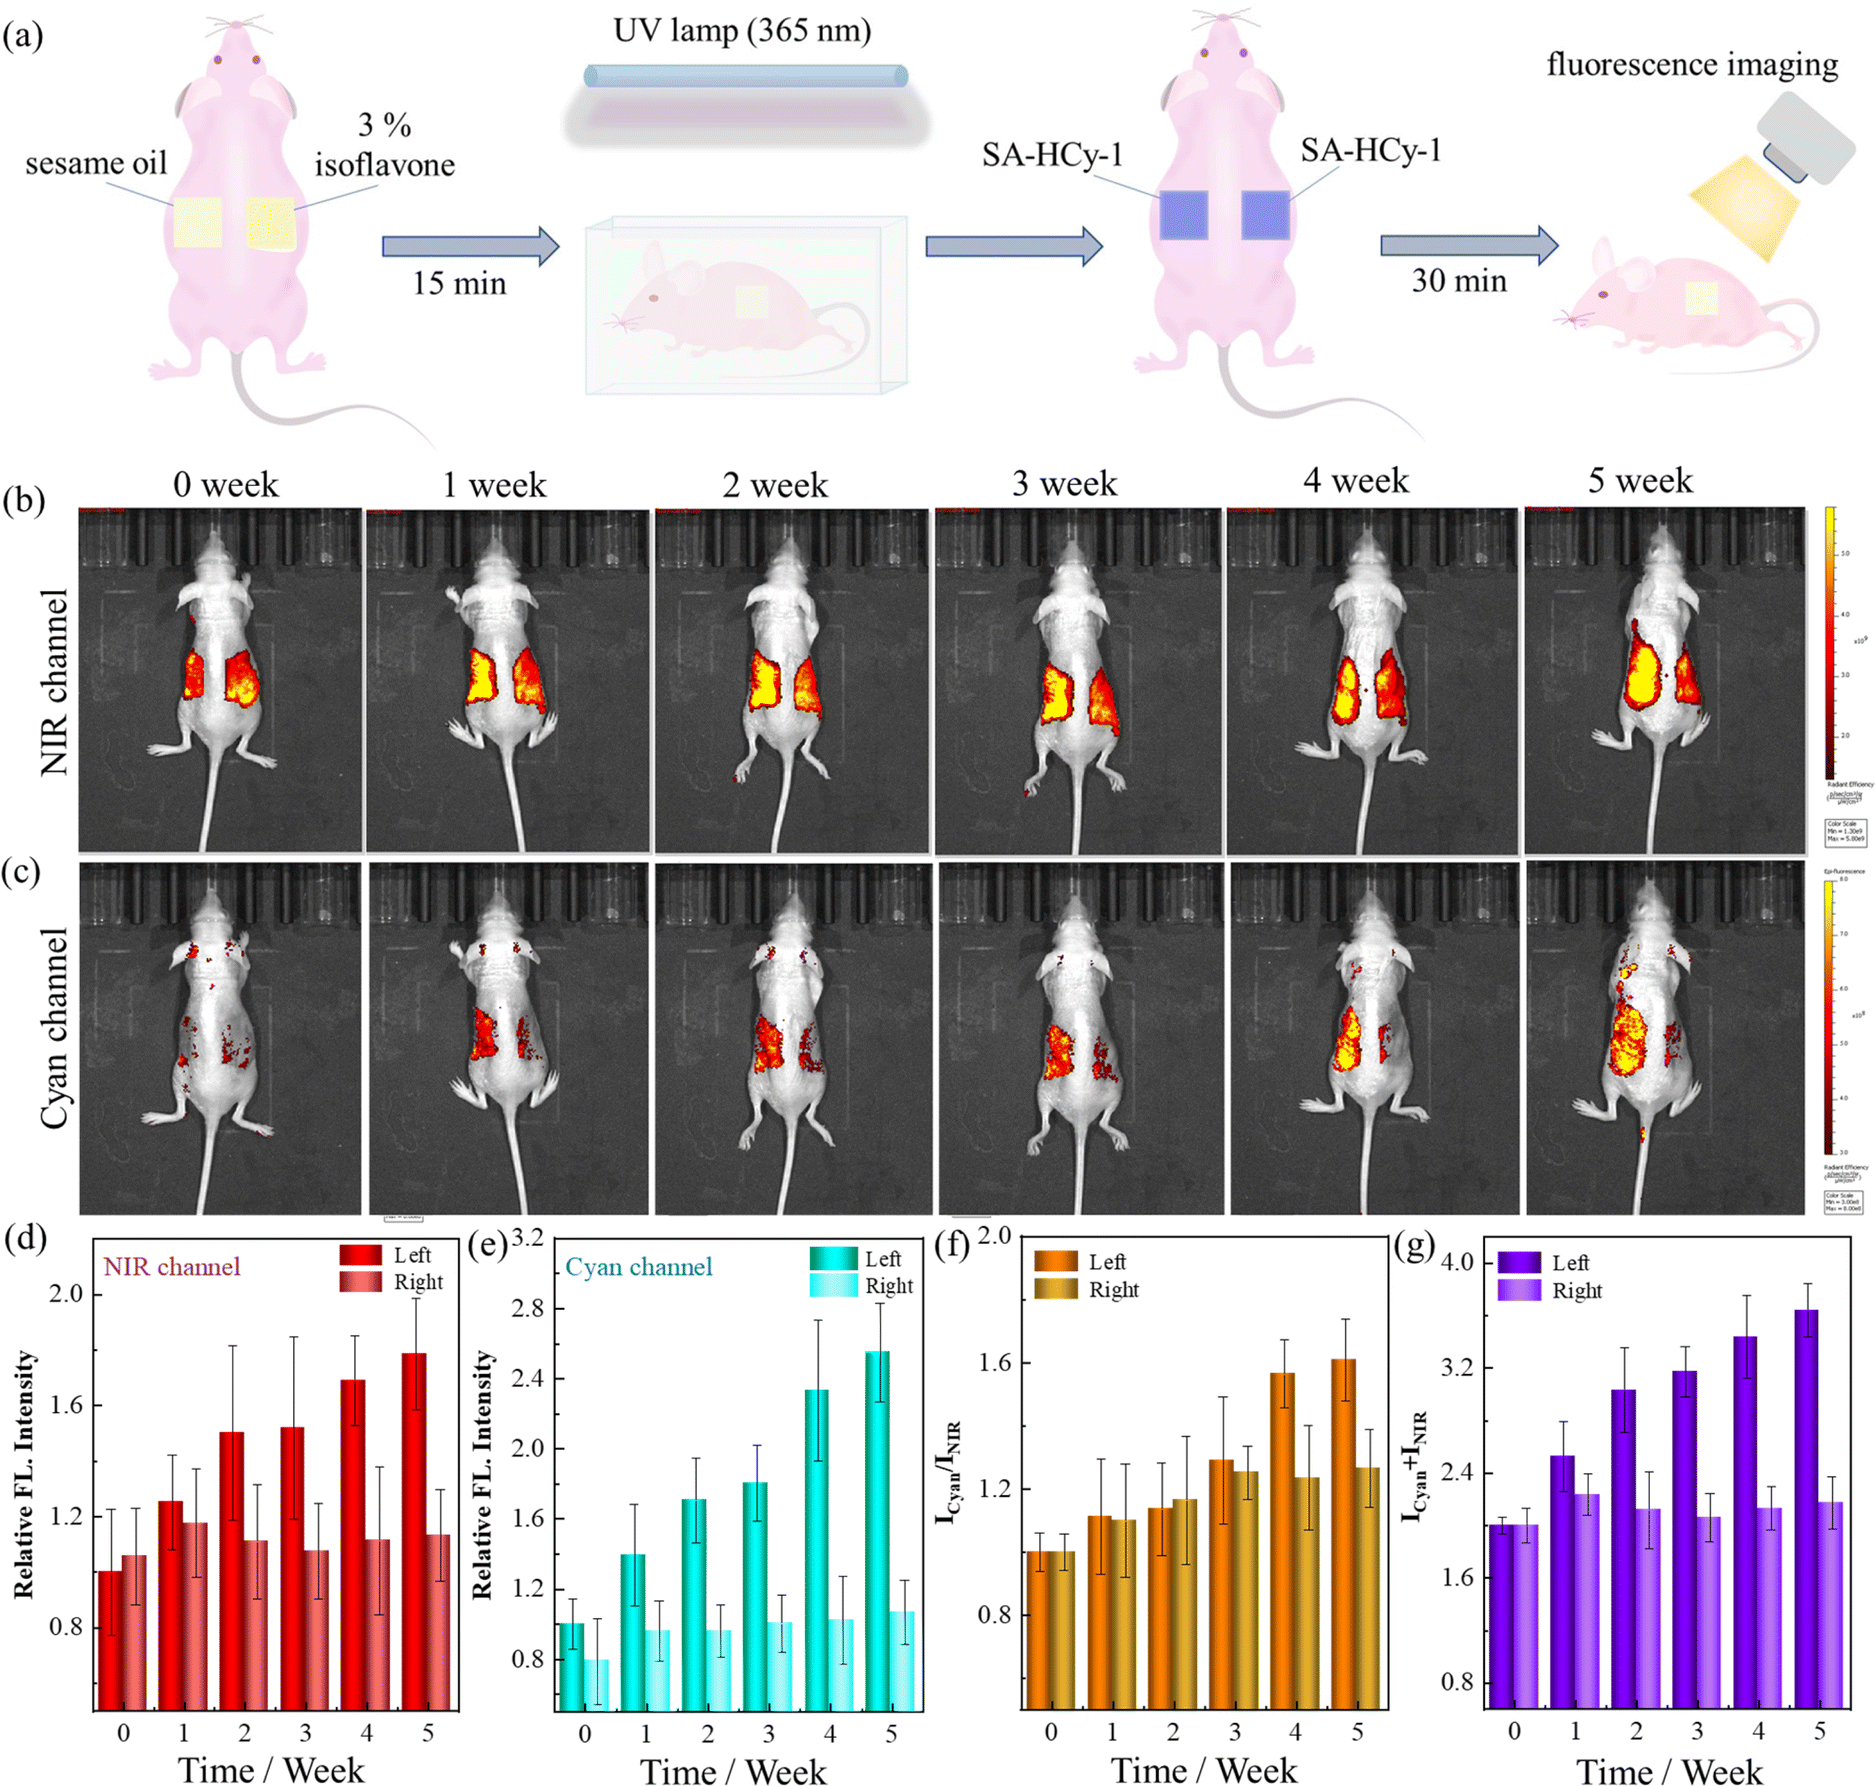 | ||
| Fig. 7 (a) Schematic illustration of the ultraviolet light-induced skin photoaging mice model and the application of SA-HCy-1 for skin photoaging imaging. (b and c) Fluorescence imaging of the mice model of ultraviolet light-induced skin photodamage from 0 to 5 weeks. For the NIR channel (b): λex = 600 nm; λem = 710 nm; for the cyan channel (c): λex = 420 nm; λem = 480 nm. (c and d) Quantification of skin fluorescence intensities from NIR (d) and cyan (e) channels of the left and right sides of the mice. (f) Quantification of skin fluorescence intensity ratios (Icyan/INIR) from the left and right sides of the mice. (g) Quantification of skin fluorescence intensity sums (Icyan + INIR) from the left and right sides of the mice. | ||
There displayed a constant increase of over 80% in 5 weeks in the responsive fluorescence in both channels upon the irradiation operation on the left back, which was quantified in Fig. 7d, e and g. This suggested SA-β-gal and ROS of increasing content during the irradiation, which triggered skin photoaging featuring overexpressed SA-β-gal and ROS. The photoaging of the skin of the mice was also confirmed by X-gal staining of the skin tissues (Fig. S27†). Receptor SA-HCy-1 was hence demonstrated to be capable of indicating SA-β-gal and ROS through the NIR and cyan channels respectively, and the aging development could be evaluated reasonably at the organism level, referring to the ratiometric profile in Fig. 7f. Accordingly, the fluorescence intensity on the right back in both channels remained at the same level with an increase within 20% during the experiment, which could be rationalized by the protection by the coating with isoflavone, preventing the skin from UV-induced photoaging. Therefore, the elaborate probe SA-HCy-1 could work as a promising tool for the evaluation of skin aging and anti-aging efficiency of relevant reagents.
Conclusions
In summary, a novel triple-dimensional fluorescent probe SA-HCy-1 has been constructed to accurately track senescence and evaluate the effects of anti-aging drugs by simultaneously analyzing ROS, SA-β-gal activity, and the local microenvironment. Upon incubation with β-gal, the pyranogalactoside group in the structure of SA-HCy-1 was cleaved. After the removal of the galactose residue, SA-HCy-1 formed a phenolic intermediate and spontaneously undergoes 1,6-elimination of 4-hydroxybenzyl to generate a NIR emissive fluorophore HCy-OH. It has been proven that this elimination was pH dependent and could be particularly accelerated under high lysosomal pH conditions (with a pH value above 6.0). Subsequently, the reaction with ROS (ClO− or 1O2) led to the oxidative cleavage of the olefin linker of HCy-OH, generating the xanthine derivative HCy-XTD with cyan emission (468 nm). This huge spectral shift enabled a excellent detection scheme for ROS in a ratiometric pattern. Based on the spectral changes induced by the three dimensions of biomarkers mentioned above, we believe that the senescence degree could be indicated by the NIR and cyan fluorescence, giving rise to a ratiometric assay with satisfactory accuracy, which is available at cellular and organism levels. It is noteworthy that this elaborate receptor exhibited a better performance in monitoring cellular senescence than the well-developed commercial X-gal reagent. Moreover, its great potential in evaluating UV-induced skin-photoaging and anti-aging reagents has been confirmed by in vivo experiments.Data availability
All data supporting this study are available from article and ESI.†Author contributions
Haihong Liu and Ruidian Lv conducted the synthesis, spectral analysis and biological imaging. Fuxiang Song and Yaqun Yang assisted in the synthesis and spectral analysis. Fei Zhang and Liantao Xin assisted in the analysis. Qian Zhang wrote the manuscript. Peng Zhang and Caifeng Ding designed the project, analyzed the data, and revised the manuscript.Conflicts of interest
There are no conflicts to declare.Acknowledgements
We acknowledge the support from the National Natural Science Foundation of China (No. 22004078, 22074074 and 21904077), Youth Innovation Team Development Program of Shandong Higher Education Institutions (No. 2022KJC004), Natural Science Foundation of Shandong Province (No. ZR2020MB065), Natural Science Foundation of Qingdao (No. 23-2-1-175-zyyd-jch), and the National Training Programs of Innovation and Entrepreneurship for Undergraduates (202310426108). The animal procedures were carried out in accordance with the guidelines for the care and use of Laboratory Animals of Qingdao University of Science and Technology.Notes and references
- L. Partridge, J. Deelen and P. E. Slagboom, Nature, 2018, 561(7721), 45–56 CrossRef CAS PubMed.
- C. Lopez-Otin, M. A. Blasco, L. Partridge, M. Serrano and G. Kroemer, Cell, 2013, 153(6), 1194–1217 CrossRef CAS PubMed.
- Z. Wang, D. Wei and H. Xiao, Methods Mol. Biol., 2013, 1048, 135–144 CrossRef CAS PubMed.
- W. Chen, H. Liu, F. Song, L. Xin, Q. Zhang, P. Zhang and C. Ding, Anal. Chem., 2023, 95, 1301–1308 CAS.
- P. Zhang, C. Fu, H. Liu, X. Guo, Q. Zhang, J. Gao, W. Chen, W. Yuan and C. Ding, Anal. Chem., 2021, 93, 11337–11345 CrossRef CAS PubMed.
- P. Wei, L. Liu, W. Yuan, J. Yang, R. Li and T. Yi, Sci. China Chem., 2020, 63, 1153–1158 CrossRef CAS.
- T. Tchkonia, D. E. Morbeck, T. Von Zglinicki, J. Van Deursen, J. Lustgarten, H. Scrable, S. Khosla, D. Jensen and M. J. L. Kirkland, Aging Cell, 2010, 9(5), 667–684 CrossRef CAS PubMed.
- D. Munoz-Espin and M. Serrano, Nat. Rev. Mol. Cell Biol., 2014, 15(7), 482–496 CrossRef CAS PubMed.
- M. T. Heneka, M. J. Carson, J. E. Khoury, G. E. Landreth, F. Brosseron, D. Ransohoff, L. Feinstein, A. H. Jacobs, T. W. Coray, J. Vitorica, R. M. K. Herrup, S. A. Frautschy, B. Finsen, G. C. Brown, A. Verkhratsky, K. Yamanaka, J. Koistinaho, E. Latz, A. Halle, G. C. Petzold, T. Town, D. Morgan, M. L. Shinohara, V. H. Perry, C. Holmes, N. G. Bazan, D. J. Brooks, S. Hunot, B. Joseph, N. Deigendesch, O. Garaschuk, E. Boddeke, C. A. Dinarello, J. C. Breitner, G. M. Cole, D. T. Golenbock and M. P. Kummer, Lancet Neurol., 2015, 14, 388–405 CrossRef CAS PubMed.
- Y. Hou, X. Dan, M. Babbar, Y. Wei, S. G. Hasselbalch, D. L. Croteau and V. A. Bohr, Nat. Rev. Neurol., 2019, 15, 565–581 CrossRef PubMed.
- V. E. Marta and D. Marco, Curr. Biol., 2022, 32, R448–R452 CrossRef PubMed.
- J. Huang, P. Meng, C. Wang, Y. Zhang and L. Zhou, Theranostics, 2022, 12(5), 2445–2464 CrossRef CAS PubMed.
- C. Ising, C. Venegas, S. Zhang, H. Scheiblich, S. V. Schmidt, A. V. Saecker, S. Schwartz, S. Albasset, R. M. McManus, D. Tejera, A. Griep, F. Santarelli, F. Brosseron, S. Opitz, J. Stunden, M. Merten, R. Kayed, D. T. Golenbock, D. Blum, E. Latz, L. Buée and M. T. Heneka, Nature, 2019, 575, 669–673 CrossRef CAS PubMed.
- R. A. Avelar, J. G. Ortega, R. Tacutu, E. J. Tyler, D. Bennett, P. Binetti, A. Budovsky, K. Chatsirisupachai, E. Johnson, A. Murray, S. Shields, D. Tejada-Martinez, D. Thornton, V. E. Fraifeld, C. L. Bishop and J. P. de Magalhães, Genome Biol., 2020, 21, 91 CrossRef CAS PubMed.
- A. S. Wang and O. Dreesen, Front. Genet., 2018, 9, 247 CrossRef PubMed.
- S. He and N. E. Sharpless, Cell, 2017, 169(6), 1000–1011 CrossRef CAS PubMed.
- L. Shi, C. Yan, Y. Ma, T. Wang, Z. Guo and W. H. Zhu, Chem. Commun., 2019, 55(82), 12308–12311 RSC.
- X. Li, Y. Pan, H. Chen, Y. Duan, S. Zhou, W. Wu, S. Wang and B. Liu, Anal. Chem., 2020, 92(8), 5772–5779 CrossRef CAS PubMed.
- B. Lozano-Torres, I. Galiana, M. Rovira, E. Garrido, S. Chaib, A. Bernardos, D. Munoz-Espin, M. Serrano, R. Martinez-Manez and F. Sancenón, J. Am. Chem. Soc., 2017, 139(26), 8808–8811 CrossRef CAS PubMed.
- Z. Li, J. Cheng, L. Huang, W. Li, Y. Zhao and W. Lin, Anal. Chem., 2021, 93(41), 13800–13806 CrossRef CAS PubMed.
- B. Lozano-Torres, J. F. Blandez, I. Galiana, J. A. Lopez-Dominguez, M. Rovira, M. Paez-Ribes, E. González-Gualda, D. Muñoz-Espín, M. Serrano, F. Sancenón and R. Martínez-Máñez, Anal. Chem., 2021, 93(5), 3052–3060 CrossRef CAS PubMed.
- D. Liu, Z. Zhang, A. Chen and P. Zhang, Spectrochim. Acta, Part A, 2022, 265, 120345 CrossRef CAS PubMed.
- Y. Wen, N. Jing, F. Huo and C. Yin, Analyst, 2021, 146(24), 7450–7463 RSC.
- D. J. Colacurcio and R. A. Nixon, Ageing Res. Rev., 2016, 32, 75–88 CrossRef CAS PubMed.
- Y. Song, H. Zhang, X. Wang, X. Geng, Y. Sun, J. Liu and Z. Li, Anal. Chem., 2021, 93(3), 1786–1791 CrossRef CAS PubMed.
- H. Liu, W. Chen, W. Yuan, J. Gao, Q. Zhang, P. Zhang and C. Ding, Sens. Actuators, B, 2023, 379, 133262 CrossRef CAS.
- L. Yuan, W. Lin, S. Zhao, W. Gao, B. Chen, L. He and S. Zhu, J. Am. Chem. Soc., 2012, 134(32), 13510–13523 CrossRef CAS PubMed.
- Z. Li, X. He, Z. Wang, R. Yang, W. Shi and H. Ma, Biosens. Bioelectron., 2015, 63, 112–116 CrossRef CAS PubMed.
- S. Gnaim and D. Shabat, Acc. Chem. Res., 2014, 47(10), 2970–2984 CrossRef CAS PubMed.
- D. Y. Zhou, Y. Li, W. L. Jiang, Y. Tian, J. Fei and C. Y. Li, Chem. Commun., 2018, 54(82), 11590–11593 RSC.
- X. Jia, Q. Chen, Y. Yang, Y. Tang, R. Wang, Y. Xu, W. Zhu and X. Qian, J. Am. Chem. Soc., 2016, 138(34), 10778–10781 CrossRef CAS PubMed.
- Y. Liu, L. Teng, X. F. Lou, X. B. Zhang and G. Song, J. Am. Chem. Soc., 2023, 145(9), 5134–5144 CrossRef CAS PubMed.
- Q. Zhang, C. Fu, X. Guo, J. Gao, P. Zhang and C. Ding, ACS Sens., 2021, 6, 1138–1146 CrossRef CAS PubMed.
- H. H. Han, H. Tian, Y. Zang, A. C. Sedgwick, J. Li, J. L. Sessler, X. P. He and T. D. James, Chem. Soc. Rev., 2021, 50(17), 9391–9429 RSC.
- Y. Gao, Y. Hu, Q. Liu, X. Li, X. Li, C. Y. Kim, T. D. James, J. Li, X. Chen and Y. Guo, Angew. Chem., Int. Ed., 2021, 60(19), 10756–10765 CrossRef CAS PubMed.
- L. Zhou, X. Zhang, Y. Dong, Y. Pan, J. Li, Y. Zang and X. Li, ACS Sens., 2022, 7, 1958–1966 CrossRef CAS PubMed.
- J. Li, L. Wang, X. Luo, Y. Xia, Y. Xie, Y. Liu and W. Tan, Anal. Chem., 2023, 95, 3996–4004 CrossRef CAS PubMed.
- L. Wu, J. Huang, K. Pu and T. D. James, Nat. Rev. Chem., 2021, 5(6), 406–421 CrossRef CAS PubMed.
- J. Yin, L. Huang, L. Wu, J. Li, T. D. James and W. Lin, Chem. Soc. Rev., 2021, 50(21), 12098–12150 RSC.
- Z. Hu, C. Fang, B. Li, Z. Zhang, C. Cao, M. Cai, S. Su, X. Sun, X. Shi, C. Li, T. Zhou, Y. Zhang, C. Chi, P. He, X. Xia, Y. Chen, S. S. Gambhir, Z. Cheng and J. Tian, Nat. Biomed. Eng., 2020, 4(3), 259–271 CrossRef PubMed.
- B. Lozano-Torres, A. Estepa-Fernández, M. Rovira, M. Orzáez, M. Serrano, R. Martínez-Máñez and F. Sancenón, Nat. Rev. Chem., 2019, 3(7), 426–441 CrossRef CAS.
- Z. Mao, M. Ye, W. Hu, X. Ye, Y. Wang, H. Zhang, C. Li and Z. Liu, Chem. Sci., 2018, 9(28), 6035–6040 RSC.
- L. Yuan, L. Wang, B. K. Agrawalla, S. J. Park, H. Zhu, B. Sivaraman, J. Peng, Q. H. Xu and Y. T. Chang, J. Am. Chem. Soc., 2015, 137(18), 5930–5938 CrossRef CAS PubMed.
- N. Kavcic, K. Pegan, P. Vandenabeele and B. Turk, Biol. Chem., 2019, 400(2), 149–160 CrossRef CAS PubMed.
- B. Ozsvari, J. R. Nuttall, F. Sotgia and M. P. Lisanti, Aging, 2018, 10(11), 3042–3627 CrossRef PubMed.
- R. Ricciarelli, A. Azzi and J. M. Zingg, Biofactors, 2020, 46(4), 665–674 CrossRef CAS PubMed.
- L. Dang, Y. Wang, Y. Xue, L. He, Y. Li and J. Xiong, Oncol. Rep. , 2015, 34(3), 1478–1486 CrossRef CAS PubMed.
- T. Bald, T. Quast, J. Landsberg, M. Rogava, N. Glodde, D. Lopez-Ramos, J. Kohlmeyer, S. Riesenberg, D. van den Boorn-Konijnenberg, C. Hömig-Hölzel, R. Reuten, B. Schadow, H. Weighardt, D. Wenzel, I. Helfrich, D. Schadendorf, W. Bloch, M. E. Bianchi, C. Lugassy, R. L. Barnhill, M. Koch, W. Fleischmann, B. K. I. Förster, W. Kastenmuller, W. Kolanus, M. Hölzel, E. Gaffal and T. Tüting, Nature, 2014, 507(7490), 109–113 CrossRef CAS PubMed.
- M. G. van de Schans, J. P. Vincken, P. de Waard, A. R. Hamers, T. F. Bovee and H. Gruppen, J. Steroid Biochem. Mol. Biol., 2016, 156, 53–63 CrossRef CAS PubMed.
- S. Widyarini, D. Domanski, N. Painter and V. E. Reeve, Photobiol. Sci., 2012, 11(7), 1186–1192 CrossRef CAS PubMed.
Footnote |
| † Electronic supplementary information (ESI) available: Experimental section, 1H, 13C NMR and HR-MS spectra of the synthesized compounds, fluorescence, absorption and HR-MS spectral profiles, cytotoxicity of the probe, live cell imaging, and X-gal staining. See DOI: https://doi.org/10.1039/d4sc00595c |
| This journal is © The Royal Society of Chemistry 2024 |