
 Open Access Article
 This Open Access Article is licensed under a Creative Commons Attribution-Non Commercial 3.0 Unported Licence
Artemisinin: a novel chiral electrochemiluminescence luminophore-assisted enantiospecific recognition and mechanism identification†
Jiangyan
Wang‡
,
Zhengang
Han‡
 ,
Tianrui
Shang
,
Yanjun
Feng
,
Ruirui
Liu
and
Xiaoquan
Lu
*
,
Tianrui
Shang
,
Yanjun
Feng
,
Ruirui
Liu
and
Xiaoquan
Lu
*
Key Laboratory of Bioelectrochemistry and Environmental Analysis of Gansu Province, Key Laboratory of Water Security and Water Environment Protection in Plateau Intersection, Ministry of Education, College of Chemistry and Chemical Engineering, Northwest Normal University, Lanzhou, 730070, P. R. China. E-mail: luxq@nwnu.edu.cn
First published on 5th March 2024
Abstract
Exploring novel electrochemiluminescence (ECL) molecules with high efficiency and good stability in aqueous solutions is crucial for achieving highly sensitive detection of analytes. However, developing chiral luminophores with efficient ECL performance is still a challenge. Herein, we first uncover that artemisinin (ART), a well-known chiral antimalarial drug, features a strong ECL emission at 726 nm with the assistance of a co-reactant potassium persulfate (K2S2O8), and an ECL efficiency of 195.3%, compared to that of standard Ru(bpy)3Cl2/K2S2O8. Mechanistic studies indicate that the strong ECL signal of ART is generated when the excited state formed by the reduction of ART peroxide bonds and combination with persulfate returns to the ground state. Significantly, we found that the ECL sensor based on chiral ART could efficiently identify and detect chiral cysteine (Cys) through ECL signals, with a lower limit of detection of 3.7 nM for L-Cys. Density functional theory calculations and scanning electrochemical microscopy technology further confirm that the disparity in the ECL signals is attributed to the different affinity between chiral ART and D/L-Cys, resulting in distinct electron transfer rates. The study demonstrates a new role of ART in ECL investigation and for the first time, achieves the development of ART for the enantioselective recognition and sensitive detection of chiral substances. This will be of vital significance for ECL and chirality research.
1 Introduction
Electrochemiluminescence (ECL) represents a special luminescent phenomenon generated in the vicinity of a working electrode by electrochemical excitation.1–4 Owing to the intrinsic advantages of high specificity, excellent sensitivity, easy controllability, and low background, ECL exhibits unique superiority over other spectroscopy-based detection systems.5,6 In general, luminophores play a vital role in developing ultrasensitive ECL systems. Therefore, exploring novel and efficient luminophores has always been important in ECL research. Among them, some organic ECL luminophores are in great demand due to their structural diversity, thermal/photochemical stability, adjustable wavelength, convenient functionalization and excellent biocompatibility.7–10 Generally, a prerequisite for producing ECL from these organic luminophores is that they possess an easily fractured chemical structure, such as a peroxy bond or a hydrazine bond.11–14 The chiral luminophores for ECL, however, are currently quite limited, which restricts their applications in the detection and measurement of chiral analytes.Artemisinin (ART), a unique endoperoxide-containing sesquiterpene isolated from an ancient Chinese herb Artemisia annua, is being widely used as an effective anti-malarial drug.15,16 Early structural activity studies have revealed that the endoperoxide fraction has been proven to be critical for its antimalarial activity. A large number of studies have shown that ART also possesses peculiar anticancer activity against melanoma, breast, ovarian, prostate, and central nervous system cancer via the decomposition of the endoperoxide in a reducing environment (Fe2+, or GSH) and splitting of its endoperoxide bridge to produce reactive oxygen species.17–20 Similarly, due to ART containing endoperoxide O–O bonds, which are easily broken, it can generate ECL under an electrochemical excitation. However, the ECL of ART remains unexplored to the best of our knowledge. More importantly, as a chiral molecule, studying the ECL of ART will have more significant implications for the detection of chiral substances.21,22
Chiral recognition plays an important role in chemical synthesis, pharmaceutical chemistry and environmental chemistry.23,24 Amino acids are the most important chiral compounds in nature and are the basic components of proteins. Specifically, L-cysteine (L-Cys) is a natural protein-derived amino acid that plays a key role in protein synthesis, cytotoxic detoxification, and various metabolic processes.25 If the human body lacks L-Cys, there will be psoriasis, leukopenia, and decreased hematopoietic function, while excessive D-cysteine may be closely related to neurological diseases, such as Parkinson's disease and Alzheimer's disease.26,27 Therefore, the development of a new method for Cys chirality recognition with high sensitivity, selectivity, accuracy and speed is considered to be very promising in the diagnosis and treatment of diseases.
Herein, a strong and stable cathodic ECL emission of chiral ART as a new ECL luminophore using potassium persulfate (K2S2O8) as a co-reactant is observed in aqueous media for the first time. With ART as the ECL luminophore, ECL is generated at 726 nm in the near-infrared (NIR) region, which is envisaged to be more useful than visible light emission due to lower background interference. Moreover, the sensor based on the ART/K2S2O8 ECL system showed excellent enantiomeric discrimination for chiral cysteine; therefore, we constructed a highly sensitive ECL sensor for efficiently identifying and detecting D-Cys and L-Cys through the ECL signals, with a limit of detection of 3.7 nM for L-Cys. Density functional theory calculations and scanning electrochemical microscopy technology further revealed the recognition mechanism of artemisinin on chiral Cys through the ECL signals. To our knowledge, this is the first report on the ECL of chiral ART in aqueous solution, thus bringing great potential for ECL in the field of chirality.
2 Results and discussion
2.1 Structure and characterization of ART
Fig. 1A exhibits a schematic diagram of the chemical structure of ART, which contains 7 chiral centers in its molecules. Fig. 1B verifies the chiral optical properties of ART through the CD spectrum. As shown in Fig. 1C, ART in an ethanol solution shows absorption peak maxima at 206 nm. Moreover, ART does not contain chromophores, so no photoluminescence was observed. Next, the annihilation ECL was systematically investigated under following experimental conditions: 1.0 mM ART at a wide potential window of −2 to 2 V and a scanning rate of 0.2 V s−1. Specifically, commonly used organic solvents for detecting annihilation-type ECL include dichloroethane, acetonitrile, and a 1![[thin space (1/6-em)]](https://www.rsc.org/images/entities/char_2009.gif) :1 benzene/acetonitrile solution. Compared with dichloroethane and acetonitrile as solvents, ART has better solubility and better detection results when using a 1:1 benzene/acetonitrile solution (Fig. S1†). Further, 1.0 mM of ART solution was dissolved in a mixture of acetonitrile and benzene solution (1:1), with 0.1 M TBPF6 as the supporting electrolyte. As shown in Fig. 1D, a significant reduction peak can be observed around −0.8 V, but the corresponding annihilation ECL signal is weak. To obtain a highly stable ECL signal, in our subsequent research, we introduced co-reactants to enhance the ECL signal of ART.28
:1 benzene/acetonitrile solution. Compared with dichloroethane and acetonitrile as solvents, ART has better solubility and better detection results when using a 1:1 benzene/acetonitrile solution (Fig. S1†). Further, 1.0 mM of ART solution was dissolved in a mixture of acetonitrile and benzene solution (1:1), with 0.1 M TBPF6 as the supporting electrolyte. As shown in Fig. 1D, a significant reduction peak can be observed around −0.8 V, but the corresponding annihilation ECL signal is weak. To obtain a highly stable ECL signal, in our subsequent research, we introduced co-reactants to enhance the ECL signal of ART.28
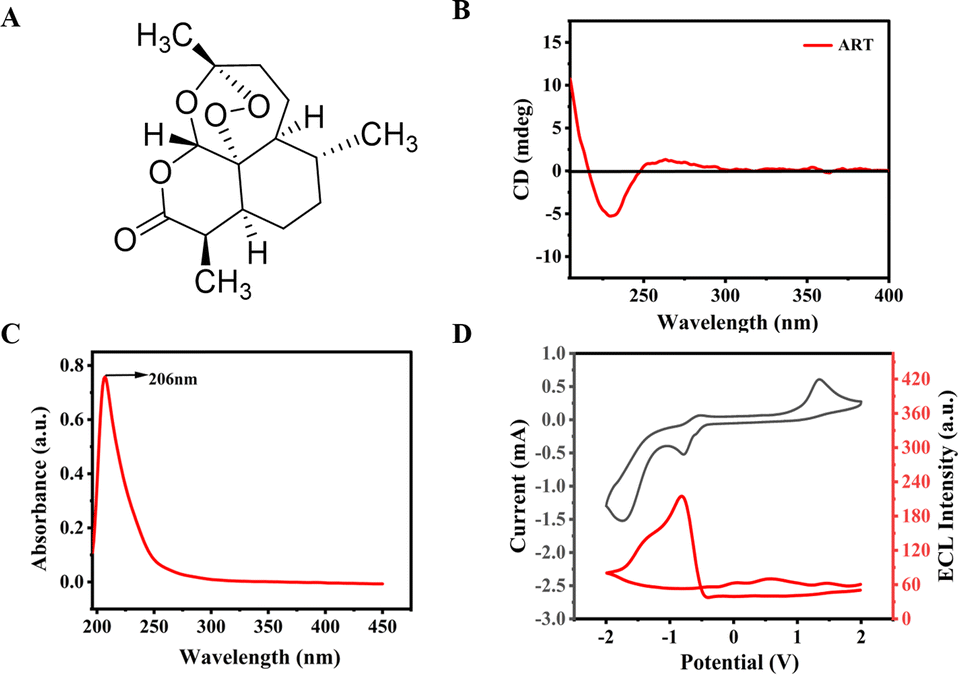 | ||
| Fig. 1 (A) Schematic chemical structure of ART. (B) CD spectra of ART. (C) UV-vis spectra of ART in ethanol solution. (D) CV curves and annihilation ECL-voltage curves of 1.0 mM ART in a 1:1 benzene/acetonitrile solution, with 0.1 M TBAPF6 as the supporting electrolyte. Scanning potential ranged from −2 to +2 V. Scanning rate was set at 0.2 V s−1. | ||
At first, we explored the electrochemical properties of ART by studying its reaction on a glassy carbon electrode (GCE). As seen from Fig. 2A, only one reduction peak appeared at around −0.8 V, indicating an irreversible process in ART reduction. The reduction peak of ART gradually decreased or even disappeared with an increasing number of scanning cycles, which may be due to the adsorption of products generated by the reaction on the electrode surface, thus hindering the reduction of ART to a certain extent. Fig. 2B presents the changes in potential and current of ART at different sweep speeds. With the increase in scanning speed, the peak potential gradually shifted to negative, and the peak current increased. Moreover, there was a good linear relationship between the peak current and sweep rate in the range of 50–300 mV s−1 (Fig. 2C), indicating that the reduction of ART on the glassy carbon electrode was an irreversible electrode reaction controlled by adsorption.29 The current was diffusion-controlled, according to the following formula:
 | ||
| Fig. 2 (A) Multiple cyclic voltammetry of ART on a glassy carbon electrode. (B) Cyclic voltammetry of artemisinin at different sweep speeds. (C) Linear relationship between current and sweep velocity of artemisinin. (D) Applied potential versus log(i/ip − i) at artemisinin at the GCE. 0.1 mM ART was subjected to cyclic voltammetry in 0.1 M PBS (pH = 7.4) at the cathode (Ag/AgCl) electrode as the reference electrode. | ||
2.2 Electrochemical luminescence properties of ART
The ECL of ART was studied in the aqueous phase. According to some literature, co-reactants such as tripropylamine, hydrogen peroxide and potassium persulfate can promote ECL via interaction with luminophores. As presented in Fig. 3A, the ECL properties of ART were studied when K2S2O8, benzoyl peroxide, hydrogen peroxide, tripropylamine and triethylamine acted as related co-reactants.33 It was found that other co-reactants did not have obvious promotions for the ECL signal, except for K2S2O8. After conducting several experiments, it was observed that the ECL signal was obviously enhanced when using potassium persulfate as the co-reactant [Fig. 3B; optimal experimental conditions were as follows: potential window 0.0 − (−1.7) V (vs. Ag/AgCl), 0.1 M K2S2O8, pH = 7.4, 0.2 V s−1 scanning rate]. The CV and ECL-potential curves of ART on a GCE in the presence and absence of 0.1 M K2S2O8 were recorded by cyclic potentials between 0.0 V and −1.7 V. In a PBS containing 0.1 M K2S2O8, the bare GCE only featured a weak ECL emission, and its CV showed a distinct cathode peak (−0.91 V), which was attributed to the reduction of S2O82− (Fig. 3B, red line). In a PBS without K2S2O8, ART demonstrated a slight ECL emission (Fig. 3B, blue line). When the co-reactant K2S2O8 was added to the mixture, ART could exhibit a strong ECL signal with a significant reduction peak at −1.3 V. The phenomenon indicated that ART was reduced to the reduced state (Fig. 3B black line), and co-reactant K2S2O8 could significantly improve the ECL performance of ART.34,35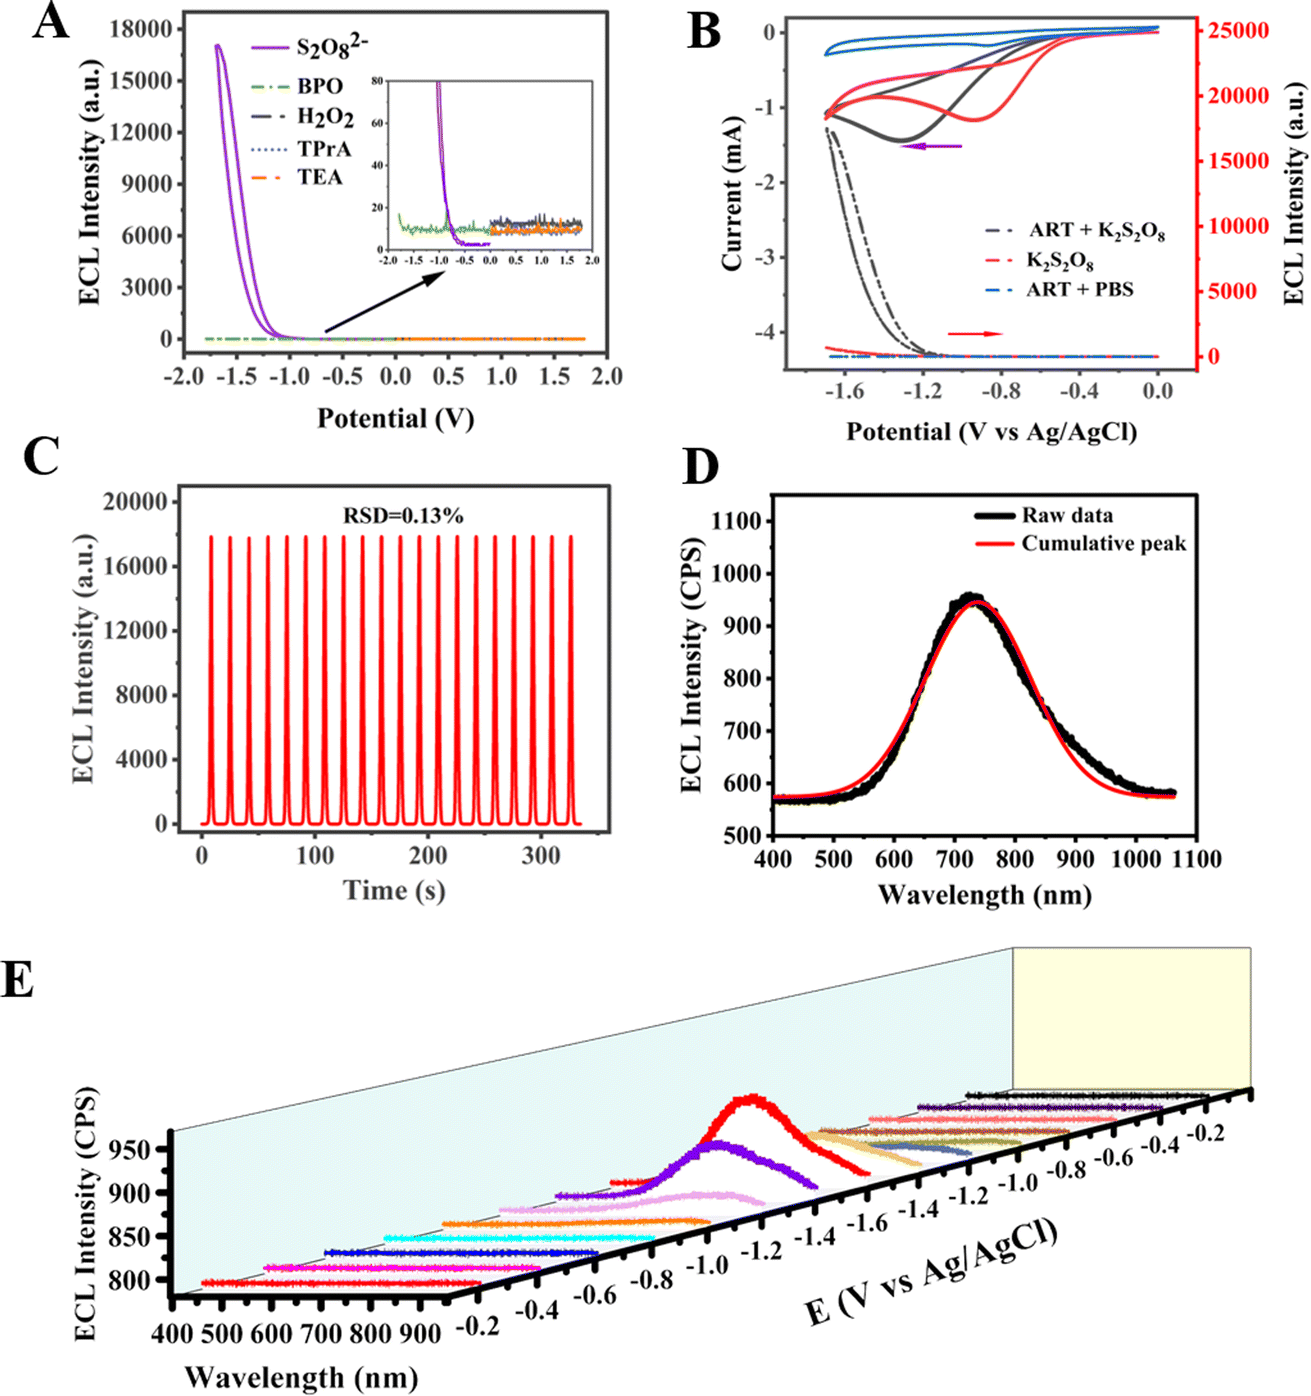 | ||
| Fig. 3 (A) ECL-potential obtained at the ART/GCE electrode with different co-reactants (100 mM K2S2O8, 10 mM BPO, 10 mM H2O2, 10 mM TPA, and 10 mM TEA). (B) CV curves and corresponding ECL-potential curves of bare GCE in 0.1 M PBS containing 0.1 M K2S2O8 (red curve) and ART/GC electrode in 0.1 M PBS in the absence (blue) and presence (black curve) of 0.1 M K2S2O8. (C) ECL intensity of ART time under optimal conditions for continuous 20 cycles. (D) Collected ECL spectrum of the ART-based ECL system at 726 nm. (E) Spooling ECL spectra of ART-modified GCE with 100 mM K2S2O8 in 0.1 M PBS (pH 7.4) solution during a potential scan cycle between −1.6 and 0 V. Each spectrum was acquired for a time interval of 2 s or a 50 mV potential interval. | ||
The ECL conditions of the ART/K2S2O8 system were optimized after extensive experiments. We found that ART has an optimal pH of 7.4 (Fig. S3A†). In addition, with the increase in K2S2O8 concentration, the ECL intensity of ART also increased and reached the highest at 0.1 M (Fig. S3B†), indicating that K2S2O8 could be used as an effective co-reactant to amplify the ECL emission of ART. When the optimized scanning rate was 0.2 V s−1 and potential window ranged from 0 ∼ −1.7 V, the strongest ECL signal was observed (Fig. S3C and D†).
The stability of ECL directly determines its further application. It can be seen from Fig. 3C that the ECL intensity of ART did not noticeably fluctuate after 20-cycle scanning under optimal conditions. In addition, the relative standard deviation (RSD) was certainly low at 0.13%, indicating excellent stability and reliability. All above statements laid a good foundation for its subsequent investigations.36 The collected ECL spectrum of the ART-based ECL system was centered at 726 nm in Fig. 3D,37 and the results show that ART exhibits strong electrochemical luminescence at 726 nm. As a co-reactant, K2S2O8 significantly improves ECL activity, and thus, spooling ECL spectra can be collected at different electric potentials (Fig. 3E). Spooling ECL spectroscopy allows real-time monitoring of ECL intensity and wavelength during potential dynamics. When the applied potential increases towards a negative value, a significant change in the ECL signal can be clearly observed. Furthermore, the ECL begins to occur at −1.2 V, and at this potential, ART begins to become (peak potential −1.2 V, Fig. 3B) its radical anion (ARTRed)˙−, as shown in (eqn (1)). K2S2O8 is also reduced to form strongly oxidizing species SO4˙− (eqn (2)). The more negative the potential applied by the scan, the more SO4˙− is produced, which increases (ARTRed)* and causes a change in the ECL. Thus, the maximum ECL is observed at −1.6 V.
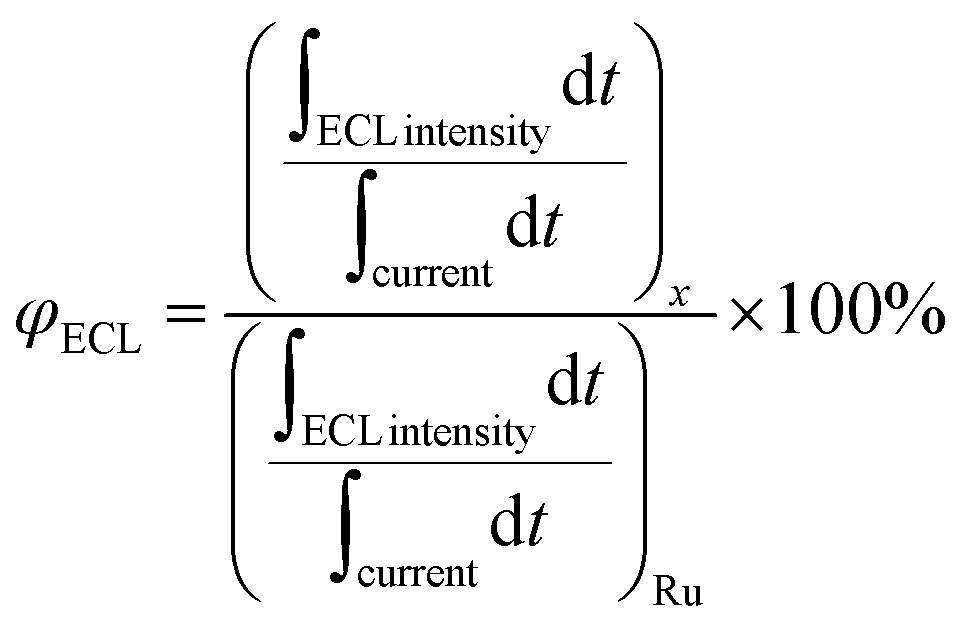
The collected ECL spectrum of ART was located in the infrared region at 726 nm. Due to its advantages of low background interference, low cell damage, and strong penetration ability, the ECL system would demonstrate great potential in the field of biological imaging. Afterwards, we calculated the related ECL efficiency (ΦECL). The ECL value refers to the ECL efficiency of Ru(bpy)3Cl2/K2S2O8 using the following formula:
 | (1) |
| S2O82− + e− → SO4˙− + SO42− | (2) |
| (ARTRed)˙− + SO4˙− → (ARTRed)* + SO42− | (3) |
| (ARTRed)* → ARTRed + hv | (4) |
The previous experimental results showed that ART was first adsorbed on the electrode, followed by the formation of a transition state of artemisinin through the destruction of peroxo-bonds and acquisition of two electrons. Finally, the transition state of ART rapidly transformed into a reduced state of artemisinin (ARTRed) by combining with two hydrogen protons (eqn (1)). The above process was verified by the mass spectrum (Fig. S4†). The formed ARTRed is further reduced to corresponding anionic radicals (ARTRed)˙−, which undergo electron transfer with co-reactant radical ions (SO4˙−) to obtain the excited state of (ARTRed)*. Finally, (ARTRed)* emits light when returning to the ground state.
2.3 Detection
Chiral molecules play an important role in living systems, and it is currently a challenging task to distinguish chiral molecules. Amino acids, the building blocks of life, are also chiral. The human body is comprised of left-handed amino acids, which cannot metabolize right-handed molecules well. Consequently, the consumption of drugs containing right-handed molecules will become a burden and even cause damage to the living body. Therefore, the recognition of chiral amino acids is of great significance. The main methods reported for the recognition of chiral molecules include chromatography (high-performance liquid chromatography, gas chromatography, supercritical fluid chromatography, simulated moving bed chromatography and capillary electrophoresis), spectroscopy (UV-visible spectrometry, fluorescence spectrometry, and circular dichroism), chiral sensor recognition and electrochemical methods.40,41 Among them, the electrochemical method has been widely concerned by researchers for its advantages of high sensitivity, low cost, simple operation and real-time on-line detection.Because of the inherent chiral structure of ART, we considered that the ART-based ECL system could detect and identify chiral cysteine. Fig. 4A exhibits a schematic diagram of the chemical structure of L/D-Cys. As can be seen from Fig. 4B, the ECL signals decreased linearly with the increase in L-Cys concentrations,42–45 indicating that L-Cys had a good quenching effect on the artemisinin ECL system. Fig. 4C shows the relationship between L-Cys concentration and ECL intensity in the range of 0.01–0.60 μM. There was a strong linear relationship between ECL intensity and L-Cys concentration in the artemisinin-potassium persulfate system in the range of 0.01–0.30 μM. Linear equation: ΔECL = I0 − I = 28998C + 4066, R2 = 0.9905, where I0 and I are ECL intensities without and with L-Cys in the system, respectively. The calculated limit of detection (LOD) is located at a very low value of 3.7 nM (S/N = 3).46–48 In contrast, the quenching effect of D-Cys on the artemisinin ECL system was not significant in the range of 0.01–0.30 μM (Fig. 4D). Therefore, the ART-based ECL system exhibited excellent chiral selectivity for cysteine enantiomers. To test the enantiomer selectivity of the system, we measured the ECL strength of the artemisinin-potassium persulfate system when adding L-Cys + D-Cys mixtures with different enantiomer overpass values (ee%).49,50 The prepared ee value was obtained from the concentration of the enantiomer using the formula ([L] − [D])/([L] + [D]) × 100%. Fig. 4E shows a linear relationship between ECL intensity and enantiomer overdose (R2 = 0.9936), indicating that an ART-based ECL system could be used for enantiomer overdose detection.
 | ||
| Fig. 4 (A) Structural formula for chiral cysteine. (B) ECL responses of the system at different L-Cys concentrations. (C) Calibration curve. (D) ECL responses of the system at different D-Cys concentrations. (E) ECL intensity of ART for the discrimination of cysteine enantiomer with various ee values. The error bars represent the standard deviations of three independent tests. | ||
Then, the enantiomer composition of the L-Cys and D-Cys mixture at different concentrations (20%, 40%, and 60%) was accurately determined by the significant difference of enantiomers and difference of ECL values (Fig. S5†). Table 1 shows that concentrations calculated by the linear equation are consistent with actual concentrations. All these results revealed that the ART-based ECL system could detect chiral cysteine and demonstrate a promising application prospect in the detection of chiral substances.51–53
| No. | ee% | Enantiomer | Actual concentration (μM) | Measured ee% | Calculated concentration (μM) |
|---|---|---|---|---|---|
| 1 | 20 | L | 0.24 | 20.65 | 0.2413 |
| D | 0.16 | 0.1587 | |||
| 2 | 40 | L | 0.28 | 40.03 | 0.2801 |
| D | 0.12 | 0.1199 | |||
| 3 | 60 | L | 0.32 | 60.03 | 0.3201 |
| D | 0.08 | 0.0799 |
2.4 Mechanism analysis
To further explore the difference in the ECL signals generated by the interaction of ART and L/D-Cys, the electron transfer behavior of ART + chiral cysteine systems was studied by scanning electrochemical microscopy (SECM). Herein, FTO glass loaded with ART was used as the working electrode and K3[Fe(CN)6] as the probe molecule. As shown in Fig. 5, different modified electrodes exhibit different asymptotic curves under light and dark conditions. Under dark conditions, it exhibits negative feedback behavior because when the probe approaches the substrate, the reaction process is hindered, and the current of the probe decreases with decreasing distance. Under illumination conditions, as the SECM probe approaches the substrate, the probe current shows an increasing trend, exhibiting a positive feedback behavior. The kinetic constant (Keff) fitted based on the positive feedback indicates that the order of electron transfer rates is as follows: ART (0.66 × 10⁻² cm s−1) > ART-D-Cys (0.60 × 10⁻² cm s−1) > ART-L-Cys (0.49 × 10⁻² cm s−1). This indicates that ART-L-Cys is more difficult to transfer electrons than ART-D-Cys. These results indicate that the combination of ART and different enantiomers leads to differences in electron transfer rates at the interface, resulting in changes in current intensity. | ||
| Fig. 5 (A) SECM probes with different modified electrodes approaching the curve. (B) Rate constant Keff. | ||
To explore the chiral recognition mechanism at the molecular level, molecular interactions between ART and D/L-Cys were calculated using the density functional (DFT) method (Fig. 6). As shown in Fig. 6, the binding energies of the complexes of ART-D-Cys and ART-L-Cys are calculated to be −8.87 and −10.07 kJ mol−1, respectively, suggesting the interaction between L-Cys and ART was stronger than that of D-Cys. In addition, the electronic affinities of ART and ART-D/L-Cys were calculated. The electronic affinities indicated that the order of electron acquisition is as follows: ART (−15.75 kJ mol−1) > ART-D-Cys (−13.49 kJ mol−1) > ART-L-Cys (−13.29 kJ mol−1), suggesting that ART-D-Cys is more likely to acquire electrons than ART-L-Cys. Therefore, we propose the following possible chiral recognition mechanisms. Due to the stronger interaction between ART and L-Cys than D-Cys, the electron transfer rate of ART-L-Cys is slower than that of ART-D-Cys, resulting in different ECL intensities for enantiomeric recognition.54,55
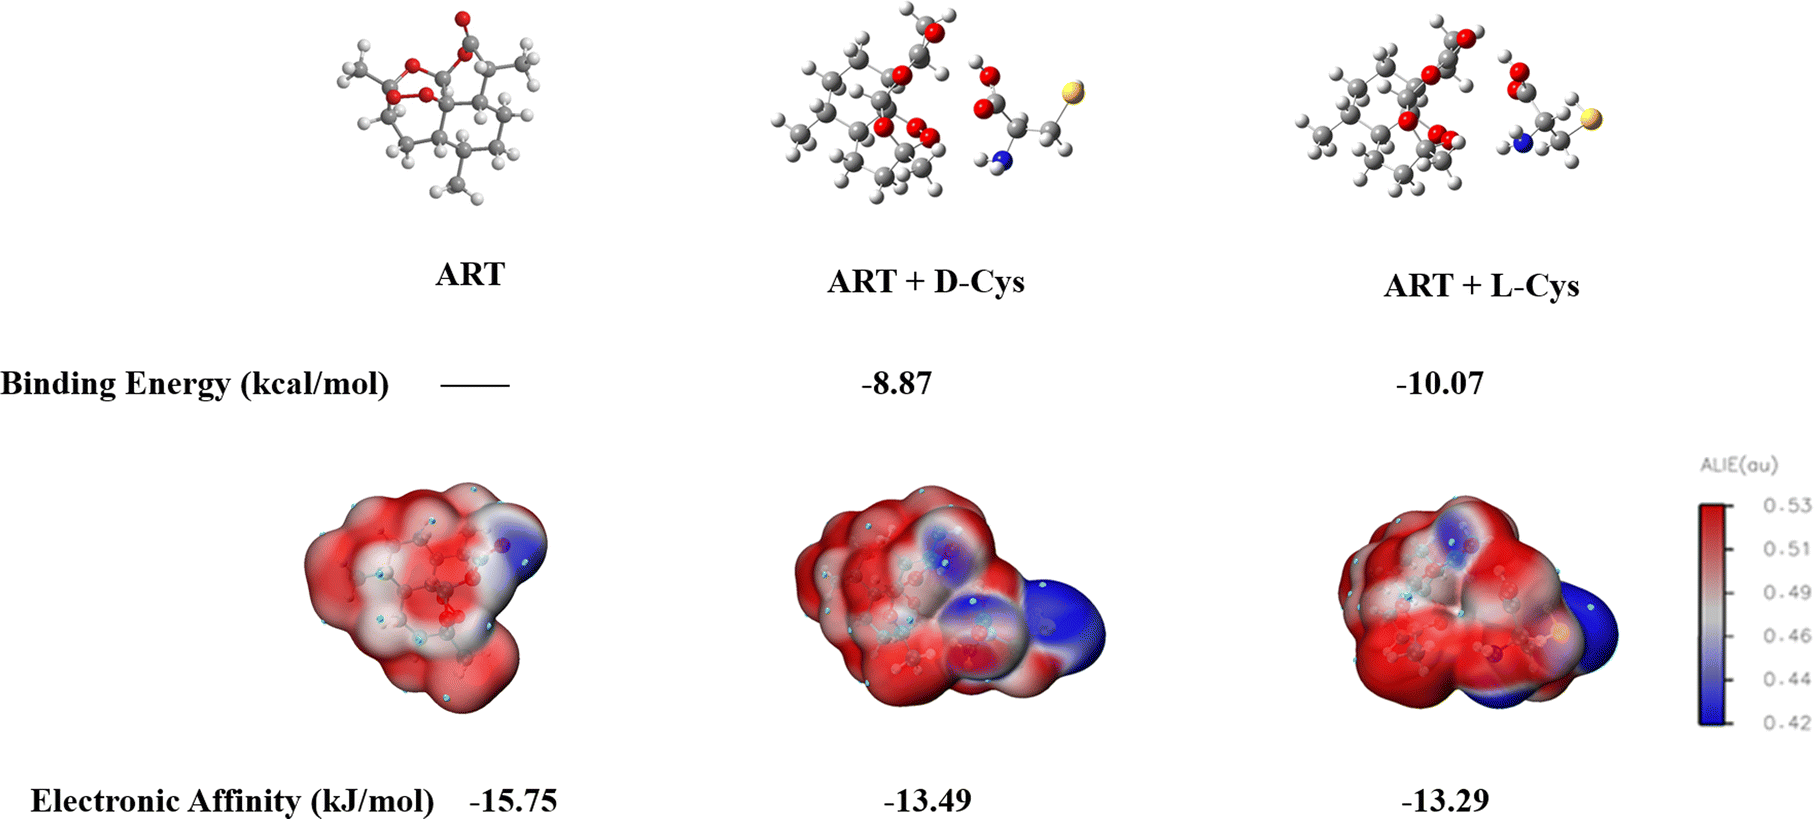 | ||
| Fig. 6 Calculation of binding energy and electron affinity between ART and chiral cysteine. | ||
2.5 Application in real sample analysis
To evaluate the feasibility of actual sample analysis, different concentrations of L-Cys were added to fetal bovine serum samples, diluted 20 times. As shown in Fig. S7,† the presence of 0.05–0.3 μM L-Cys in the fetal bovine serum samples can be detected. The recoveries were calculated by the standard addition method, as shown in Table 2. The recoveries of L-Cys were 104–119.5%, RSD < 5%. The results showed that the ECL system featured a good application prospect in the detection of L-Cys in practical samples.56| Sample | Added (μM) | Measured (μM) | Recovery (%) | RSD (%, n = 3) |
|---|---|---|---|---|
| L-Cys | 0.10 | 0.104 | 104.00 | 0.48 |
| 0.15 | 0.154 | 102.67 | 1.42 | |
| 0.20 | 0.239 | 119.50 | 0.61 |
3 Conclusions
In conclusion, we report for the first time that chiral ART exhibits good ECL performance in the NIR region, which indicates that ART may be a new, efficient and promising chiral ECL luminophore. Experimental and mechanistic studies demonstrated that the strong ECL emission of ART was attributed to the breaking of the peroxy bond during the reaction on the electrode and excited state formed by the combination with persulfate. In addition, ART contains seven chiral carbons. In view of this, we successfully accomplished the highly sensitive detection of chiral cysteine using the artemisinin ECL system. The results of SECM and DFT reveal that the obvious differences in the ECL signals could be attributed to the higher affinity of ART toward L-Cys than D-Cys, resulting in a slower electron transfer rate for ART-L-Cys than ART-D-Cys. This chiral ART is a promising candidate as an efficient ECL for chiral substance sensing applications, which prompts the development of ART in various applications.Data availability
The data supporting the findings of this study are available within the article and in the ESI.†Author contributions
Zhengang Han and Xiaoquan Lu conceived and supervised the project. The experiments and characterizations were carried out by Jiangyan Wang. All authors discussed the results and commented on the manuscript.Conflicts of interest
There are no conflicts to declare.Acknowledgements
This work was supported by the National Natural Science Foundation of China (Grant no. 22174110 and 22127803), the Industrial Support Plan of Gansu Provincial Department of Education (2021cyzc-01), and a special fund project for the Central Government to guide local science and technology development (no. 2020-2060503-17).Notes and references
- X. Qin, Z. Zhan and Z. Ding, Curr. Opin. Electrochem., 2023, 39, 101283 CrossRef CAS.
- M. Richter, Chem. Rev., 2004, 104, 3003–3036 CrossRef CAS PubMed.
- W. Guo, H. Ding, C. Gu, Y. Liu, X. Jiang, B. Su and Y. Shao, J. Am. Chem. Soc., 2018, 140, 15904–15915 CrossRef CAS PubMed.
- K. Wu, Y. Zheng and R. Chen, Biosens. Bioelectron., 2023, 223, 115031 CrossRef CAS PubMed.
- H. Peng, Z. Huang, Y. Sheng, X. Zhang, H. Deng, W. Chen and J. Liu, Angew. Chem., Int. Ed., 2019, 58, 11691–11694 CrossRef CAS PubMed.
- J. Ye, L. Zhu, M. Yan, Q. Zhu, Q. Lu, J. Huang, H. Cui and X. Yang, Anal. Chem., 2019, 91, 1524–1531 CrossRef CAS PubMed.
- X. Wei, M. J. Zhu, Z. Cheng, M. Lee, H. Yan, C. Lu and J. Xu, Angew. Chem., Int. Ed., 2019, 131, 3194–3198 CrossRef.
- Z. Liu, W. Qi and G. Xu, Chem. Soc. Rev., 2015, 44, 3117–3142 RSC.
- A. Abdussalam and G. Xu, Anal. Bioanal. Chem., 2022, 414, 131–146 CrossRef CAS PubMed.
- Z. Ding, B. M. Quinn, S. K. Haram, L. E. Pell, B. A. Korgel and A. J. Bard, Science, 2002, 296, 1293–1297 CrossRef CAS PubMed.
- S. Hanif, S. Han, P. John, W. Gao and S. A. Kitte, Electrochim. Acta, 2016, 196, 245–251 CrossRef CAS.
- M. Hesari and Z. Ding, Acc. Chem. Res., 2017, 50, 218–230 CrossRef CAS.
- J. Tan, L. Xu, T. Li, B. Su and J. Wu, Angew. Chem., Int. Ed., 2014, 53, 9822–9826 CrossRef CAS PubMed.
- Z. Cao and B. Su, Electrochem. Commun., 2019, 98, 47–52 CrossRef CAS.
- H. J. Woerdenbag, N. Pras, W. V. Uden, T. E. Wallaart and C. B. Lugt, Pharm. World Sci., 1994, 16, 169–180 CrossRef CAS PubMed.
- J. A. Vroman, M. Alvim-Gaston and M. A. Avery, Curr. Pharm. Des., 1999, 5, 101–138 CrossRef CAS PubMed.
- T. Jiang, X. Sun, L. Wei and M. Li, Anal. Bioanal. Chem., 2021, 413, 565–576 CrossRef CAS PubMed.
- D. Sriram, V. S. Rao, K. V. G. Chandrasekhara and P. Yogeeswari, Nat. Prod. Res., 2005, 18, 503–527 CrossRef PubMed.
- C. Wang, M. I. Halawa, B. Lou, W. Gao, J. Li and G. Xu, Analyst, 2021, 146, 1981–1985 RSC.
- M. A. Rafiee, N. L. Hadipour and H. Naderi-manesh, J. Chem. Inf. Model., 2005, 45, 366–370 CrossRef CAS PubMed.
- J. Chen, J. Gu, R. Zhao, R. Dai and J. Wang, Chromatographia, 2009, 69, 361–363 CrossRef CAS.
- L. Li, B. B. Yang and Y. K. Si, Chin. Chem. Lett., 2014, 25, 1586–1590 CrossRef CAS.
- R. Naaman, Y. Paltiel and D. H. Waldeck, Annu. Rev. Biophys., 2022, 51, 99–114 CrossRef CAS PubMed.
- S. Zhang, Y. Zheng, H. An, B. Aguila, C. X. Yang, Y. Dong, W. Xie, P. Cheng, Z. Zhang, Y. Chen and S. Ma, Angew. Chem., Int. Ed., 2018, 57, 16754–16759 CrossRef CAS PubMed.
- V. S. Lamzin, Z. Dauter and K. S. Wilson, Curr. Opin. Struct. Biol., 1995, 5, 830–836 CrossRef CAS PubMed.
- T. S. Chen, J. P. Jr Richie and C. A. Lang, Proc. Soc. Exp. Biol. Med., 1989, 190, 399–402 CrossRef CAS PubMed.
- M. T. Heafield, S. Fearn, G. B. Steventon, R. H. Waring, A. C. Williams and S. G. Sturman, Neurosci. Lett., 1990, 110, 216–220 CrossRef CAS PubMed.
- K. N. Swanick, M. Hesari, M. S. Workentin and Z. Ding, J. Am. Chem. Soc., 2012, 134, 15205–15208 CrossRef CAS PubMed.
- S. Sharma and E. Ali, J. Phys. Org. Chem., 2022, 35, e4392 CrossRef CAS.
- A. M. Mugweru, A. Shore, H. K. Kahi and G. N. Kamau, Int. J. Chem. Kinet., 2016, 48, 72–78 CrossRef CAS.
- L. Moroni, C. Gellini, M. Miranda and E. Salvietti, J. Raman Spectrosc., 2008, 39, 276–283 CrossRef CAS.
- M. Asano and H. Iwahashi, Eur. J. Med. Chem., 2017, 127, 740e747 CrossRef.
- N. Gao, H. Zeng, X. Wang, Y. Zhang, S. Zhang, R. Cui and L. Mao, Angew. Chem., Int. Ed., 2022, 134, e202204485 CrossRef.
- Z. Han, Z. Yang, H. Sun, Y. Xu, X. Ma, D. Shan and X. Lu, Angew. Chem., Int. Ed., 2019, 58, 5915–5919 CrossRef CAS PubMed.
- Z. Han, X. Yu, Y. Sang, Y. Xu, A. Zhao and X. Lu, Anal. Chem., 2022, 94, 6036–6043 CrossRef CAS PubMed.
- Z. Han, M. Chai, X. Yu, J. Wang, Y. Zhao, A. Zhao and X. Lu, Anal. Chem., 2023, 95, 7036–7044 CrossRef CAS.
- H. Lv, R. Zhang, S. Cong, J. Guo, M. Shao, W. Liu and X. Lu, Anal. Chem., 2022, 94, 4538–4546 CrossRef CAS.
- T. Zhao, Q. Zhou, Y. Lv, D. Han, K. Wu, L. Zhao, Y. Shen, S. Liu and Y. Zhang, Angew. Chem., Int. Ed., 2020, 59, 1139–1143 CrossRef CAS.
- R. Zou, Y. Lin and C. Lu, Anal. Chem., 2021, 93, 2678–2686 CrossRef CAS PubMed.
- Q. Zhao, W. Cai, B. Yang, Z. Yin, D. Wu and Y. Kong, Analyst, 2021, 146, 6245–6251 RSC.
- M. Rodier, C. Keijzer, J. Milner, A. S. Karimullah, A. W. Roszak, L. D. Barron and M. Kadodwala, Nanoscale Horiz., 2020, 5, 336–344 RSC.
- A. J. Stewart, K. Brown and L. Dennany, Anal. Chem., 2018, 90, 12944–12950 CrossRef CAS PubMed.
- X. Wang, H. Liu, J. Jiang, M. Qian, H. Qi and Q. Gao, Anal. Chem., 2022, 94, 5441–5449 CrossRef CAS.
- K. Tian, Y. Zhang, S. Zhang and Y. Dong, J. Electrochem. Soc., 2019, 166, H527 CrossRef CAS.
- C. X. Tang, N. N. Bu, X. W. He and X. B. Yin, Chem. Commun., 2011, 47, 12304–12306 RSC.
- T. Matsunaga, T. Kondo, I. Shitanda, Y. Hoshi, M. Itagaki, T. Tojo and M. Yuasa, Carbon, 2021, 173, 395–402 CrossRef CAS.
- J. Peng, Q. Huang, Y. Liu, Y. Huang, C. Zhang and G. Xiang, Electroanalysis, 2020, 32, 1237–1242 CrossRef CAS.
- F. Yan, X. Sun, F. Zu, Z. Bai, Y. Jiang, K. Fan and J. Wang, Methods Appl. Fluoresc., 2018, 6, 042001 CrossRef CAS PubMed.
- J. Zhao, P. Zhang, H. Qiao, A. Hao and P. Xing, J. Phys. Chem. Lett., 2021, 12, 2912–2921 CrossRef CAS PubMed.
- C. Li, L. Liu, W. Pan, Y. Chen, X. Shang, Y. Wang and X. Xu, Sci. Rep., 2019, 9, 18838 CrossRef CAS.
- Y. Zhang, H. Y. Wang, X. W. He, W. Y. Li and Y. K. Zhang, J. Hazard. Mater., 2021, 412, 125249 CrossRef CAS PubMed.
- L. Wu, C. Zhao, J. Ren and X. Qu, Chem.–Eur. J., 2014, 20, 11675–11679 CrossRef CAS PubMed.
- Y. Zhou, H. Sun, H. Xu, S. Matysiak, J. Ren and X. Qu, Angew. Chem., Int. Ed., 2018, 130, 17033–17037 CrossRef.
- Z. Wang, X. Ning, Y. Feng, R. Zhang, Y. He, H. Zhao, J. Chen, P. Du and X. Lu, Anal. Chem., 2022, 94, 8539–8546 CrossRef CAS PubMed.
- X. Ning, W. Li, Y. Meng, D. Qin, J. Chen, X. Mao, Z. Xue, D. Shan, S. Devaramani and X. Lu, Small, 2018, 14, e1703989 CrossRef PubMed.
- Y. Song, S. Lu, J. Hai, K. Liang, S. Sun, G. Meng and B. Wang, Anal. Chem., 2021, 93, 11470–11478 CrossRef CAS PubMed.
Footnotes |
| † Electronic supplementary information (ESI) available. See DOI: https://doi.org/10.1039/d4sc00277f |
| ‡ These authors contributed equally to this work. |
| This journal is © The Royal Society of Chemistry 2024 |