 Open Access Article
Facile electrocatalytic proton reduction by a [Fe–Fe]-hydrogenase bio-inspired synthetic model bearing a terminal CN− ligand†
Abhijit
Nayek‡
 a,
Subal
Dey‡
 a,
Suman
Patra
a,
Atanu
Rana
a,
Pauline N.
Serrano
b,
Simon J.
George
a,
Suman
Patra
a,
Atanu
Rana
a,
Pauline N.
Serrano
b,
Simon J.
George
 bd,
Stephen P.
Cramer
bcd,
Somdatta
Ghosh Dey
*a and
Abhishek
Dey
*a
aSchool of Chemical Science, Indian Association for the Cultivation of Science, Kolkata 700032, India. E-mail: icsgd@iacs.res.in; icad@iacs.res.in
bDepartment of Chemistry, University of California, Davis, CA 94616, USA
cPhysical Biosciences Division, Lawrence Berkeley National Laboratory, Berkeley, CA 94720, USA
dSETI Institute, 339 Bernardo Ave, Suite, 200 Mountain View, CA 94043, USA
First published on 1st January 2024
Abstract
An azadithiolate bridged CN− bound pentacarbonyl bis-iron complex, mimicking the active site of [Fe–Fe] H2ase is synthesized. The geometric and electronic structure of this complex is elucidated using a combination of EXAFS analysis, infrared and Mössbauer spectroscopy and DFT calculations. The electrochemical investigations show that complex 1 effectively reduces H+ to H2 between pH 0–3 at diffusion-controlled rates (1011 M−1 s−1) i.e. 108 s−1 at pH 3 with an overpotential of 140 mV. Electrochemical analysis and DFT calculations suggests that a CN− ligand increases the pKa of the cluster enabling hydrogen production from its Fe(I)–Fe(0) state at pHs much higher and overpotential much lower than its precursor bis-iron hexacarbonyl model which is active in its Fe(0)–Fe(0) state. The formation of a terminal Fe–H species, evidenced by spectroelectrochemistry in organic solvent, via a rate determining proton coupled electron transfer step and protonation of the adjacent azadithiolate, lowers the kinetic barrier leading to diffusion controlled rates of H2 evolution. The stereo-electronic factors enhance its catalytic rate by 3 order of magnitude relative to a bis-iron hexacarbonyl precursor at the same pH and potential.
Hydrogenases (H2ases) efficiently interconvert H+ to H2 with high turnover numbers (TONs) (102–5mol s−1).1,2 Based on the metal centers present at the active site of these metalloenzymes, three types of H2ases are known in nature – [Fe–Fe] H2ase, [Ni–Fe] H2ase and Fe-only H2ase.3,4 Among these, the [Fe–Fe] H2ases are more selective towards H2 generation, the [Ni–Fe] H2ases are selective for H2 oxidation while the Fe-only H2ases in the presence of a hydride acceptor/donor substrate reacts with H2 or produce H2.5,6 High-resolution X-ray crystal structure of the that [Fe–Fe] H2ase active site reveals that one of the iron centers of a Fe2S2(CO)3(CN)2 organometallic core (2Fe subsite) is attached to a [Fe4S4] cluster through a bridging cysteine (Scheme 1A and B).4,7,8 A key bismethyleneazadithiolate (ADT) moiety bridges between the two Fe centers of the Fe2S2(CO)3(CN)2 organometallic core. Each of the two iron centers are coordinated with one –CO ligand and one –CN− ligand.9,10 A –CO ligand bridges both of the iron centers (Scheme 1A and B).7,11 The catalytic cycle of [Fe–Fe] H2ases encompasses three primary oxidation states. These include Hox (oxidized), characterized by a Fe(I)–Fe(II)[Fe4S4]2+ state;12,13 Hred (reduced), denoting a Fe(I)–Fe(I)[Fe4S4]2+ state; and Hsred (super reduced), which manifests as a Fe(I)–Fe(I)[Fe4S4]+ state.14–16 The unique catalytic capability of the H-cluster is attributed, among other factors, to a distinctive arrangement known as the rotated structure. This configuration introduces a vacant site at the distal iron (Fed) atom.17–21 The proposed mechanism suggests that the initial protonation occurs at the bridgehead nitrogen atom of the Fe(I)–Fe(I) state within the enzyme.14,22 A critical step in this process involves a proton relay from the bridgehead –NH group to the distal iron atom (Fed). This step is considered pivotal in the formation of a terminal hydride species with a amine form of the ADT bridgehead, Hhyd, which is characterized as a superoxidized diiron site with Fe(II)–Fe(II) state.23–27 Substrates (H+/H2) along with the inhibitors like O2 and CO, binding occurs at the distal iron centre (Fed).17,20 The synthesis and characterization of [Fe–Fe] H2ase mimic has become a rapidly growing area of research.28–37 A large number of [Fe–Fe] H2ase active site analogues have been synthesized mimicking several structural aspects of the active site and several details of electronic structure and its contribution to reaction mechanism have been elucidated.30,31,37–41 In particular, the role of the μ-CO ligand and the rotated structure of the core has been a matter of great interest. After the initial report of a transient –CO bridged Fe(I)–Fe(II) complex,42 synthetic model complexes with μ-CO ligands have been reported.28,39,43 Similarly, mimics of 2Fe subsite with CN− ligands and Lewis acid capped CN− ligands have been reported (Scheme 1C–L).44–54
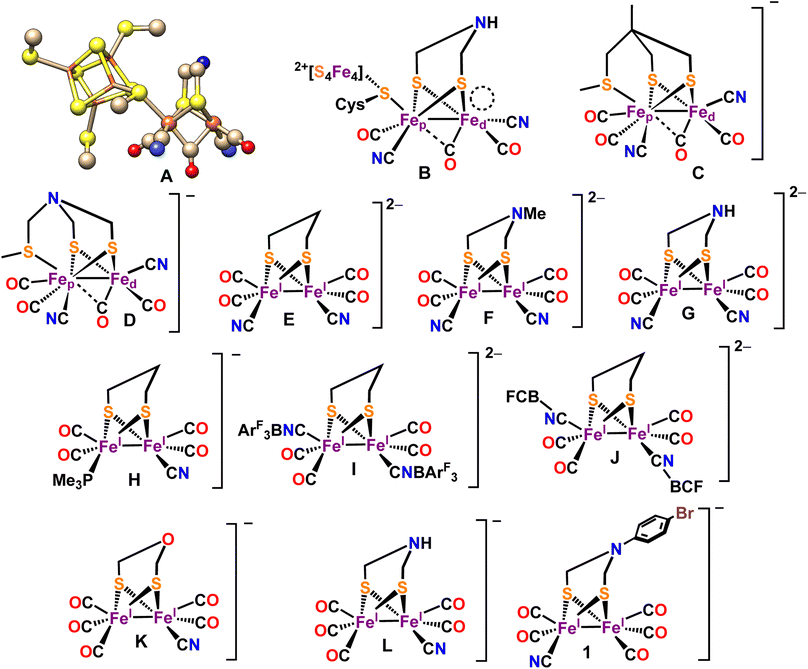 | ||
| Scheme 1 (A) X-ray crystal structure of the “H-cluster” in the Hox state in [Fe–Fe]-H2ase (PDB ID: 3C8Y62). (B) Chem Draw representation of the active site of [Fe–Fe]-H2ase. The vacant site at the distal iron atom is indicated by a circular ring. Reported [Fe–Fe] H2ase synthetic mimics bearing-CN ligands in Hrest (C–L). New synthetic mimic of [Fe–Fe] H2ase [BrC6H4N(CH2S)2Fe2(CO)5CN−] (1). | ||
Lately, there has been several reports that it's possible to activate the [Fe–Fe] H2ases enzyme by introducing synthetic complexes with –CN− ligands to the apo-enzyme (which has different bridging dithiolate ligands).55–60 Recently, the formation of a miniaturized [Fe–Fe] H2ases incorporating –CN− ligands, has been reported. This model is generated through the combination of an oligopeptide binding [Fe4S4] cluster and an organometallic Fe complex, and its formation has been scrutinized using various spectroscopic techniques.61 The electrocatalytic and photocatalytic behaviour for some of these synthetic analogues of [Fe–Fe] H2ases were reported mostly in organic solvents.46,61,63–69 In a report by our group, a synthetic model p-BrC6H4N(CH2S)2Fe2CO6 was shown to be a very efficient catalyst for HER under aqueous condition.70 This catalyst exhibited TON and TOF of >>108 and 6400 s−1 at 440 mV overpotential. Following this, several recent reports of HER by Fe2S2(CO)6 complexes have appeared in the literature.71–73 The same p-BrC6H4N(CH2S)2Fe2CO6 model has been used to investigate the mechanism of degradation of the Fe2S2(CO)6 cluster in the presence of O2.74 Using these insights synthetic analogues of [Fe–Fe] H2ases which could catalyze HER in the presence of O2 were developed.75 However, these complexes did not bear terminal CN− ligands present in the active site of H2ase which plays a major role in the reactivity of [Fe–Fe] H2ase.47,76 Synthetic models bearing terminal CN− ligands have been reported and their ability to catalyze HER has been evaluated.47,52,53,77–79 However, these complexes decomposed in the presence of acid via protonation of the electron rich CN− ligand and produced sub-stoichiometric H2.80 Thus, the role of CN− ligand in HER catalysis remains unexplored in synthetic models.
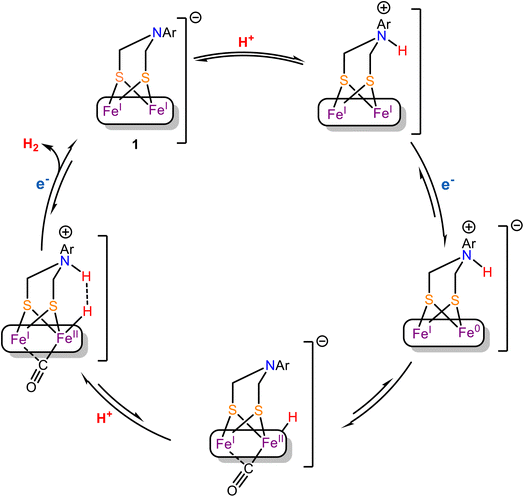
In this manuscript, we have substituted a terminal –CO of a synthetic mimic p-BrC6H4N(CH2S)2Fe2(CO)6 by a CN− leading to a ADT bridge synthetic mimic of the Hred state, [Et4N]+[BrC6H4N (CH2S)2Fe2(CO)5CN]− (1, Scheme 1). The geometric and electronic structure of complex 1 is elucidated by EXAFS, FTIR, ESI-MS, Mössbauer, 1H-NMR and DFT calculations. The heterogeneous electrochemical hydrogen production with the complex 1 has been investigated in dil. H2SO4 (pH ≤ 3) solution and the results indicate hydrogen production at very low overpotential with very high turnover rates orders of magnitude greater than those obtained for the precursor complex which does not bear the terminal CN− ligand. While the CN− ligand, remaining intact during electrolysis both in aqueous and organic solvents, shifts the reduction potentials more cathodic, it activates the Fe(I)–Fe(0) state for HER catalysis which results in a much lower overpotential for HER relative to the precursor complex which requires reduction to the Fe(0)–Fe(0) state for HER catalysis.
Results and analysis
Synthesis and characterization
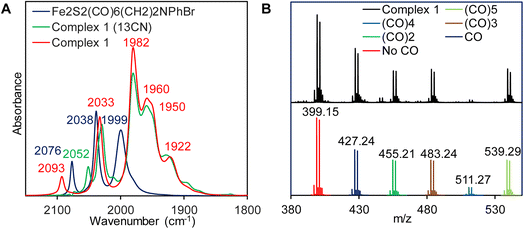
Complex 1 is synthesized via modification of a previously reported literature method.52 Addition of 1.25 eq. of Et4NCN under dark to the precursor complex p-BrC6H4N(CH2S)2Fe2(CO)6 in dry acetonitrile led to gradual change of color from red to reddish brown (Scheme 2). FTIR spectrum was measured after 7–8 h. That showed disappearance of vibrations for the precursor complex and appearance of several new vibrations, especially 2093 cm−1 band (Fig. 1A, red). The band gradually increased in intensity and the final product was isolated after 24 h. The detailed experimental procedure is described in the ESI.† The composition of the product was determined using 1H-NMR (Fig. S10†), 13C-NMR (Fig. S11†), elemental analysis, negative mode Mass spectrometry (Fig. 1B) and Mössbauer spectroscopy (Fig. 2B). In particular, the mass spectrum showed a fragmentation pattern consistent with the loss of five –CO ligands present in the complex (Fig. 1B). Complex 1 showed λmax at 358 nm with weaker transitions at 529 nm, 428 nm and 286 nm (Fig. S1†). The transitions below 400 nm likely represent Fe → CO MLCT transitions. On replacing one CO in p-BrC6H4N(CH2S)2Fe2(CO)6 complex with CN− in complex 1, these Fe → CO MLCT transitions were shifted to lower energies. This is consistent with increase in the d manifold due to reduction of Zeff because of the CN− ligation.The p-BrC6H4N(CH2S)2Fe2CO6 complex showed characteristic C–Ο vibrations at 2076, 2038 and 1999 cm−1 (Fig. 1A, blue). These vibrations were shifted to lower energies to 2033, 1982, 1960, 1950 and 1922 cm−1 in complex 1 (Fig. 1A, red). The terminal νCO vibrations of the CN− bound complex 1 were red shifted relative to the neutral complex which indicates enhanced Fe–CO back bonding in the anionic complex relative the neutral complex. The presence of a terminal CN− ligand in complex 1 was inferred from the vibration at 2093 cm−1 in the FTIR which shift to lower wavenumbers upon incorporation of 13CN− to 2052 cm−1 (Fig. 1A, green). These results are well in agreement with the previously reported synthetic models of H2ases bearing terminal CN− ligand and attributes complex 1 as terminally bound mono CN− substituted pentacarbonylated [2Fe]-subsite models.50,81,82
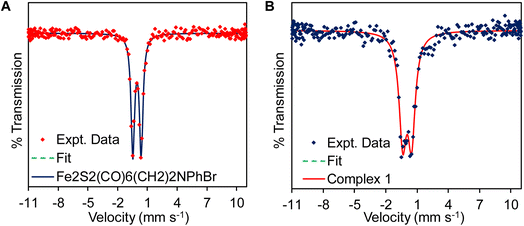
The presence of –CN− in complex 1 was also suggested by Mössbauer spectroscopy (Fig. 2) of the precursor complex and complex 1. The precursor complex has an isomer shift (δiso) and quadruple splitting (ΔEQ) of −0.051 mm s−1 and 0.846 mm s−1 consistent with a Fe(I)–Fe(I) electronic structure description.83 The δiso and ΔEQ for complex 1 is 0.05 mm s−1 and 0.85 mm s−1, respectively. Due to the presence of anionic –CN− in complex 1, the electron density in the diiron cluster increases and as a result the δiso of the complex 1 shift to slightly more positive values (Fig. 2B and Table 1) compared to the precursor complex, Fe2S2(CO)6(CH2)2NPhBr (Fig. 2A and Table 1). These results are consistent with the previous reported values of –CN bound complexes.49,83
| Mössbauer parameters | Fe2S2(CO)6(CH2)2NPhBr | Complex 1 |
|---|---|---|
| δ iso (mm s−1) | −0.051 ± 0.003 | 0.05 ± 0.01 |
| ΔEQ (mm s−1) | 0.846 ± 0.001 | 0.85 ± 0.01 |
In order to obtain structural parameters, several attempts to grow X-ray suitable single crystal were unsuccessful. Hence, EXAFS data of an acetonitrile solution of complex 1 are obtained at the Fe K-edge. The Fourier transform spectrum is dominated by 3 sets of peaks (Fig. 3). The strong peak at about 2.28 Å fits well to an average of 2 Fe–S interactions per Fe. At shorter distance, the peaks around 1.7–1.9 Å arise from Fe–C interactions. Detailed fitting reveals that these interactions can be separated into 2 groups, with about half occurring at an average of 1.74 Å, and the rest averaging about 1.89 Å, indicating that apart from the Fe–CN some of the Fe–CO's have longer Fe–C bond lengths. A scattering from the nitrogen of the CN− ligand can be clearly picked up at 3.1 Å, indicating the presence of the CN− ligand. Finally, the analysis indicates the presence of a Fe–Fe interaction at 2.49 Å (Table 2).
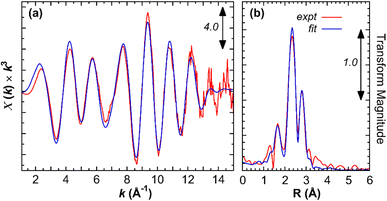 | ||
| Fig. 3 Fe K-edge EXAFS spectra of complex 1. (a) EXAFS data (red) and fit (blue). (b) Corresponding Fourier transform spectra. | ||
| Interaction | N | R (Å) | σ 2 (Å2) | ΔE0 (eV) |
|---|---|---|---|---|
| a N = Number of backscattering atoms; R = distance; σ2 = Debye–Waller factor; ΔE0 = threshold energy. In this fit, the backscatter atom numbers (N) are fixed to the values expected for the model while R, σ2, and ΔE0 are floated. Threshold energies (ΔE0) are constrained to be the same for all components. The estimated uncertainties in R σ2, and ΔE0 are shown in parentheses. Parameters without uncertainties in parentheses were not floated in the given fit. The scale factor used was 1.0. Phase and amplitudes were calculated using FEFF8.42. | ||||
| Fe–S | 2.0 | 2.280 (0.003) | 0.0049 (0.0002) | −8.7(0.3) |
| Fe–C | 1.5 | 1.738 (0.004) | 0.0030 (0.0003) | |
| 1.5 | 1.878 (0.005) | 0.0031 (0.0005) | ||
| Fe–O (CO) | 2.0 | 2.916 (0.003) | 0.0045 (0.0002) | |
| Fe–N | 0.5 | 3.106 (0.009) | 0.0020 (0.0002) | |
| Fe–Fe | 1.0 | 2.489 (0.002) | 0.0037 (0.0006) | |
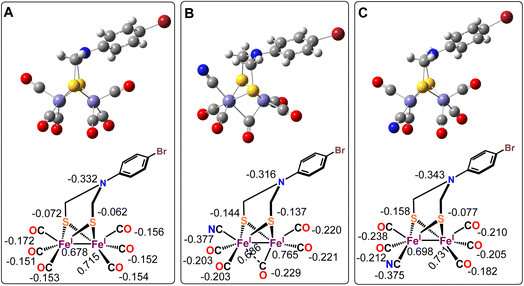
Geometry optimized density functional theory (DFT)84–86 calculations are used to deduce a possible three-dimensional structure of the complex 1 pre-assuming the fact that the complex bears five –CO and a –CN− ligand along with the ADT as indicated from the above spectroscopic characterizations.55,87,88 DFT calculations were used to validate the experimentally obtained structural and vibrational features to emulate the feasibility of -axial and -equatorial conformers (Fig. 4B and C) (where the CN− ligand is either -axial or -equatorial with respect to the plane defined by the ADT moiety, i.e. Fe2S2 plane) (Fig. 4). The calculations at this level could reproduce the three-dimensional geometry and vibrational frequencies of the precursor complex reasonably (Table 3).70 These calculations indicate that while both the conformers result in stable geometries and the optimized Fe–C, Fe–S distances are in reasonable agreement with the EXAFS data (Table 3). However, while the Fe–Fe distance in the -equatorial conformer (Fig. 4C) is 2.51 Å and agrees well with the experimental value of 2.49 Å, the Fe–Fe distance of the -axial-conformer is 2.57 Å and does not match the EXAFS data. Additionally, the -axial conformer (Fig. 4B) leads to a μ-CO ligand with νCO at 1840 cm−1 (Table 3) which is not consistent with the experimentally observed spectrum of complex 1 (Fig. 1A, red). Thus, based on the concurrence between the experimental data and the DFT calculated structure and vibrational properties we conclude that the -equatorial conformer of complex 1 (Fig. 4C) is the dominating species in solution.
| Structure | Bond length (Å) | IR stretching (cm−1) | ||||
|---|---|---|---|---|---|---|
| Fe–CO | Fe–CN | Fe–Fe | Fe–S | ν CO | ν CN | |
| a The synthesized complex 1. b Values were obtained from EXAFS data. c Experimentally obtained IR stretching frequencies in CH3CN solution. d Values were obtained from XRD data. | ||||||
| axial-CN− (4B) | 1.74 (COt) 1.80, 2.11 (COb) | 1.90 | 2.57 | 2.35 | 1840, 1934, 1965, 1979, 2015 | 2102 |
| Equatorial-CN− (4C) | 1.74 | 1.90 | 2.51 | 2.29 | 1928, 1946, 1962, 1978, 2020 | 2114 |
| 1a | 1.74b | 1.88b | 2.49b | 2.28b | 1922c, 1950c, 1960c, 1982c, 2033c | 2093c |
| p-BrC6H4N(CH2S)2Fe2CO6 (4A) | 1.79d | NA | 2.50d | 2.26d | 1999c, 2038c, 2076c | NA |
| 1.77 | NA | 2.48 | 2.29 | 2005, 2032, 2066 | ||
The calculated Mulliken charges indicate that the –CO ligands in the precursor Fe2S2(CO)6(CH2)2NPhBr complex (Fig. 4A) bears overall negative charge suggesting that there is significant back bonding from the occupied orbitals into the unoccupied CO π* orbitals. On –CN− incorporation (i.e. -axial- and equatorial-CN−) the amount of negative charge delocalized into the –CO ligands increase. This implies stronger back donation into the –CO π* orbitals when CN− ligand is introduced. The total charge on the CN− ligand is −0.377 and −0.375 for -axial- and -equatorial-CN−, respectively, indicating that most of the negative charge of the CN− ligand is shifted into the cluster; mostly into the –CO ligands (Fig. 4B and C) as suggested by lowering of νCO vibrations in complex 1 relative to the precursor complex observed experimentally (Fig. 1A). Note that the Mulliken charge on the bridgehead N atom remains unaltered.
Electrocatalytic reduction of proton in aqueous medium under heterogeneous conditions on EPG
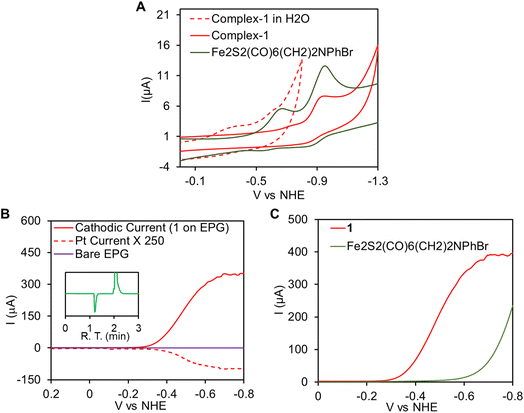
In aqueous solvent CV data indicate that the reduction of complex 1, upon immobilization onto EPG electrode, is observed at −0.35 V vs. NHE (Fig. 5A, red dashed line). This redox event is attributed to the Fe(I)–Fe(I)/Fe(I)–Fe(0) process and the area under the CV response indicate 2.25 ± 0.25 × 10⁻¹² mol cm−2 electrochemically active complex 1 present on the EPG. Note that while the Fe(I)–Fe(I)/Fe(I)–Fe(0) is −0.76 V in an organic solvent like CH3CN (Fig. 5A, red)), it is demonstrated to shift to considerable higher potentials at −0.35 V vs. NHE (Fig. 5A, dashed red) in aqueous medium due to enhanced solvation of the negatively charged species produced upon reduction by water as was observed for the precursor complex.70,90 Electrocatalytic hydrogen evolution (HER) by immobilized 1 was investigated in aq. H2SO4 solution by linear sweep voltammetry (LSV). Subsequently, rotating ring disk electrochemistry (RRDE) set up fitted with a Pt-ring encircling the working EPG electrode allowed us in situ detection of the hydrogen,91 produced by the working electrode on sweeping from positive to negative potential. In 0.002 N H2SO4 (pH ∼2.7) solutions, scanning from 0.2 V to −0.8 V with scan rate 50 mV s−1 at 300 rpm rotation speed, a large catalytic current was observed with an onset at −0.3 V (Icat = 100 μA) and it reached to a maximum value at −0.65 V (Fig. 5B, red). The hydrogen production was concomitantly detected by the Pt-ring, held at a constant potential 0.7 V where it re-oxidized the H2, produced by the working electrode and radially diffuses out to this encircling Pt ring, to H+ generating an oxidation current (Fig. 5B, red dashed line).91 No such catalytic current was observed on a bare EPG electrode under identical condition (Fig. 5B, purple). This indicates electrocatalytic hydrogen production by complex 1. For further confirmation, controlled potential electrolysis (CPE) was performed at −0.4 V vs. NHE in a gas tight two compartment water jacketed cell and the produced gases were characterized by the head space analysis of the cathodic compartment in gas chromatography fitted with thermal conductivity detector (GC-TCD) where H2 was identified (Fig. 5B, inset, green trace). The HER activity of 1 was compared with its precursor complex p-BrC6H4N(CH2S)2Fe2CO6i.e., without a CN− ligand. The LSV data (Fig. 5C, red) indicate that 1 catalyses HER with 350 mV lower onset potential than the precursor complex in 0.002 N H2SO4 solution (Fig. 5C, olive green). This is because while 1 catalyses HER from is Fe(I)–Fe(0) state, the precursor p-BrC6H4N(CH2S)2Fe2CO6 complex catalyzes HER from its Fe(0)–Fe(0) state. Thus, inclusion of CN− leads to higher pKa of the cluster such that the one electron reduced Fe(I)–Fe(0) state can be protonated and reduction to the two electron reduced Fe(0)–Fe(0) state can be avoided.
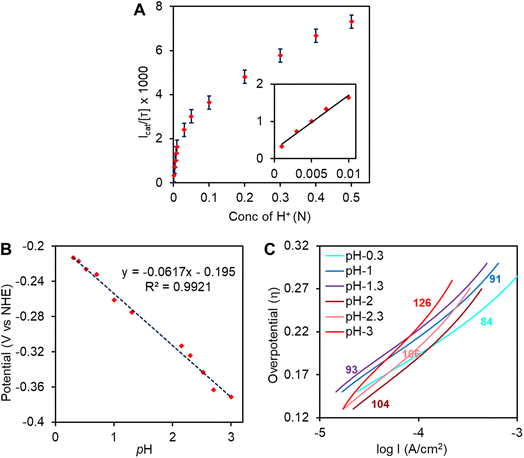
To characterize the catalytic ability of complex 1 turn over number (TON), turn over frequency (TOF), faradaic yield (FY) and overpotential (η) of HER are determined. The FY for HER was determined by performing controlled potential electrolysis (CPE) at −0.4 V vs. NHE in 0.1 N H2SO4 (Fig. S6A, red†). Over a period of 1 hour, 9.43 C charge had been dispensed from the electrode (i.e., 9.7 × 10⁻⁵ moles) and concurrently ∼1 ml H2 gas was evolved during CPE. From these results, the FY is determined to be 92 ± 7%. No significant current was observed when bare EPG disc was tested under similar conditions (Fig. S6A,† green). Thus, the TON calculated for this catalyst during CPE is > 107 and the average TOF is ∼2230 s−1 at pH 1. This is very close to the value of ∼4000 s−1 determined from Icat/[τ] (ratio of catalytic current and CV current) experiments in 0.1 N of [H+] (Fig. 6A). The η of HER is determined from LSV data at 0.002 N [H+]. The standard potential for H2/H+ couple at this proton concentration is −0.16 V whereas onset of HER (Icat = 100 μA, area of electrode ∼0.1 cm2i.e. jcat = 1 mA cm−2 where j is the exchange current density) is −0.4 V. Hence, the onset overpotential is only about 0.24 V, which is one of the lowest overpotential for HER to be reported so far for any [Fe–Fe] H2ase inspired molecular catalyst in aqueous medium. The XPS data (Fig. S2†) and the ATR-IR (Fig. S6B†) data of the graphite electrode were collected after CPE and showed that the catalyst was stable over the CPE time scale. This is also implied by the constant slope of the current during CPE.
Mechanistic considerations
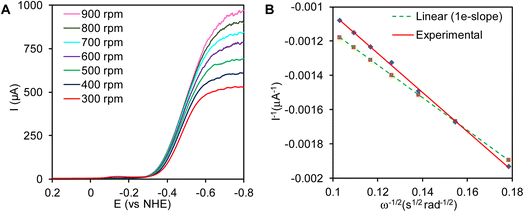
Koutecky–Levich analysis. Complex 1 reduces H+ at diffusion-controlled limit at low [H+] with overpotential of 0.24 V. The diffusion limited current has two components-
| Icat−1 = iK(E)−1 + iL−1 |
| iL = 0.62nFA[H+](DH+)2/3ω1/2ν−1/6 |
The plot of inverse of catalytic current, at −0.6 V vs. NHE where the current is mass transfer controlled, varied linearly with the inverse of the square root of the angular rotation rates (Fig. 7A). The plot of I−1vs. ω−1/2 was linear and the slope obtained from the experimental results was similar to the predicted slope for 1e− reduction process (Fig. 7B). This indicates that complex 1 reduces the H+, by one electron to 1/2 H2, i.e., H+ + e− → 1/2 H2
The potential dependent current iK(E) is obtained from the inverse of the intercept of the K–L plot and is expressed as,
| IK(E) = k[H+]nF[A][τ][H+] |
In the absence of in situ spectroscopic methods amenable to probe a catalyst heterogenized on graphite electrodes in operando, HER is organic solvents was investigated with the goal of identifying potential intermediates involved in HER using IR-SEC.
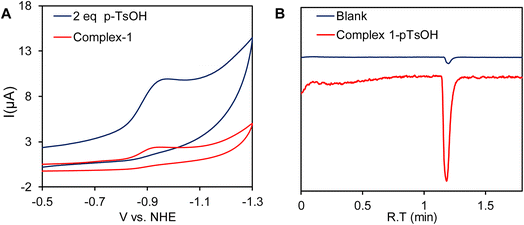
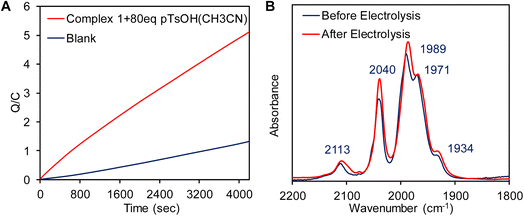
A catalytic current at similar potential was observed (Fig. 8A, blue line) in the presence of 2 equivalents of p-toluenesulfonic acid (pTsOH, pKa ≈ 8.3 in CH3CN)96 and the catalytic current increases significantly with sequential addition of pTsOH. The sharp increase in its current intensity indicates that complex 1 has the ability for the electrocatalytic reduction of protons to H2. To confirm this controlled potential electrolysis (CPE) was performed at −0.9 V vs. NHE of the 0.3 mM acetonitrile solution of complex 1 in the presence of 80 equivalent of p-toluenesulfonic acid (pTsOH) (Fig. 9A). The headspace gas analysis by GC-TCD confirmed the produced gas to be H2 (Fig. 8B, red trace). During the CPE 5.12 C charge was consumed over the course of 70 min (Fig. 9A) and 0.5 ml of H2 was evolved. From these results, the FY was determined to be 84% and the TON was calculated to be 15. In the absence of the catalyst no significant amount of H2 was produced under similar condition (Fig. 8B, blue trace). The FTIR spectra recorded before and after the CPE experiment confirmed that the catalyst is stable and also the CN− ligands are not protonated under these conditions as has been reported for di-cyano complexes (Fig. 9B).34
| Complex | IR stretching frequencies (cm−1) | |||
|---|---|---|---|---|
| Experimental (In CH3CN) | Theoretical (BP86) | |||
| ν CN | ν CO | ν CN | ν CO | |
| Complex 1 [Fe(I)–Fe(I)] | 2093 | 2033, 1982, 1960, 1950, 1922 | 2114 | 2020, 1978, 1962, 1946, 1928 |
| Complex 1 + pTsOH [Fe(I)–Fe(I)NH]+ | 2113 | 2040, 1989, 1971, 1961, 1934 | 2127 | 2042, 2009, 1989, 1962, 1955 |
| Complex 1 + pTsOH + (e−) [Fe(I)–Fe(II)t-H] | 2095 | 2036, 1976, 1950, 1923, 1876 | 2124 | 2013, 1986, 1964, 1929, 1861 |
| Complex 1 + pTsOD + (e−) [Fe(I)–Fe(II)t-D] | 2095 | 2036,1974, 1950, 1925, 1860 | 2124 | 2013, 1986, 1964, 1929, 1852 |
Reduction of complex 1 in the presence of 1 equivalent pTsOH did not result in red shift in the νCO and νCN vibrations (Fig. 11B, blue line) as would be expected for a reduction event in the cluster which would have increased back bonding to carbonyl and cyanide ligands. For example, reduction of the Fe(I)–Fe(I) of a ADT bound Fe2(CO)6 cluster accompanied with protonation of the ADT nitrogen is associated with >100 cm−1 red shift in the νCO.99 Specifically, one of the νCO vibrations red shifted significantly to 1876 cm−1 which is much lower than the other terminal νCO vibrations and would be consistent with a μCO formation during reduction in the presence of H+ source. Furthermore, the peak at 1876 cm−1 (Fig. 11B, blue line) appears to shift to 1860 cm−1 (Fig. 11B, green line) when pTsOD was used as a D+ source i.e., this νCO shows a H/D isotope effect. Note that a Fe–H vibration is expected to show a H/D isotope shift >570 cm−1 using simple harmonic oscillator approximation. Similarly, H/D shifts associated with hydrogen bonding to –CO ligands are very small.100 The shift observed here is 16 cm−1 which suggests that the species produced in IR-SEC is likely to be a metal hydride species where a νCO coupled to a νFe–H. Similar shift of a μ-CO due to coupling with a terminal hydride trans to it in [Fe–Fe] H2ases.27 There is some residual 1876 cm−1 peak in the deuterated solvent from residual H2O in the electrolyte.
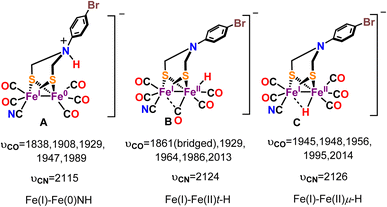 | ||
| Fig. 10 Probable one electron reduced protonated species and their computed νCO and νCN vibrational frequencies. | ||
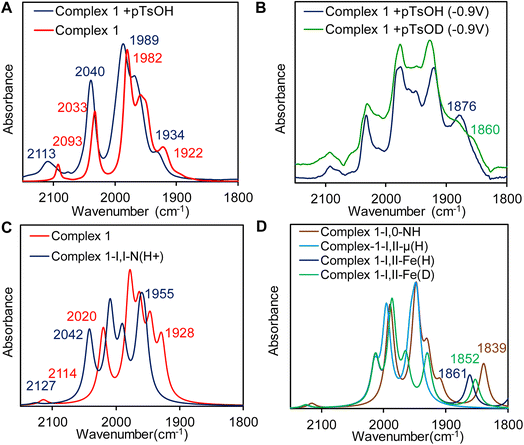 | ||
| Fig. 11 (A) FTIR spectra of complex 1 (red line) and complex 1 in the presence of 1 equivalent pTsOH (blue line). (B) IR-SEC data of complex 1 @ −0.9 V vs. NHE in the presence of pTsOH (blue line) and pTsOD (green line). (C) Computed vibrations of complex 1 (red line) and complex 1 presence of 1 equivalent of pTsOH (blue line) and pTsOD (green line). (D) Computed vibrations of model A (orange line), B (dark blue line) and C (blue line) (Fig. 10) and the deuterated form of model B (green line). | ||
Discussion
The EXAFS, Mössbauer and FTIR data of complex 1 is consistent with the presence of terminal cyanide ligand. Thus, along with the μ-ADT and the terminal CN− ligand, this model is a close structural analogue of the active site of the [Fe–Fe] H2ases. The presence of the CN− raises the basicity of the cluster in 1 such that HER current of the CN− bound form at higher pH's remarkably higher relative to the precursor complex. Under aqueous conditions, the 1st order dependence of the rate with [H+] at low acid concentrations suggest that binding of H+ is involved in rate determining step (rds). The 62 mV/pH slope of the pH vs. onset potential plot (Fig. 6B) suggest that proton coupled electron transfer (PCET) is operating at the potential determining step in the kinetic region.101,102 Now, protonation could occur either at the bridgehead N to generate reduced N-protonated species or at the reduced Fe-centre to form a Fe–H species (terminal or bridging).103 The Tafel slope is determined to be 126 mV dec−1 which is close to the value expected for Volmer mechanism implying the involvement of a Fe–H species in the rds.92–94 In an organic solvent (CH3CN), under homogeneous conditions, complex 1 catalyze HER at −0.9 V vs. NHE (Fig. 8A) and remains stable during CPE for more than an hour (Fig. 9). In situ FTIR-SEC provide preliminary evidence for a terminal hydride [Fe(I)–Fe(II)–H] with a μ-CO during catalysis whew the νCO shifts on deuteration due to coupling with a t-H in a fashion similar to that observed for [Fe–Fe] H2ase.27 The accumulation of the hydride species during HER in organic medium implies that its further protonation is likely the rds which is in line with the suggestions from Tafel slope obtained under aqueous conditions. However, the solvation energies of species involved in catalysis will be very different in aqueous and organic solvents and the mechanism may vary. To rationalize the sequence of events, we proposed that the mechanistic pathway proposed by Rauchfuss is at play here (Scheme 3) i.e. (i) In the presence of pTsOH, the complex 1 forms a N-protonated complex, (ii) the N-protonated complex 1 undergoes a one-electron reduction under electrochemical condition along with an intramolecular proton transfer from the bridge head nitrogen atom to the reduced Fe(I)–Fe(0) center to form the –CO bridged Fe(I)–Fe(II)t-H species. This step may be mediated by Fe(I)–Fe(0)NH species but the isomerization of it to Fe(I)–Fe(II)t-H may be too rapid to be observed in IR-SEC. (iii) The protonation of the [Fe(I)–Fe(II)–H] species in the rds then leads to H2 evolution.The CN− bound complex 1 exhibits the Fe(I)–Fe(I)/Fe(I)–Fe(0) E1/2 at −0.76 V in acetonitrile which is 140 mV more cathodic than the E1/2 for the same process of the neutral precursor p-BrC6H4N(CH2S)2Fe2CO6 complex; understandably the negative charge of the complex 1 shifted its E1/2 to more cathodic potential relative to its neutral precursor. However, complex 1 shows an onset for HER at ∼350 mV more positive potential in aqueous medium and exhibits significantly greater HER current at −0.5 V when compared to its precursor complex (Fig. 5C). The greater reactivity for HER of complex 1 result from the fact that its Fe(I)–Fe(0) state is active while for the precursor p-BrC6H4N(CH2S)2Fe2CO6 complex Fe(0)–Fe(0) state is active at these low acid concentrations. At a given potential (−0.5 V vs. NHE), the HER current is 103–4 times larger for complex 1 relative to its precursor at higher pHs (Fig. S5†). Thus, due to the presence of an anionic CN− ligand, the electron density of the Fe(I)–Fe(0) state of complex 1, is high enough to allow protonation of the Fe center.
A pertinent concern of employing a CN− ligand bound to an apparently weak Lewis acid, the reduced [Fe–Fe] cluster, under acidic conditions is the possibility of losing it via protonation.34 Both the XPS and IR data acquired before and after 1 h of electrolysis indicates that the ratio of carbonyl and CN− peaks remain constant i.e., CN− ligands are not preferentially protonated. This is since the electron density of the CN− ligand is strongly delocalized into the cluster due to the presence of the π accepting –CO ligands (Fig. 12, right). Similar stabilization of anionic ligand binding to a formally weak Lewis acid centre has been proposed for [Fe–Fe] H2ase and encountered in the mononuclear iron active site in Hmd where the –CO and acyl ligands facilitated the delocalization of the electron density of anionic ligands into the active site enhancing their binding affinities.1,76,104 The synthetic [Fe–Fe] clusters with terminal CN− ligand which were reported to decompose in the presence of acid had at least one of the terminal CO's replaced by weaker π acceptors like phosphine or CN− weakening the charge delocalization.34 Furthermore, the data obtained from both under aqueous and organic conditions indicate that protonation upon reduction forming the terminal Fe(I)–Fe(II)t-H species with a μ-CO is extremely fast occurring at diffusion controlled rates in aqueous medium. This minimizes the lifetime of Fe(I)–Fe(0) species during catalysis minimizing the possibility of CN− protonolysis during catalysis.
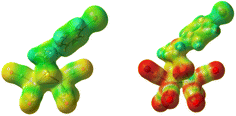 | ||
| Fig. 12 Electrostatic potential plots of the precursor-p-BrC6H4N(CH2S)2Fe2(CO)6 (left) and complex 1 (right). | ||
Conclusions
In summary, a synthetic model of the [Fe–Fe] H2ase bearing ADT and CN− terminal ligands is reported. The presence of CN− raises the pKa of the cluster allowing HER at mildly acidic pHs at extremely facile diffusion limited rates in aqueous medium. The electron donation from the CN− ligand enables the cluster to catalyze HER from its Fe(I)–Fe(0) state which results in a substantial lowering of overpotential associated with HER catalyzed by similar complexes but without the CN− ligand as these need to be reduced to their Fe(0)–Fe(0) states for them to be able to catalyze HER. In situ FTIR-SEC suggest the formation of a terminal hydride species via one electron reduction and protonation of the Fe(I)–Fe(I) cluster. Importantly, the CN− ligand is found to remain stable during these experiments.Data availability
All data associated with this publication are provided in the ESI.†Author contributions
A. N. synthesized the complex and performed characterization of the complex. A. N. and S. D. carried out electrochemical experiments and spectroscopic studies. S. P. and A. N. has performed the IR-SEC experiment. A. R. assisted in DFT-calculations. P. S., S. G. and S. P. recorded the EXAFS data. S. G. D. supervised the work and assisted in the data analyis. A. D. designed the project, assisted in the data analysis wrote the manuscript.Conflicts of interest
There are no conflicts to declare.Acknowledgements
A. N. thanks IACS for fellowship. S. P. acknowledge CSIR-SRF for fellowship. This work is funded by Department of Science and Technology, India, (DST/TMD/HFC/2K18/90) (A.D.), the US National Institutes of Health grant GM65440 (SPC) and the US DOE OBER (SPC). All X-ray spectroscopy was performed at the Stanford Synchrotron Radiation Light source (SSRL), a national user facility operated by Stanford University on behalf of the DOE OBES. The SSRL Structural Molecular Biology Program is supported by the DOE OBER, and the NIH, National Center for Research Resources, Biomedical Technology Program.References
- S. Dey, P. K. Das and A. Dey, Coord. Chem. Rev., 2013, 257, 42–63 CrossRef CAS.
- R. K. Thauer, A. R. Klein and G. C. Hartmann, Chem. Rev., 1996, 96, 3031–3042 CrossRef CAS PubMed.
- P. M. Vignais and B. Billoud, Chem. Rev., 2007, 107, 4206–4272 CrossRef CAS PubMed.
- J. C. Fontecilla-Camps, A. Volbeda, C. Cavazza and Y. Nicolet, Chem. Rev., 2007, 107, 4273–4303 CrossRef CAS PubMed.
- S. Shima and R. K. Thauer, Chem. Rec., 2007, 7, 37–46 CrossRef CAS PubMed.
- S. Rospert, J. Breitung, K. Ma, B. Schwörer, C. Zirngibl, R. K. Thauer, D. Linder, R. Huber and K. O. Stetter, Arch. Microbiol., 1991, 156, 49–55 CrossRef CAS PubMed.
- M. Y. Darensbourg, E. J. Lyon, X. Zhao and I. P. Georgakaki, Proc. Natl. Acad. Sci. U. S. A., 2003, 100, 3683–3688 CrossRef CAS PubMed.
- M. Frey, ChemBioChem, 2002, 3, 153–160 CrossRef CAS PubMed.
- Y. Nicolet, C. Piras, P. Legrand, C. E. Hatchikian and J. C. Fontecilla-Camps, Structure, 1999, 7, 13–23 CrossRef CAS PubMed.
- J. W. Peters, W. N. Lanzilotta, B. J. Lemon and L. C. Seefeldt, Science, 1998, 282, 1853–1858 CrossRef CAS PubMed.
- Y. Nicolet, A. L. de Lacey, X. Vernède, V. M. Fernandez, E. C. Hatchikian and J. C. Fontecilla-Camps, J. Am. Chem. Soc., 2001, 123, 1596–1601 CrossRef CAS PubMed.
- W. Lubitz, E. Reijerse and M. van Gastel, Chem. Rev., 2007, 107, 4331–4365 CrossRef CAS PubMed.
- C. V Popescu and E. Münck, J. Am. Chem. Soc., 1999, 121, 7877–7884 CrossRef.
- A. Adamska, A. Silakov, C. Lambertz, O. Rüdiger, T. Happe, E. Reijerse and W. Lubitz, Angew Chem. Int. Ed. Engl., 2012, 51, 11458–11462 CrossRef CAS PubMed.
- C. Lorent, S. Katz, J. Duan, C. J. Kulka, G. Caserta, C. Teutloff, S. Yadav, U.-P. Apfel, M. Winkler, T. Happe, M. Horch and I. Zebger, J. Am. Chem. Soc., 2020, 142, 5493–5497 CrossRef CAS PubMed.
- M. Haumann and S. T. Stripp, Acc. Chem. Res., 2018, 51, 1755–1763 CrossRef CAS PubMed.
- C. Sommer, A. Adamska-Venkatesh, K. Pawlak, J. A. Birrell, O. Rüdiger, E. J. Reijerse and W. Lubitz, J. Am. Chem. Soc., 2017, 139, 1440–1443 CrossRef CAS PubMed.
- M. W. Ratzloff, J. H. Artz, D. W. Mulder, R. T. Collins, T. E. Furtak and P. W. King, J. Am. Chem. Soc., 2018, 140, 7623–7628 CrossRef CAS PubMed.
- M. L. K. Sanchez, C. Sommer, E. Reijerse, J. A. Birrell, W. Lubitz and R. B. Dyer, J. Am. Chem. Soc., 2019, 141, 16064–16070 CrossRef CAS PubMed.
- J. A. Birrell, V. Pelmenschikov, N. Mishra, H. Wang, Y. Yoda, K. Tamasaku, T. B. Rauchfuss, S. P. Cramer, W. Lubitz and S. DeBeer, J. Am. Chem. Soc., 2020, 142, 222–232 CrossRef CAS PubMed.
- P. Rodríguez-Maciá, N. Breuer, S. DeBeer and J. A. Birrell, ACS Catal., 2020, 10, 13084–13095 CrossRef.
- P. Rodríguez-Maciá, K. Pawlak, O. Rüdiger, E. J. Reijerse, W. Lubitz and J. A. Birrell, J. Am. Chem. Soc., 2017, 139, 15122–15134 CrossRef PubMed.
- A. Silakov, B. Wenk, E. Reijerse and W. Lubitz, Phys. Chem. Chem. Phys., 2009, 11, 6592–6599 RSC.
- D. W. Mulder, Y. Guo, M. W. Ratzloff and P. W. King, J. Am. Chem. Soc., 2017, 139, 83–86 CrossRef CAS PubMed.
- E. J. Reijerse, C. C. Pham, V. Pelmenschikov, R. Gilbert-Wilson, A. Adamska-Venkatesh, J. F. Siebel, L. B. Gee, Y. Yoda, K. Tamasaku, W. Lubitz, T. B. Rauchfuss and S. P. Cramer, J. Am. Chem. Soc., 2017, 139, 4306–4309 CrossRef CAS PubMed.
- V. Pelmenschikov, J. A. Birrell, C. C. Pham, N. Mishra, H. Wang, C. Sommer, E. Reijerse, C. P. Richers, K. Tamasaku, Y. Yoda, T. B. Rauchfuss, W. Lubitz and S. P. Cramer, J. Am. Chem. Soc., 2017, 139, 16894–16902 CrossRef CAS PubMed.
- M. Winkler, M. Senger, J. Duan, J. Esselborn, F. Wittkamp, E. Hofmann, U.-P. Apfel, S. T. Stripp and T. Happe, Nat. Commun., 2017, 8, 16115 CrossRef CAS PubMed.
- C.-H. Hsieh, Ö. F. Erdem, S. D. Harman, M. L. Singleton, E. Reijerse, W. Lubitz, C. V Popescu, J. H. Reibenspies, S. M. Brothers, M. B. Hall and M. Y. Darensbourg, J. Am. Chem. Soc., 2012, 134, 13089–13102 CrossRef CAS PubMed.
- M. T. Olsen, M. Bruschi, L. De Gioia, T. B. Rauchfuss and S. R. Wilson, J. Am. Chem. Soc., 2008, 130, 12021–12030 CrossRef CAS PubMed.
- A. K. Justice, M. J. Nilges, T. B. Rauchfuss, S. R. Wilson, L. De Gioia and G. Zampella, J. Am. Chem. Soc., 2008, 130, 5293–5301 CrossRef CAS PubMed.
- A. T. Fiedler and T. C. Brunold, Inorg. Chem., 2005, 44, 9322–9334 CrossRef CAS PubMed.
- S. Amanullah, P. Saha, A. Nayek, M. E. Ahmed and A. Dey, Chem. Soc. Rev., 2021, 50, 3755–3823 RSC.
- V. Artero, G. Berggren, M. Atta, G. Caserta, S. Roy, L. Pecqueur and M. Fontecave, Acc. Chem. Res., 2015, 48, 2380–2387 CrossRef CAS PubMed.
- F. Gloaguen, J. D. Lawrence and T. B. Rauchfuss, J. Am. Chem. Soc., 2001, 123, 9476–9477 CrossRef CAS PubMed.
- J. T. Kleinhaus, F. Wittkamp, S. Yadav, D. Siegmund and U.-P. Apfel, Chem. Soc. Rev., 2021, 50, 1668–1784 RSC.
- T. B. Rauchfuss, Acc. Chem. Res., 2015, 48, 2107–2116 CrossRef CAS PubMed.
- C. Tard and C. J. Pickett, Chem. Rev., 2009, 109, 2245–2274 CrossRef CAS PubMed.
- T. Liu and M. Y. Darensbourg, J. Am. Chem. Soc., 2007, 129, 7008–7009 CrossRef CAS PubMed.
- J. M. Camara and T. B. Rauchfuss, Nat. Chem., 2012, 4, 26–30 CrossRef CAS PubMed.
- F. Gloaguen and T. B. Rauchfuss, Chem. Soc. Rev., 2009, 38, 100–108 RSC.
- A. Nayek, M. E. Ahmed, S. Samanta, S. Dinda, S. Patra, S. G. Dey and A. Dey, J. Am. Chem. Soc., 2022, 144, 8402–8429 CrossRef CAS PubMed.
- M. Razavet, S. J. Borg, S. J. George, S. P. Best, S. A. Fairhurst and C. J. Pickett, Chem. Commun., 2002, 700–701 RSC.
- M. E. Carroll, B. E. Barton, T. B. Rauchfuss and P. J. Carroll, J. Am. Chem. Soc., 2012, 134, 18843–18852 CrossRef CAS PubMed.
- A. Silakov, J. L. Shaw, E. J. Reijerse and W. Lubitz, J. Am. Chem. Soc., 2010, 132, 17578–17587 CrossRef CAS PubMed.
- O. F. Erdem, L. Schwartz, M. Stein, A. Silakov, S. Kaur-Ghumaan, P. Huang, S. Ott, E. J. Reijerse and W. Lubitz, Angew Chem. Int. Ed. Engl., 2011, 50, 1439–1443 CrossRef CAS PubMed.
- H. J. Redman, P. Huang, M. Haumann, M. H. Cheah and G. Berggren, Dalton Trans., 2022, 51, 4634–4643 RSC.
- Ö. F. Erdem, M. Stein, S. Kaur-Ghumaan, E. J. Reijerse, S. Ott and W. Lubitz, Chem.–A Euro. J., 2013, 19, 14566–14572 CrossRef PubMed.
- A. Silakov, M. T. Olsen, S. Sproules, E. J. Reijerse, T. B. Rauchfuss and W. Lubitz, Inorg. Chem., 2012, 51, 8617–8628 CrossRef CAS PubMed.
- A. Le Cloirec, S. P. Best, S. Borg, S. C. Davies, D. J. Evans, D. L. Hughes and C. J. Pickett, Chem. Commun., 1999, 1, 2285–2286 RSC.
- E. J. Lyon, I. P. Georgakaki, J. H. Reibenspies and M. Y. Darensbourg, Angew. Chem., Int. Ed., 1999, 38, 3178–3180 CrossRef CAS PubMed.
- F. Gloaguen, J. D. Lawrence, M. Schmidt, S. R. Wilson and T. B. Rauchfuss, J. Am. Chem. Soc., 2001, 123, 12518–12527 CrossRef CAS PubMed.
- C. Esmieu and G. Berggren, Dalton Trans., 2016, 45, 19242–19248 RSC.
- J. D. Lawrence, H. Li, T. B. Rauchfuss, M. Bénard and M.-M. Rohmer, Angew. Chem., Int. Ed., 2001, 40, 1768–1771 CrossRef CAS.
- B. C. Manor, M. R. Ringenberg and T. B. Rauchfuss, Inorg. Chem., 2014, 53, 7241–7247 CrossRef CAS PubMed.
- G. Berggren, A. Adamska, C. Lambertz, T. R. Simmons, J. Esselborn, M. Atta, S. Gambarelli, J.-M. Mouesca, E. Reijerse, W. Lubitz, T. Happe, V. Artero and M. Fontecave, Nature, 2013, 499, 66–69 CrossRef CAS PubMed.
- J. Esselborn, C. Lambertz, A. Adamska-Venkatesh, T. Simmons, G. Berggren, J. Noth, J. Siebel, A. Hemschemeier, V. Artero, E. Reijerse, M. Fontecave, W. Lubitz and T. Happe, Nat. Chem. Biol., 2013, 9, 607–609 CrossRef CAS PubMed.
- R. Gilbert-Wilson, J. F. Siebel, A. Adamska-Venkatesh, C. C. Pham, E. Reijerse, H. Wang, S. P. Cramer, W. Lubitz and T. B. Rauchfuss, J. Am. Chem. Soc., 2015, 137, 8998–9005 CrossRef CAS PubMed.
- J. F. Siebel, A. Adamska-Venkatesh, K. Weber, S. Rumpel, E. Reijerse and W. Lubitz, Biochemistry, 2015, 54, 1474–1483 CrossRef CAS PubMed.
- J. Esselborn, N. Muraki, K. Klein, V. Engelbrecht, N. Metzler-Nolte, U.-P. Apfel, E. Hofmann, G. Kurisu and T. Happe, Chem. Sci., 2016, 7, 959–968 RSC.
- A. Adamska-Venkatesh, S. Roy, J. F. Siebel, T. R. Simmons, M. Fontecave, V. Artero, E. Reijerse and W. Lubitz, J. Am. Chem. Soc., 2015, 137, 12744–12747 CrossRef CAS PubMed.
- C. Esmieu, M. Guo, H. J. Redman, M. Lundberg and G. Berggren, Dalton Trans., 2019, 48, 2280–2284 RSC.
- A. S. Pandey, T. V Harris, L. J. Giles, J. W. Peters and R. K. Szilagyi, J. Am. Chem. Soc., 2008, 130, 4533–4540 CrossRef CAS PubMed.
- J. C. Lansing, J. M. Camara, D. E. Gray and T. B. Rauchfuss, Organometallics, 2014, 33, 5897–5906 CrossRef CAS PubMed.
- D. J. Crouthers, J. A. Denny, R. D. Bethel, D. G. Munoz and M. Y. Darensbourg, Organometallics, 2014, 33, 4747–4755 CrossRef CAS.
- M. Wang, L. Chen and L. Sun, Energy Environ. Sci., 2012, 5, 6763–6778 RSC.
- B. Kumar, M. Beyler, C. P. Kubiak and S. Ott, Chem.–A Euro. J., 2012, 18, 1295–1298 CrossRef CAS PubMed.
- R. Mejia-Rodriguez, D. Chong, J. H. Reibenspies, M. P. Soriaga and M. Y. Darensbourg, J. Am. Chem. Soc., 2004, 126, 12004–12014 CrossRef CAS PubMed.
- G. Si, W.-G. Wang, H.-Y. Wang, C.-H. Tung and L.-Z. Wu, Inorg. Chem., 2008, 47, 8101–8111 CrossRef CAS PubMed.
- C. Esmieu and G. Berggren, Dalton Trans., 2016, 45, 19242–19248 RSC.
- S. Dey, A. Rana, S. G. Dey and A. Dey, ACS Catal., 2013, 3, 429–436 CrossRef CAS.
- F. Quentel, G. Passard and F. Gloaguen, Energy Environ. Sci., 2012, 5, 7757–7761 RSC.
- C. Di Giovanni, W. A. Wang, S. Nowak, J. M. Grenèche, H. Lecoq, L. Mouton, M. Giraud and C. Tard, ACS Catal., 2014, 4, 681–687 CrossRef CAS.
- S. Ott, M. Kritikos, B. Åkermark, L. Sun and R. Lomoth, Angew. Chem., Int. Ed., 2004, 43, 1006–1009 CrossRef CAS PubMed.
- S. Dey, A. Rana, D. Crouthers, B. Mondal, P. K. Das, M. Y. Darensbourg and A. Dey, J. Am. Chem. Soc., 2014, 136, 8847–8850 CrossRef CAS PubMed.
- M. E. Ahmed, S. Dey, M. Y. Darensbourg and A. Dey, J. Am. Chem. Soc., 2018, 140, 12457–12468 CrossRef CAS PubMed.
- H. J. Redman, P. Huang, M. Haumann, M. H. Cheah and G. Berggren, Dalton Trans., 2022, 51, 4634–4643 RSC.
- J. T. Kleinhaus, F. Wittkamp, S. Yadav, D. Siegmund and U.-P. Apfel, Chem. Soc. Rev., 2021, 50, 1668–1784 RSC.
- T. B. Rauchfuss, Acc. Chem. Res., 2015, 48, 2107–2116 CrossRef CAS PubMed.
- C. A. Boyke, J. I. van der Vlugt, T. B. Rauchfuss, S. R. Wilson, G. Zampella and L. De Gioia, J. Am. Chem. Soc., 2005, 127, 11010–11018 CrossRef CAS PubMed.
- F. Gloaguen, J. D. Lawrence and T. B. Rauchfuss, J. Am. Chem. Soc., 2001, 123, 9476–9477 CrossRef CAS PubMed.
- A. Le Cloirec, S. C. Davies, D. J. Evans, D. L. Hughes, C. J. Pickett, S. P. Best and S. Borg, Chem. Commun., 1999, 2285–2286 RSC.
- F. Gloaguen, J. D. Lawrence, M. Schmidt, S. R. Wilson and T. B. Rauchfuss, J. Am. Chem. Soc., 2001, 123, 12518–12527 CrossRef CAS PubMed.
- L. C. Song, Z. Y. Yang, H. Z. Bian and Q. M. Hu, Organometallics, 2004, 23, 3082–3084 CrossRef CAS.
- A. D. Becke, Phys. Rev. A, 1988, 38, 3098–3100 CrossRef CAS PubMed.
- A. D. Becke, J. Chem. Phys., 1993, 98, 5648–5652 CrossRef CAS.
- J. P. Perdew, Phys. Rev. B, 1986, 33, 8822–8824 CrossRef PubMed.
- A. Adamska-Venkatesh, D. Krawietz, J. Siebel, K. Weber, T. Happe, E. Reijerse and W. Lubitz, J. Am. Chem. Soc., 2014, 136, 11339–11346 CrossRef CAS PubMed.
- S. J. Borg, J. W. Tye, M. B. Hall and S. P. Best, Inorg. Chem., 2007, 46, 384–394 CrossRef CAS PubMed.
- B. Sieklucka, R. Dziembaj and S. Witkowski, Inorg. Chim. Acta, 1991, 187, 5–8 CrossRef CAS.
- B. Mondal, K. Sengupta, A. Rana, A. Mahammed, M. Botoshansky, S. Ghosh Dey, Z. Gross and A. Dey, Inorg. Chem., 2013, 52, 3381–3387 CrossRef CAS PubMed.
- A. Le Goff, V. Artero, B. Jousselme, P. D. Tran, N. Guillet, R. Métayé, A. Fihri, S. Palacin and M. Fontecave, Science, 2009, 326, 1384–1387 CrossRef CAS PubMed.
- A. Lasia, Int. J. Hydrogen Energy, 2019, 44, 19484–19518 CrossRef CAS.
- T. Shinagawa, A. T. Garcia-Esparza and K. Takanabe, Sci. Rep., 2015, 5, 1–21 Search PubMed.
- J. O. Bockris and E. C. Potter, J. Electrochem. Soc., 1952, 99, 169 CrossRef CAS.
- M. K. Harb, U.-P. Apfel, J. Kübel, H. Görls, G. A. N. Felton, T. Sakamoto, D. H. Evans, R. S. Glass, D. L. Lichtenberger, M. El-khateeb and W. Weigand, Organometallics, 2009, 28(23), 6666–6675 CrossRef CAS.
- V. Fourmond, P.-A. Jacques, M. Fontecave and V. Artero, Inorg. Chem., 2010, 49, 10338–10347 CrossRef CAS PubMed.
- A. Aster, S. Wang, M. Mirmohades, C. Esmieu, G. Berggren, L. Hammarström and R. Lomoth, Chem. Sci., 2019, 10, 5582–5588 RSC.
- J. A. Wright, L. Webster, A. Jablonskytė, P. M. Woi, S. K. Ibrahim and C. J. Pickett, Faraday Discuss., 2011, 148, 359–371 RSC.
- M. E. Ahmed, A. Nayek, A. Križan, N. Coutard, A. Morozan, S. Ghosh Dey, R. Lomoth, L. Hammarström, V. Artero and A. Dey, J. Am. Chem. Soc., 2022, 144, 3614–3625 CrossRef CAS PubMed.
- J. A. Birrell, V. Pelmenschikov, N. Mishra, H. Wang, Y. Yoda, K. Tamasaku, T. B. Rauchfuss, S. P. Cramer, W. Lubitz and S. DeBeer, J. Am. Chem. Soc., 2020, 142, 222–232 CrossRef CAS PubMed.
- J. Rosenthal and D. G. Nocera, Acc. Chem. Res., 2007, 40, 543–553 CrossRef CAS PubMed.
- D. R. Weinberg, C. J. Gagliardi, J. F. Hull, C. F. Murphy, C. A. Kent, B. C. Westlake, A. Paul, D. H. Ess, D. G. McCafferty and T. J. Meyer, Chem. Rev., 2012, 112, 4016–4093 CrossRef CAS PubMed.
- B. E. Conway and B. V Tilak, Electrochim. Acta, 2002, 47, 3571–3594 CrossRef CAS.
- A. Dey, J. Am. Chem. Soc., 2010, 132, 13892–13901 CrossRef CAS PubMed.
Footnotes |
| † Electronic supplementary information (ESI) available. See DOI: https://doi.org/10.1039/d3sc05397k |
| ‡ These authors contributed equally to this work. |
| This journal is © The Royal Society of Chemistry 2024 |


