DOI:
10.1039/D4RA05442C
(Paper)
RSC Adv., 2024,
14, 29201-29214
Evaluation of optimized conditions for the adsorption of malachite green by SnO2-modified sugarcane bagasse biochar nanocomposites
Received
27th July 2024
, Accepted 26th August 2024
First published on 16th September 2024
Abstract
This work deals with the synthesis of SnO2-modified sugarcane bagasse biochar (SnO2-SBB) nanocomposites using an impregnation method. XRD, FTIR, SEM, and EDX analyses were used to characterize the produced nanocomposites. Several factors influencing the removal of malachite green from wastewater via the adsorption process were explored to maximize the effectiveness of this process. These factors included the different doses of nanocomposites, pH, temperature, contact time, etc. Studies on batch adsorption were conducted to examine the impact of operational parameters, such as contact time (5 to 30 minutes), adsorbent dosage (5 to 40 mg), pH (2 to 10), and temperature (303, 323, and 353 K), on the percentage of MG dye removal. The adsorption kinetics of MG dye over SnO2-SBB nanocomposites were evaluated with the aid of the Langmuir adsorption isotherm, which provided a good fit (R2 = 0.99) for pseudo-second-order kinetics. The thermodynamic parameters revealed spontaneous and exothermic adsorption of MG dye over SnO2-SBB nanocomposites. A maximum adsorption capacity (qmax) of 52.64 ± 0.03 for 0.3 SnO2-SBB and 73.86 ± 0.05 for 0.5 SnO2-SBB nanocomposites was observed. The newly synthesized SnO2-SBB nanocomposites showed negative zeta potential, which facilitated the adsorption of hydrated cationic dye molecules due to the electrostatic force of attraction.
1. Introduction
Malachite green is a chemical triarylmethane dye and has been extensively used in the pigment industry.1,2 Malachite green is a cationic dye, which means its positive charge allows it to attach to negatively charged molecules, thus providing the ability to attach to cell membranes and other cellular components.3,4 Malachite green has been used to dye cotton, silk, jute, leather, paper, and wool in addition to being a food coloring additive.5,6 It is well recognised that the use of malachite green dye has detrimental effects on the environment.7,8 The feeding habits and survival of fish may be impacted by decreased fertility, stunted growth rates, and birth abnormalities caused by even low concentrations of malachite green.9 Additionally, malachite green is harmful to soil microbes and can lower agricultural production and soil fertility.10 Moreover, it has the potential to contaminate groundwater supplies, rendering them unfit for agricultural or human use.11 Untreated wastewater discharged by industries contaminates surface and ground water with malachite green dye, which can have detrimental impacts on human health, including carcinogenesis, mutagenesis, and respiratory toxicity.12,13
The removal of dye molecules has been studied using a variety of water treatment methods, including advanced oxidation, membrane separation, ozonation, photocatalysis, coagulation, and electrochemical processes.14,15 Regarding their impact on human health and expense, each of these approaches has certain disadvantages. Due to its exceptional efficacy in removing dyes, ease of use, economic feasibility, high selectivity, and environmental friendliness, adsorption technique is considered more advantageous than alternative treatment approaches.16,17 Our previous reports were based on adsorption technique, which motivates this research work.18–30
The selection of an appropriate adsorbent for the effective removal of MG dye is very difficult. Adsorbents such as charcoal, activated carbon, clay, agricultural waste, zeolites, and functionalized chitosan are the most commonly studied. 31–33 When a significant volume of organic waste or mixture is thermally treated, thoroughly heated and decomposed, a heterogeneous, carbonaceous char known as biochar is produced.34 It has been discovered that biochar improves adsorption processes and possesses qualities, including catalytic activity, adsorption efficiency, high porosity, and high surface area.35,36 However, the low yield and reduced adsorption selectivity of these adsorbents severely restrict their usage. A promising new class of materials for eliminating malachite green from contaminated water is nanoadsorbents. Due to their huge specific surface area, large surface area to volume ratio, high porosity, and simplicity of functionalization are some of the adaptable qualities that make them ideal for the adsorption technique.37–40 Furthermore, the ability of nanoadsorbents to form multiple contacts with MG dye molecules, such as hydrogen bonding, hydrophobic, and electrostatic interactions, renders them efficacious for extraction applications.41 Materials containing tin(IV) oxide have recently drawn much interest due to their possible use in treating industrial effluent.42 The superior adsorption and catalytic qualities of tin(IV) oxide materials may effectively remove several pollutants, such as organic dyes, heavy metals, and colors.42 Tin(IV) oxide nanoparticles possess distinct surface chemistry and large surface areas that provide effective adsorption and reactivity with contaminants, which successfully remove them from wastewater. A combination of hydrophobic and electrostatic interactions drives the efficient adsorption of organic substances, such as dyes, phenols, and organic solvents.42 The capacity of tin(IV) oxide for regeneration and reusability is one of its benefits as an adsorbent. An exhaustive literature survey revealed that several researchers have worked on the removal of malachite green dye with different adsorbents. The cationic dye malachite green was adsorbable from an aqueous solution by Ben et al. using polyaniline-functionalized cobalt phosphate,43 which had an adsorption capacity of roughly 185 mg g−1. Even after five cyclic runs, the nanocomposite can be renewed by washing it with ethanol and a high stabilizer. Hydrogen bonding, π–π interaction, and electrostatic interactions were followed for malachite green adsorption. Malachite green removal using biochar produced by Pinus patula biomass micro-gasification was investigated by Rubio-Clemente et al. 44 The findings demonstrated that once it achieved equilibrium, the biochar produced from wood chips had a greater potential to adsorb MG dye than the biochar produced from the gasification of wood pellets. In a thorough review article, Ali et al. reported on the latest developments in biochar usage as a successful remover of malachite green dye.45 Numerous methods for producing biochar have been documented, such as gasification, pyrolysis, hydrothermal liquefaction, and carbonization. Additionally, different factors affecting the adsorption of malachite green have been explained. To remove malachite green from an aqueous solution, Hamad et al. created nano-bentonite, a unique hybrid MgO-impregnated clay, and fungal composites.46 The synthesized adsorbent was optimized using response surface methods to obtain the simultaneous maximal removal of malachite green. Compared to pure bentonite and nano-bentonite, the results show that MgO-impregnated clay has a greater MG adsorption capability. Khalatbary et al. developed a very effective and environmentally acceptable nanoadsorbent created using natural cellulose and waste tires (γ-Fe2O3/MWCNTs/cellulose) using the chemical vapor deposition method47 for the removal of malachite green from aqueous solutions. The results showed that γ-Fe2O3/MWCNTs/cellulose had the maximum malachite green adsorption capability (47.61 mg g−1). The adsorption process is exothermic and spontaneous, as shown by the thermodynamic data.
Thus, in the current research work, attempts have been made to synthesize SnO2-modified sugarcane bagasse biochar nanocomposites to enhance the adsorption efficiency of malachite green in waste water. Through the adjustment of various parameters, the optimized conditions were investigated. Assessing the impact of slight variations in tin(IV) oxide concentration on adsorption efficiency is the primary goal of this work.
2. Materials and methods
2.1. Chemicals
SnO2 was acquired from the chemical laboratory of CDH, India. Sugarcane bagasse was collected from a neighbouring juice shop. MG dye, hydrochloric acid (HCl) and sodium hydroxide (NaOH) were supplied by Fischer Scientific India Pvt, Ltd. Every experiment was carried out using deionized water.
2.2. Preparation of sugarcane bagasse biochar (SBB)
The collected sugarcane bagasse was washed with water and then dried in the sun for 48 hours. The dried sugarcane bagasse was ground in a mixer and then sieved. By pyrolyzing sugarcane bagasse at 500 °C for two hours at a rate of 10 °C per minute in the absence of air, biochar is produced. The black residue of sugarcane bagasse biochar was further ground and sieved to obtain an average particle size.
2.3. Synthesis of SnO2-modified sugarcane bagasse biochar nanocomposites
SBB with a variable ratio of SnO2 (0.3 g and 0.5 g) in the presence of ethanol ultrasonicate for 1 hour was used to synthesize SnO2-modified sugarcane bagasse biochar (SnO2-SBB) nanocomposites. Two nanocomposites, 0.3 SnO2-SBB and 0.5 SnO2-SBB, were formed based on different ratios of tin(IV) oxide. After the ethanol was evaporated, it was cleaned, centrifuged, and dried in a lab oven set at 100 °C. Samples were stored in air tight bottles. Fig. 1 depicts the synthetic route of SnO2-SBB nanocomposites.
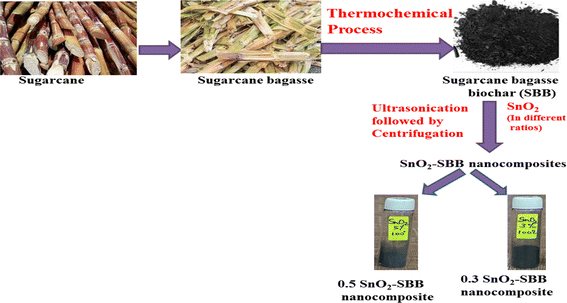 |
| | Fig. 1 Synthesis of SnO2-modified sugarcane bagasse biochar (SnO2-SBB) nanocomposites. | |
2.4. Characterization methods
FTIR, XRD, and SEM-EDS studies were used to characterize SnO2-SBB nanocomposites (0.3 SnO2-SBB and 0.5 SnO2-SBB). FTIR spectra were captured using KBr pellets and a spectral range of 4000–400 cm−1 on a PerkinElmer spectrum version 10.4.00. The Panalytical X Pert Pro X-ray diffractometer, which was outfitted with a CuKα radiation (λ = 1.54060 Å) and ran at 45 kV voltage and 40 mA current, was used to perform XRD measurements. Using Nova Nano FE-SEM 450 (FEI), the surface morphology and form of the nanocomposites were evaluated using SEM. FE-SEM and EDS detectors are connected so that elements included in nanoparticles can be identified and their chemical composition can be examined. The Quanta Chrome Nova Touch LX2 gas sorption analyzer was used as an instrument for the BET measurement of the sample. Zeta potential values were measured using Litesizer DLS 500 version 3.4.4. Utilizing the Malvern ZEN 3600 Zetasizer, the hydrodynamic diameter of the nanocomposites was assessed.
2.5. Batch adsorption studies
The stock solution (500 ppm) of malachite green dye was prepared in deionized water and further diluted to prepare a series of samples from 500 to 1 ppm. During the batch adsorption method, the effects of different parameters, such as dye concentration (1–500 ppm), adsorbent dosage (5–40 mg), contact time (5–30 min), pH (2–10) and temperature (303, 323 and 353 K), on MG dye removal using SnO2-SBB nanocomposites were investigated.
Eqn (1) was used to analyse the adsorption capacity, and eqn (2) was employed to calculate the removal efficiency (%) of MG dye: 41
| | |
Adsorption capacity of malachite green (qe) = (Co − Ce)V/M,
| (1) |
| | |
Removal (%) = (Co − Ce)/Co × 100,
| (2) |
where
Co (mg L
−1) denotes the initial concentration of malachite green dye,
Ce (mg L
−1) denotes the equilibrium concentration,
V (L) denotes the volume of MG dye taken in an aqueous solution, and
M (mg) denotes the mass of the SnO
2-SBB nanocomposite.
3. Results and discussion
3.1. Structural characterization
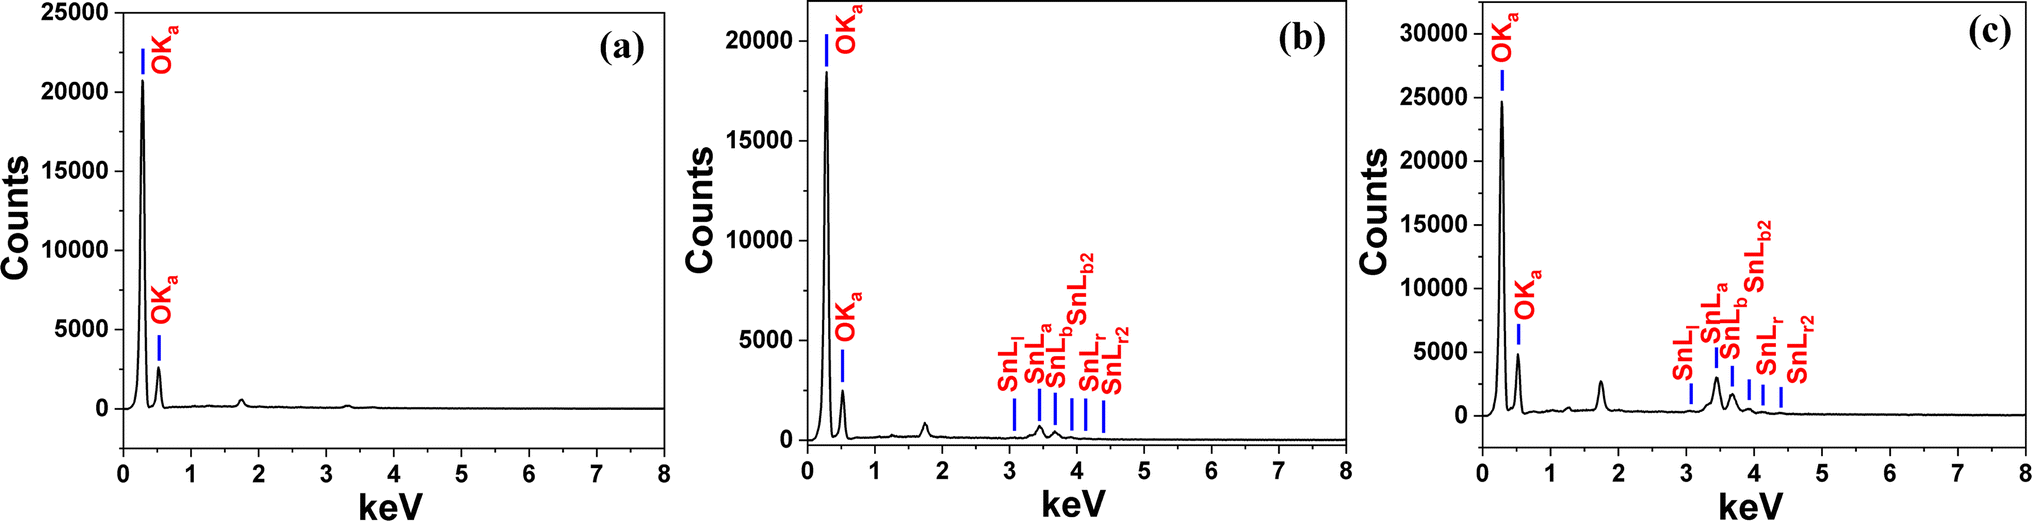
The nanocomposites exhibit better hydrophilic properties (DLS) and are more dispersible than their parent sugarcane bagasse. Table 1 presents the average hydrodynamic diameter of the parent SBB and associated nanocomposites in an aqueous solution. It was demonstrated that composites with average hydrodynamic diameters of 276.6 and 314.2 nm could self-assemble into nanoaggregates in aqueous solutions. The newly synthesized nanocomposites possess enhanced zeta potential values compared to the parent SBB, which indicates that the SnO2-SBB composite functions as a superior adsorbent. The presence of an electrostatic attraction force between the cationic dye and the adsorbent is shown by the negative values of the zeta potential, and this force is highly helpful for the removal of MG dye. Fig. 2 and 3 illustrate the surface morphology and composition of the SBB and the corresponding nanocomposites, respectively. The FE-SEM micrograph displays morphology with an irregular porous structure and folding. The well-developed porous structure was created by the biomass's rapid volatilization of its organic constituents.48,49 SnO2-SBB nanocomposites are more porous than their parent SBB according to the FESEM scans. SEM pictures display variability in the sizes and forms of the particles, some of which have lengthy forms. The tin (Sn), carbon (C), and oxygen (O) lattice stoichiometry with their nominal proportion and the actual inclusion of tin, carbon, and oxygen in the composite are confirmed by the EDX findings (Table 1).
Table 1 Zeta potential, mean diameter, and elemental composition comparisons between SBB and SnO2-SBB nanocomposites
| Composites |
Mean zeta potential (in mV) |
Electrophoretic mobility (in μm cm V−1 s−1) |
DLS diameter (in nm) |
Polydispersity index (DLS) |
Composition (in %) |
| C |
O |
Sn |
| SBB |
−17.8 ± 0.3 |
−1.38 |
944.7 |
0.77 |
82.63 |
17.36 |
— |
| 0.3 SnO2-SBB |
−34.2 ± 0.4 |
−2.66 |
276.6 |
0.28 |
74.77 |
15.99 |
9.23 |
| 0.5 SnO2-SBB |
−35.4 ± 0.8 |
−2.75 |
314.2 |
0.45 |
73.90 |
16.20 |
9.89 |
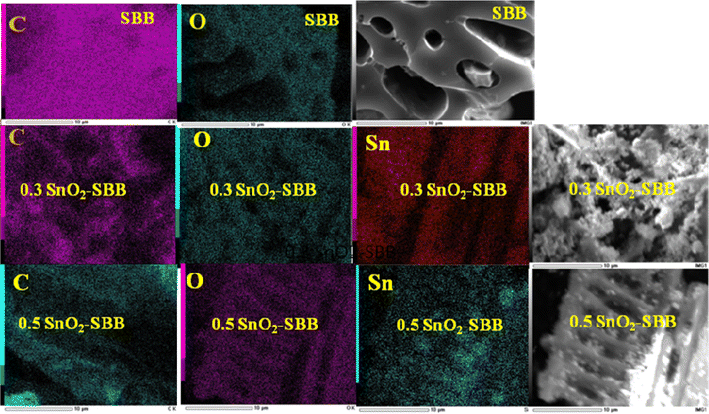 |
| | Fig. 2 SEM and elemental mapping images of the SBB/SnO2 nanocomposites at a magnification of 10 μm. | |
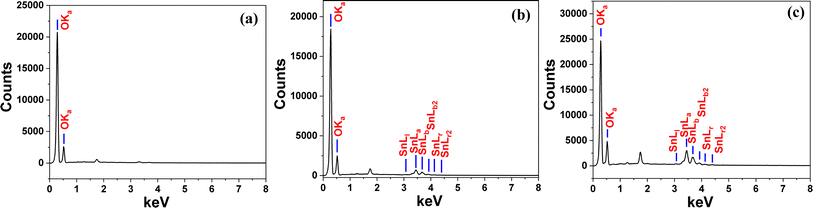 |
| | Fig. 3 EDX spectrum of (a) SBB, (b) 0.3 SnO2-SBB and (c) 0.5 SnO2-SBB nanocomposites. | |
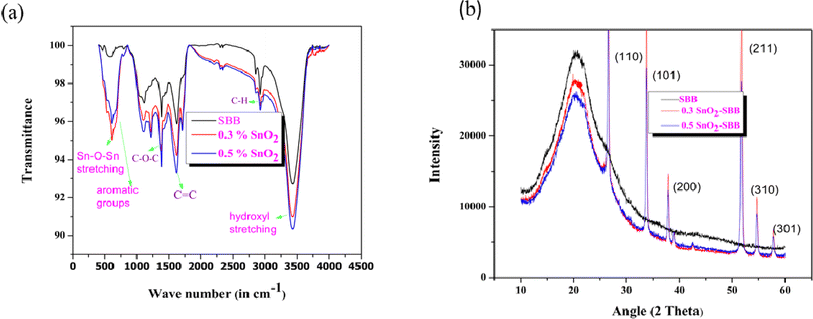
Fig. 4(a) depicts the FTIR spectrum of SnO2-SBB nanocomposites, which contain characteristic bands of biochar and tin dioxide. The spectrum contains bands of carbohydrates, such as cellulose, hemicellulose, and lignin, which reveal nanocomposites derived from SBB. The strong intensity band at 3359 cm−1 may be attributed to the O–H bond of polysaccharides and lignin. The bands at 2921–2891 cm−1 and 1642–1600 cm−1 are found as a result of the aromatic C–H and C![[double bond, length as m-dash]](https://www.rsc.org/images/entities/char_e001.gif) C bond vibrations of polysaccharides and lignin. The medium intensity bands appearing at 1161 and 1240 cm−1 may be due to the C–O–C vibration of polysaccharides. The bands observed at 830–873 cm−1 may be due to aromatic C–H bond vibration of the lignin and polysaccharides. The bands present at 592 cm−1 reveal the presence of the O–Sn–O bond, which confirms the impregnation of tin dioxide with SBB50 and is consistent with the EDX analysis.
C bond vibrations of polysaccharides and lignin. The medium intensity bands appearing at 1161 and 1240 cm−1 may be due to the C–O–C vibration of polysaccharides. The bands observed at 830–873 cm−1 may be due to aromatic C–H bond vibration of the lignin and polysaccharides. The bands present at 592 cm−1 reveal the presence of the O–Sn–O bond, which confirms the impregnation of tin dioxide with SBB50 and is consistent with the EDX analysis.
 |
| | Fig. 4 (a) Comparison of the FTIR spectrum of SBB with SnO2-SBB nanocomposites and (b) XRD patterns of SBB and its corresponding composites. | |
Fig. 4(b) shows the XRD patterns of SBB and their corresponding composites. The XRD patterns of synthesized composites contain peaks at 26.24°, 33.69°, 38.08°, 51.65°, 54.05°, and 58.65°, which were assigned to the (110), (101), (200), (211), (310) and (301) planes of SnO2 (JCPDS card no. 41–1445).51,52 The diffractograms of both composites exhibit peaks of biochar and tin dioxide, suggesting that the nanoxide is impregnated over SBB.
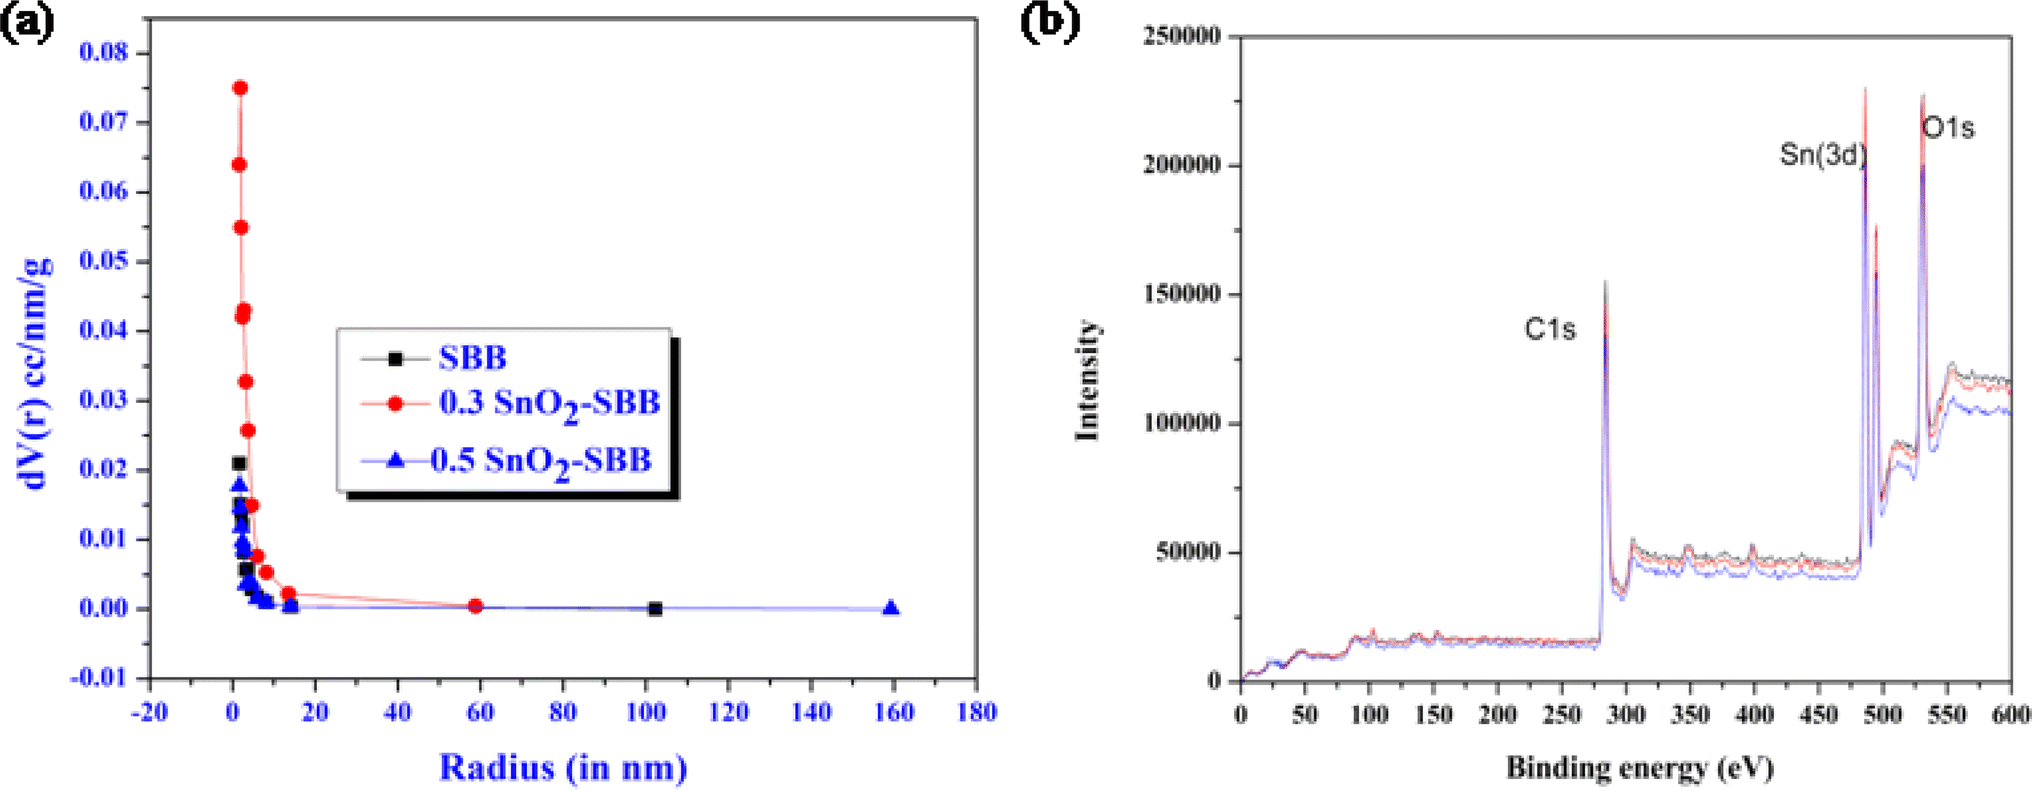
According to the BET measurements (Table 2), the total surface area and total pore volume of the composites were greater than those of the SBB, indicating that the nanocomposites were a better adsorbent than the original biochar. It has been reported in the literature that adsorption efficiency rises with decreasing particle size.53 Consequently, nanocomposites have a superior adsorption capacity than biochar because they have relatively smaller particle sizes. Comparative investigations of nanocomposites and biochar are displayed in Fig. 5(a).
Table 2 Comparative data of different parameters in BET studies of parent biochar and corresponding nanocomposites
| Composites (in nm) |
Pore diameter (in nm) |
Total pore volume (in cc g−1) |
Total surface area (in m2 g−1) |
Average particle size (in nm) |
Pore size |
| SBB |
3.06 |
7.35 |
2.98 |
1.25 |
3.60 |
| 0.3 SnO2-SBB |
3.38 |
8.97 |
6.08 |
0.68 |
3.38 |
| 0.5 SnO2-SBB |
3.42 |
9.19 |
7.36 |
0.86 |
3.42 |
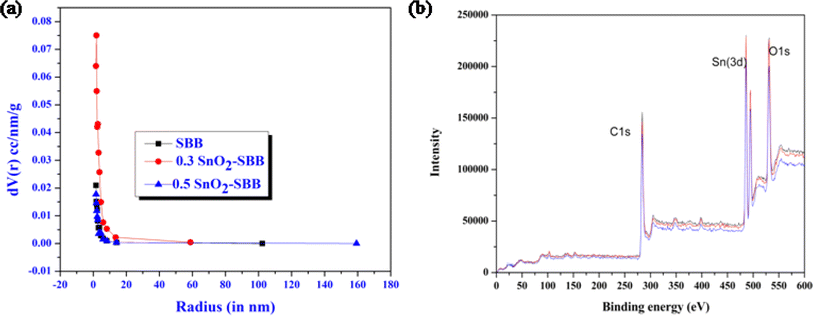 |
| | Fig. 5 (a) Plot representing the comparative pore size distribution curve for biochar and composites. (b) XPS spectrum of composite containing important peaks of carbon, oxygen and tin. | |
X-ray photoelectron spectroscopy (XPS) reveals the elements present in a material, such as their electronic state, elemental composition, and surface characteristics. Fig. 5(b) shows the XPS spectrum revealing the presence of three important components (carbon, oxygen and tin) in the composites. 54
3.2. Adsorption performance of SnO2-SBB nanocomposite
A 10 ppm MG dye solution was employed in this experimental work. The 20 mL of MG dye solution was taken in a beaker in which SnO2-SBB nanocomposites (30 mg) were added. The solution was continuously shaken until equilibrium (15–20 minutes) was achieved. Malachite green dye adsorption from an aqueous solution was studied using the SnO2-SBB nanocomposites at various parameters, including adsorbent concentration, pH, contact time, and temperature. All other parameters were kept constant, and the amount of absorbent was adjusted from 5 to 40 mg. The pH was adjusted from 2 to 10 with solutions of 0.1 M HCl and 0.1 M NaOH. The duration of the shaking was extended from 5 to 30 minutes. When the designated amount of time passed to isolate the adsorbent, the adsorbate solution was removed and filtered. After filtration, the concentration of the solution was measured at 615 nm using a previously calibrated UV-vis spectrophotometer.
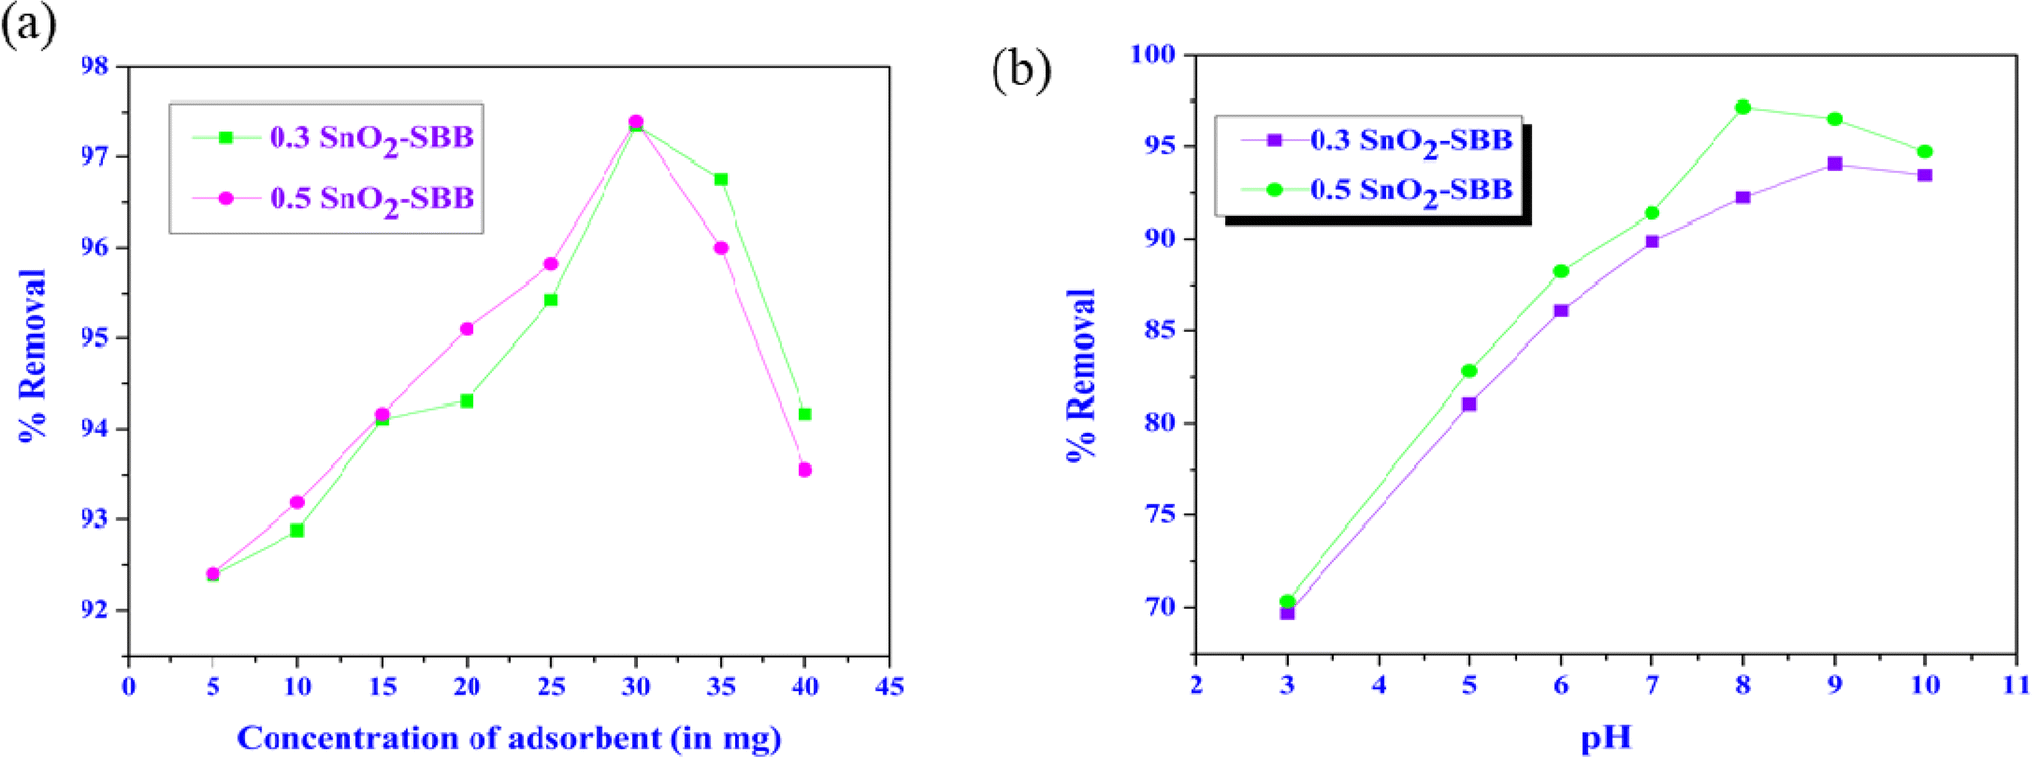
3.2.1. Alterations in adsorbent dose. During adsorption, adsorbent doses play an important role. Adsorbent dosages ranging from 5 mg to 40 mg were used to test the impact of the SnO2-SBB nanocomposite dosage on the adsorption of MG dye (10 mg L−1). Fig. 6(a) demonstrates that increasing the SnO2-SBB nanocomposites dosage from 5 to 40 mg boosted the removal efficiency. The dome-shaped graph in Fig. 6(a) is the result of an initial increase in adsorption efficiency with adsorbent concentration, followed by a reduction. This is because at lower adsorbent concentrations, more adsorbents have larger surface areas and more adsorption active sites.55 Particle aggregation occurs with increasing adsorbent dosage, which lowers dye uptake and efficiency.55 It was discovered that the optimized dose was 30 mg for SnO2-SBB nanocomposites. The removal efficiency decreases after the optimized dose of adsorbent.
 |
| | Fig. 6 (a) Removal percentage of malachite green with different adsorbent dosages and (b) variation in the removal percentage of malachite green with variable pH ranges. | |
3.2.2. Variation with pH. pH influences the adsorbate's surface charge, which makes it a significant factor in the adsorption processes of MG dye over adsorbent (SnO2-SBB nanocomposite). Fig. 6(b) shows how pH affects the effectiveness of the removal of nanocomposites towards MG dye. The pH was regulated as required with 0.1 M hydrochloric acid or 0.1 M sodium hydroxide. The removal efficiency was increased from 2 to 8 but quickly decreased when the pH increased from 8 to 10.The adsorption capacity of MG dye is low at a lower pH in acidic media because more positively charged adsorbent surface sites are created at the expense of more negatively charged surface sites.56 At a lower pH, the carboxylic groups of MG exhibited a large positive charge density due to protonation.56 Consequently, electrostatic repulsion between the positively charged dye molecule and its positively charged surface grew as the pH of the solution increased, which decreased MG's ability to adsorb on the adsorbent.56 In addition, the H+ ion's competition with the cationic dye molecules decreased the adsorption. Conversely, functional groups, such as hydroxyl and carbonyl, can function as sites with negative charges or as biosorbing agents. Higher pH levels negatively charged the adsorbent's surface, which encouraged the positively charged dye cations to adhere to it via the electrostatic force of attraction.56 The adsorption of MG onto the adsorbent subsequently increased when the pH levels increased. Historically, hydrogen bonding, π–π interaction, electrostatic interactions, and hydrophobic factors have controlled the adsorption of analytes onto nanocomposites. 56,57
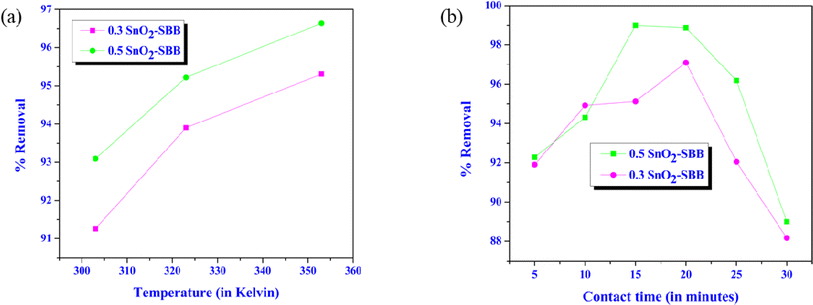
3.2.3. Effect of temperature. Temperature is thought to be a significant element that affects how well the MG dye is adsorbed and removed. At various temperatures within the range, the impact of temperature on MG dye adsorption was assessed at 303–353 K while maintaining the adsorbent dosage (30 mg), the pH (8), the contact time (15 min for 0.3 SnO2-SBB nanocomposite and 20 min for 0.5 SnO2-SBB nanocomposite), and constant agitation speed (500 rpm). Fig. 7(a) shows that the temperature increased from 303 to 353 K, and the rate of MG dye adsorption on SnO2-SBB nanocomposites is reduced. This suggests that the adsorption process was marginally exothermic.
 |
| | Fig. 7 (a) Alteration of removal (%) with temperature and (b) change in removal (%) with time. | |
3.2.4. Influence of contact time. Evaluating the impact of the contact duration is crucial because the findings of this kind of research offer fundamental details about how quickly the adsorption process reaches equilibrium. While keeping the other parameters constant, the impact of varying the contact period of 20 minutes on the adsorption capacity was investigated. According to the data shown in Fig. 7(b), the experiment began with rapid dye adsorption, which progressively slowed down when the equilibrium condition was approached after around 15–20 minutes. The reason behind this could be that during the initial phases of the adsorption process, a significant number of vacant active surface adsorption sites were used, causing the rate of pollutant removal to decrease.58 Dye molecules may aggregate as contact time rises, making it almost difficult for them to diffuse deeper into the adsorbent structure at higher energy sites. This could be another factor. The adsorbents become resistant to the diffusion of aggregated dye molecules due to the aggregation, which removes the effect of contact time by filling the pores.58
3.3. Thermodynamics of adsorption
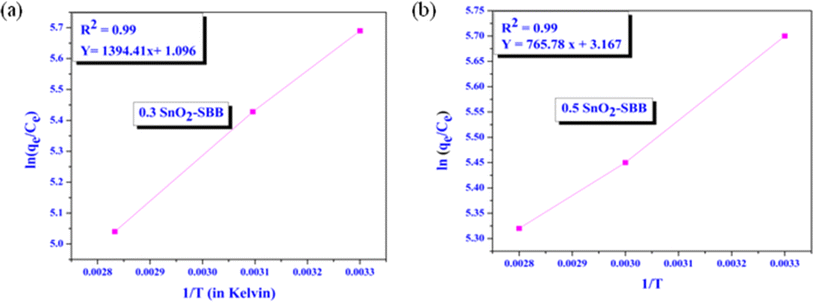
An important factor in the investigation of adsorption efficiency is temperature. In thermodynamic analysis, three parameters were examined to assess the nature of the adsorption process: Gibbs free energy (ΔG°), entropy (ΔS°), and enthalpy change (ΔH°). The ability of SnO2-SBB nanocomposites to adsorb MG dye increases as the temperature increases, indicating that the adsorption process is exothermic. Other thermodynamic parameters were evaluated using the following equations:41,55,56| |
ΔG° = −RT![[thin space (1/6-em)]](https://www.rsc.org/images/entities/char_2009.gif) ln(qe/Ce), ln(qe/Ce),
| (3) |
| | |
ln(qe/Ce) = ΔS°/R − ΔH°/RT,
| (4) |
where R is the gas constant (8.314 J mol−1 K−1), T is the temperature, and qe/Ce = Kd = equilibrium constant for adsorption. Fig. 8 illustrates a graphical plot between ln(qe/Ce) and 1/T, which is used to calculate the values of entropy and enthalpy change from the intercept and slope of the graph. The negative values of ΔG° and ΔH° imply spontaneous and exothermic adsorption processes, whereas the positive values of ΔS° reveal a rise in randomness at the solid–liquid interface during adsorption. Table 3 illustrates all the values of the thermodynamic parameters involved in MG dye adsorption over SnO2-SBB nanocomposites.
 |
| | Fig. 8 Thermodynamic isotherm plots between ln(qe/Ce) vs. 1/T. (a) 0.3 SnO2-SBB and (b) 0.5 SnO2-SBB nanocomposites. | |
Table 3 Thermodynamic parameters of MG adsorption by SnO2-SBB composites
| Adsorbent |
Temperature (in kelvin) |
ΔS° (in J mol−1 K−1) |
ΔH° (in KJ mol−1) |
ΔG° (in KJ mol−1) |
| 0.3 SnO2-SBB |
303 |
9.06 |
−11.59 |
−14.33 |
| 323 |
−14.55 |
| 353 |
−14.79 |
| 0.5 SnO2-SBB |
303 |
26.27 |
−6.366 |
−14.37 |
| 323 |
−14.63 |
| 353 |
−15.63 |
3.4. Kinetic study
When creating an adsorbent, adsorption kinetics play an important role. Adsorption occurs at a pace determined by kinetics. It is affected by the adsorbent's surface complexity, contact time, and solute concentration. The adsorption of MG dye by adsorbents was represented by pseudo-second- and pseudo-first-order kinetics. The pseudo-first-order and pseudo-second-order models were represented in linear form by eqn (6) and (7):41,55,56| | |
ln(qe − qt) = lnqe − K1t,
| (6) |
| | |
t/qt = 1/K2qe2 + t/qe,
| (7) |
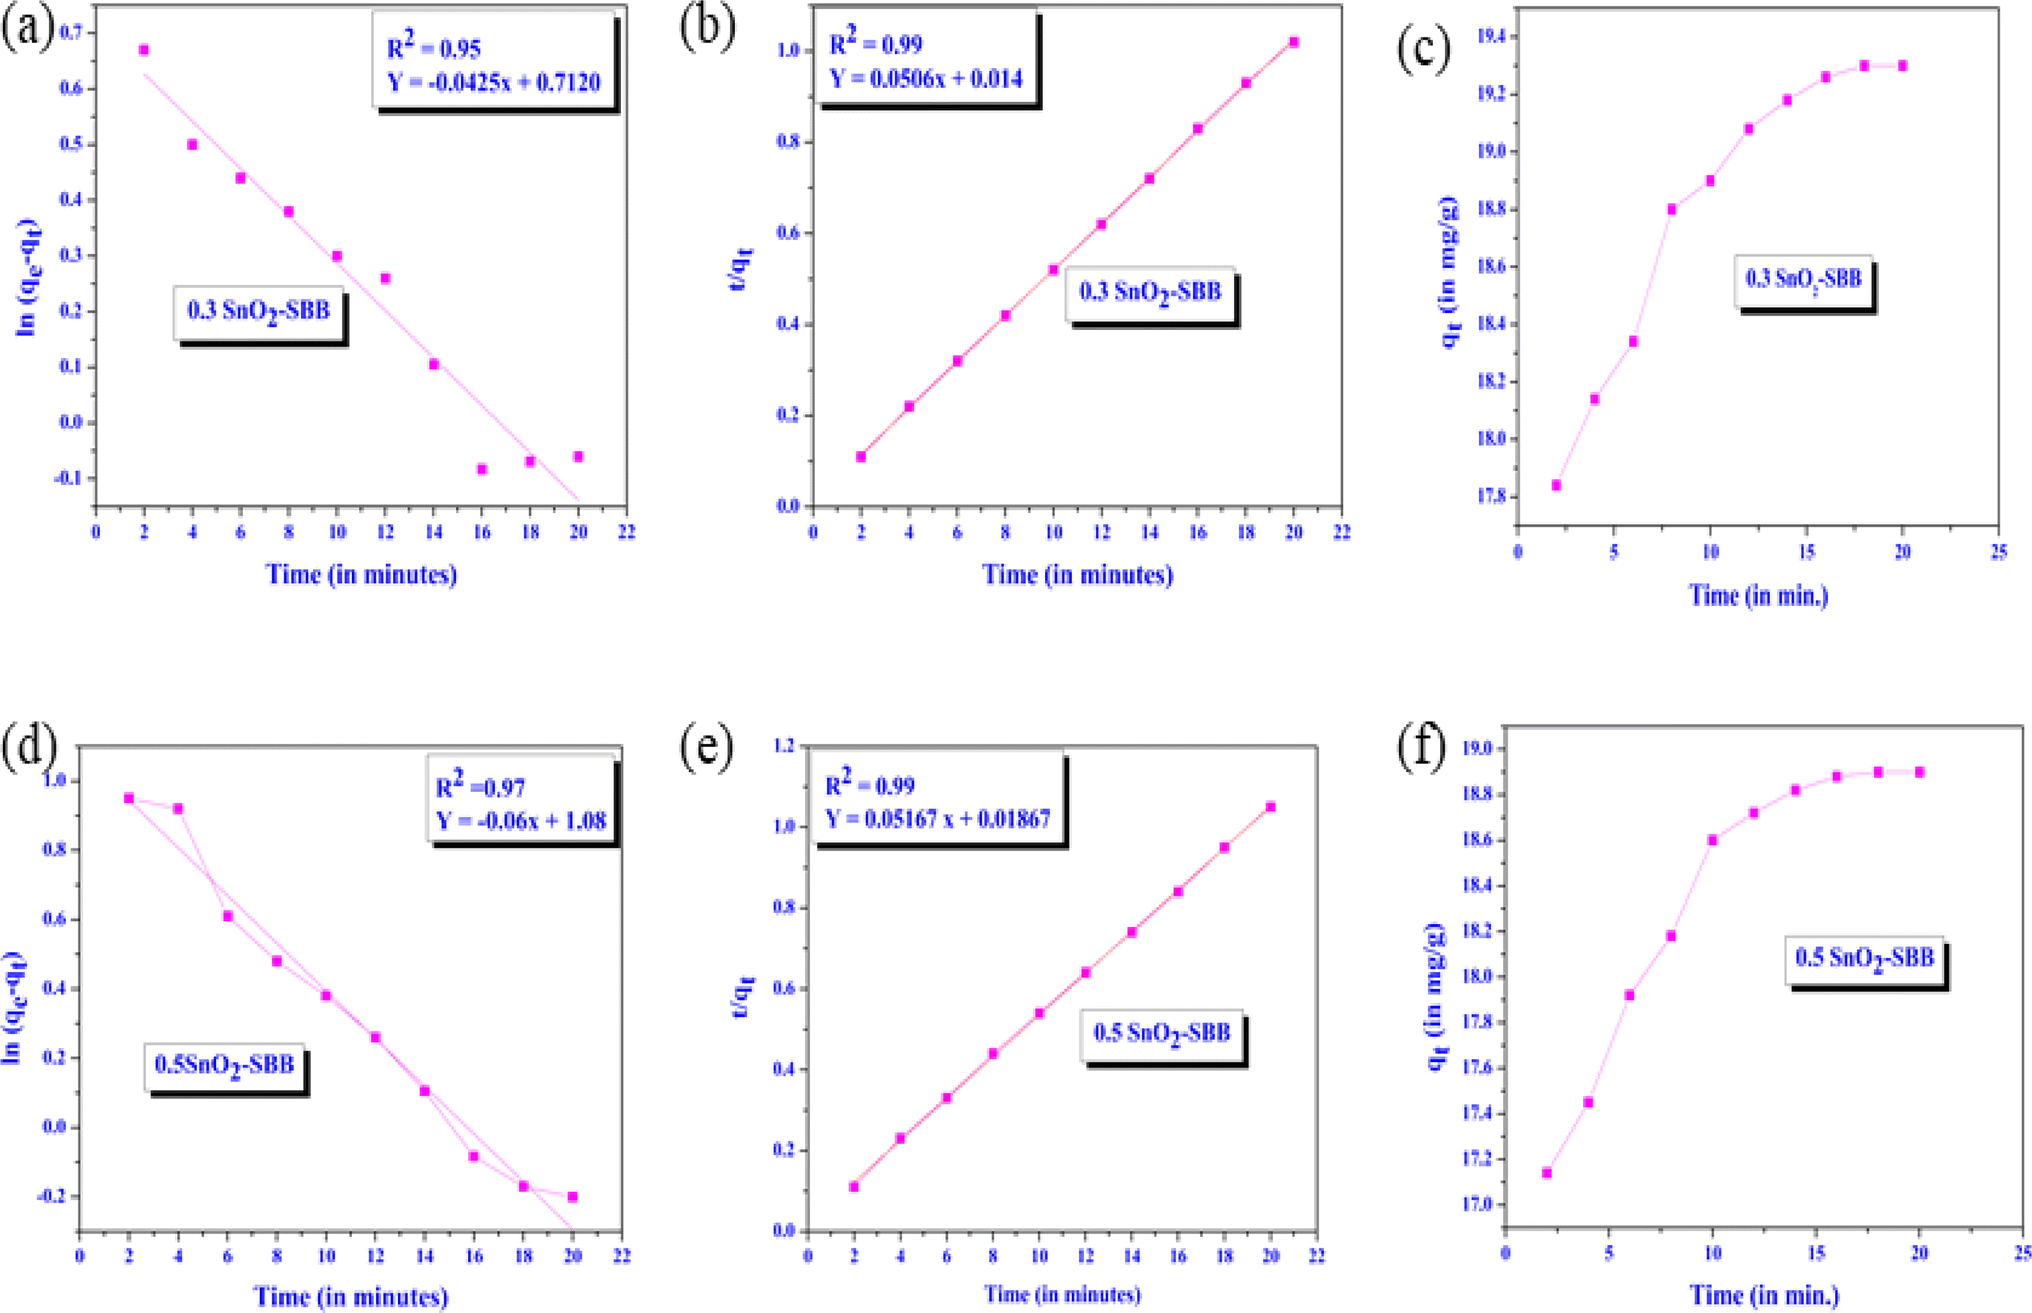
where K1 and K2 represent the pseudo-first- and pseudo-second-order constants, respectively. The curves representing t/qt versus contact time (t) and ln(qe − qt) versus contact time (t), respectively, were used to compute the values of K1 and K2. To forecast the effect of contact time on the adsorptive effectiveness of MG dye, an experiment was conducted at pH 8. The pseudo-first-order and pseudo-second-order linear adsorption curves of MG dye are displayed in Fig. 9. Regarding MG dye, the pseudo-first-order kinetic model's R2 (0.95/0.97) value was less than 1, whereas the pseudo-second-order model's value was almost equal to 1 (R2 = 0.99) (Fig. 9). As shown in Fig. 9, the adsorption capacity first increased over time as more active sites became available and eventually reached saturation after 20 minutes. It was discovered that the pseudo-second-order kinetic models (qecal and qeexp) were nearly identical, suggesting that this model offers a very good fit for the experimental data. For every kinetic model, the values of the kinetic parameters and R2 are calculated, as displayed in Table 4. This result indicates that surface adsorption, which is dependent on the physicochemical interactions between the composite and dye, is the rate-limiting phase.
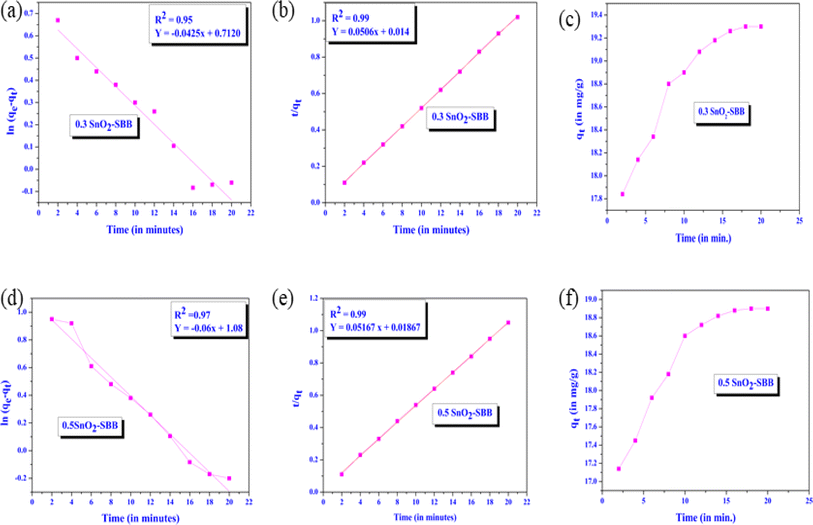 |
| | Fig. 9 Pseudo-first-order kinetic curves (linear fitted) of the SnO2-SBB nanocomposite (a and d), pseudo-second-order kinetic curves (linear fitted) of SnO2-SBB nanocomposite (b and e) and time vs. adsorption capacity curves (c and f). | |
Table 4 Kinetic parameters regarding pseudo-first-order kinetic curves and pseudo-second-order kinetic curves for SnO2-SBB nanocomposites
| Adsorbents |
Co (mg l−1) |
qeexp (mg g−1) |
Rate constant values |
qecal (mg g−1) |
R2 |
| 0.3 SnO2-SBB |
10 |
19.75 |
K1(minutes) = 0.104 |
1.04 |
0.95 |
| 0.5 SnO2-SBB |
10 |
19.80 |
K2(minutes g mg−1) = 0.1533 |
19.76 |
0.99 |
| K1(minutes) = 0.068 |
1.06 |
0.97 |
| K2(minutes g mg−1) = 0.1173 |
19.77 |
0.99 |
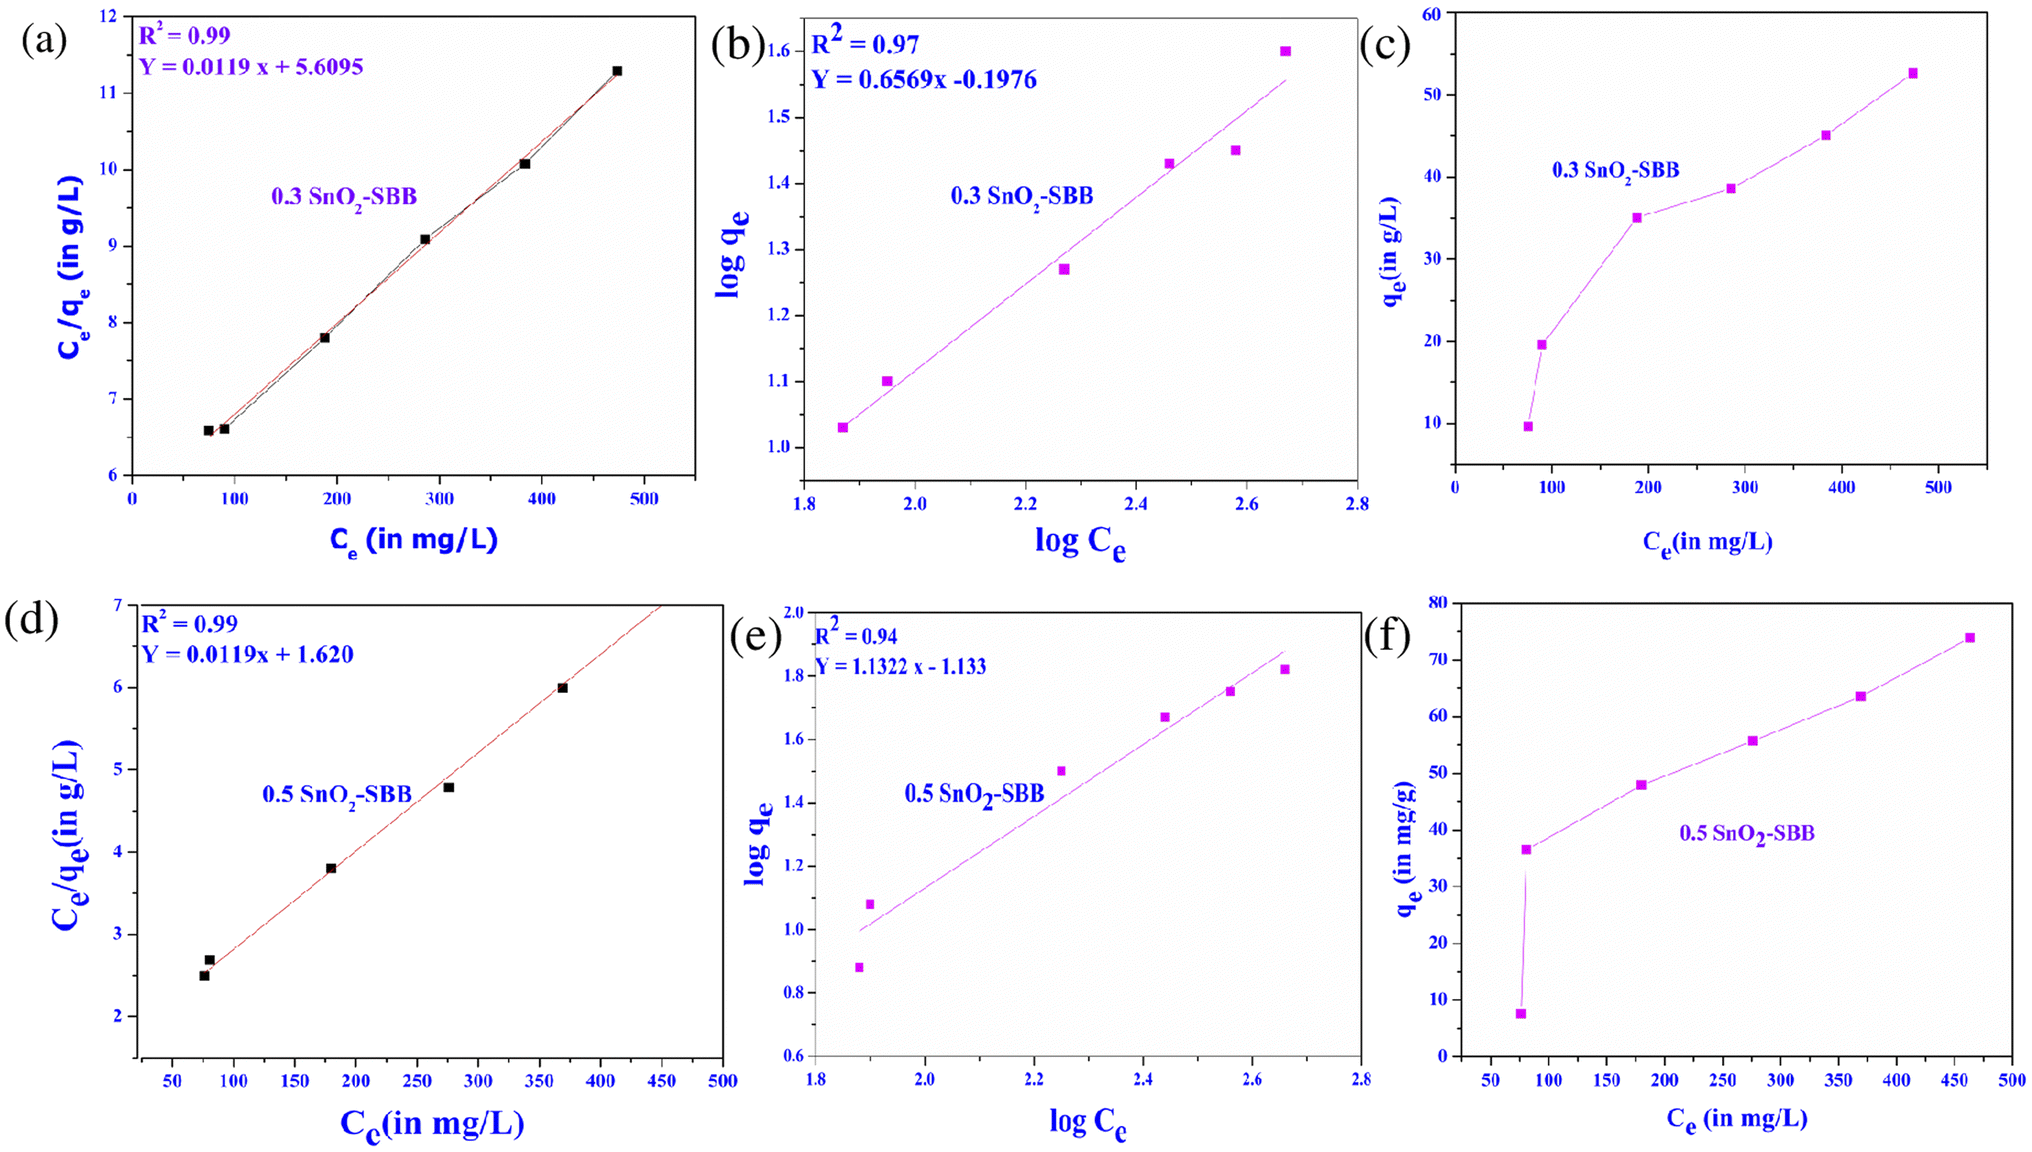
3.5. Adsorption isotherm
The distribution of the adsorbate between the liquid and solid phases is shown by the adsorption isotherm. On the adsorbent surface, the Langmuir model frequently assumes that there is a limited quantity of the same binding sites and that adsorption occurs as a single layer on a uniform surface. The following is a representation of the linear Langmuir equation: 41| | |
Ce/qe = Ce/qmax + 1/qmaxKL,
| (8) |
where qmax (mg g−1) is the maximal adsorption capacity for monolayer adsorption and KL (L mg−1) is the Langmuir constant. The multilayer adsorption process is often described by the Freundlich model (eqn (9)):| | |
lnqe = lnKF + 1/nlnCe,
| (9) |
where 1/n is the heterogeneity factor and KF (mg g−1) is the Freundlich constant. Fig. 10(a–d) illustrates how the Freundlich and Langmuir isotherm models were fitted to the experimental data of MG dye. Table 5 shows the parameters of the Freundlich and Langmuir isotherm models. Fig. 10 depicts the adsorption of MG dye on SnO2-SBB nanocomposites based on the correlation coefficient (R2) values, which are found to be close to 1, and the Langmuir model is adopted. The value of the dimensionless constant (RL) confirms whether the adsorption process is favourable for calculating monolayer adsorption. Eqn (10) can be used to calculate the separation factor (RL): 41where Co = initial concentration of MG dye and KL = Langmuir constant. If the RL values were observed in the range of 0–1, it means that the adsorption process was favourable; otherwise, it is not. In the present study, the RL values were found to be 0.96 and 0.92 for MG dye, suggesting that the adsorption of MG dye over SnO2-SBB nanocomposites was favourable. Fig. 10(c and f) shows the relationship between the equilibrium concentration (mg L−1) and equilibrium capacity (mg g−1). This figure shows that the equilibrium concentration increases with the adsorption equilibrium capacity. The highest level of adsorption efficiency was found to be 52.64 ± 0.03 (0.3 SnO2-SBB) and 73.86 ± 0.05 (0.5 SnO2-SBB) nanocomposites for the MG dye.
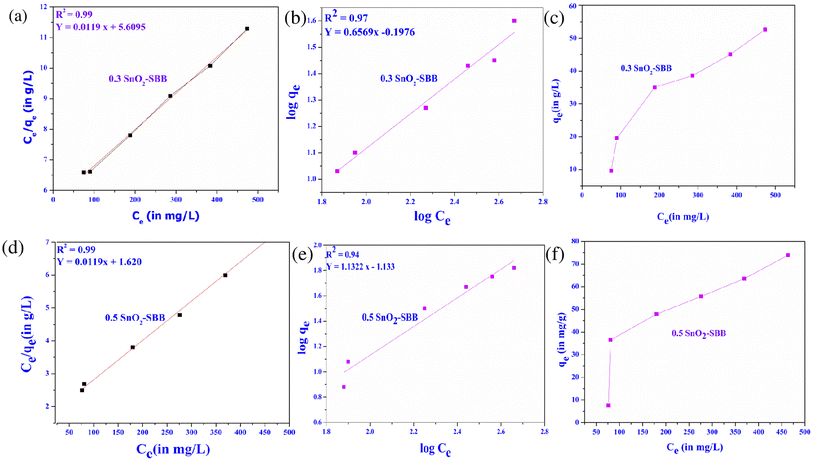 |
| | Fig. 10 Langmuir adsorption isotherm models for (a) 0.3 SnO2-SBB and (d) 0.5 SnO2-SBB nanocomposite. Freundlich isotherm models for (b) 0.3 SnO2-SBB and (e) 0.5 SnO2-SBB nanocomposite. Plot for adsorption capacity versus equilibrium concentration for (c) 0.3 SnO2-SBB and (f) 0.5 SnO2-SBB nanocomposites. | |
Table 5 Isotherm parameters for MG dye removed using SnO2-SBB nanocomposites
| Adsorbents |
Langmuir isotherm parameters |
Freundlich isotherm parameters |
| qm (mg g−1) |
KL (L mg−1) |
R2 |
RL |
n |
KF (mg g−1) |
R2 |
| 0.3 SnO2-SBB |
52.64 ± 0.0 3 |
0.0033 |
0.99 |
0.96 |
1.52 |
1.57 |
0.97 |
| 0.5 SnO2-SBB |
73.86 ± 0.05 |
0.0083 |
0.99 |
0.92 |
0.88 |
0.073 |
0.94 |
3.6. Adsorption mechanism for composites
The effective adsorption capacity of SnO2-SBB nanocomposites for MG dye is caused by their unique shape, which offers a wide surface area, various surface active sites, and a significant number of pi-electrons.59 The specific affinity between the adsorbent and the adsorbate propels the adsorption process onward.60 Negative zeta potential values indicate a significant electrostatic force of attraction between the composite and dye molecules. The two main variables that affect adsorption are the active groups present on the surface of the adsorbent and its particle size.53 Because adsorbent efficiency increases.
As the adsorbent size decreases, according to the results of the BET analysis, nanocomposites serve as an efficient adsorbent in the current investigation. Most N-functional groups on the surface of the pyrolyzed biochar are heterocyclic, six-membered, and five-membered rings. Nitrogen forms single, double, and triple bonds with oxygen and carbon atoms to create bracelets. N-doped biochar is easily recyclable and reusable and continues to exhibit strong adsorption capabilities even after several cycles. Nitrogen functional groups in biochar have also been shown to interact with pollutants and immobilize them on the surface of adsorbents through various chemical processes.61 Bands at 3080–3670 cm−1 are present in the SBB's infrared spectra, and they could be related to the OH/NH vibrations of amines, water, etc. The CO and C–O groups of the carboxylate and carbonate/ether groups exhibit bands at 1646 cm−1 and 1425 cm−1, respectively. The literature review shows that the surface and catalytic characteristics of metal oxide are improved when it is dispersed in a carbonaceous matrix.53 The hybrid composite created when metal oxide and biochar are combined has special qualities that highlight the benefits of both components. Due to the potential for intricate formation interactions, tin(IV) oxide and hydroxides have important applications in the adsorption of organic pigments.62 Another crucial element in the adsorption of MG dye is pH because the dye adsorbed maximum is at pH 8.63 Fig. 11 illustrates how hydrogen bonds develop at pH 8 between the dye's nitrogen atoms and the SBB's hydroxyl groups. The cellulosic portion of SBB and MG dye may be electrostatically attracted to one another. Chemically speaking, SBB is lignocellulosic and mostly comprises functional groups that contain oxygen. Studying the interaction between the adsorbent and adsorbate is crucial to comprehending the adsorption mechanism.64 Using FTIR, the relationship between the adsorbent and the adsorbate is clearly understood. Several significant bands demonstrating the presence of active functional groups and validating H-bonding, electrostatic forces of attraction, or van der Waal forces during the adsorption process may be observed in the infrared spectra of SBB.65 The hydrodynamic diameter of the composite, in addition to all other variables, indicates the interaction between the solvent and adsorbent that facilitates adsorption.
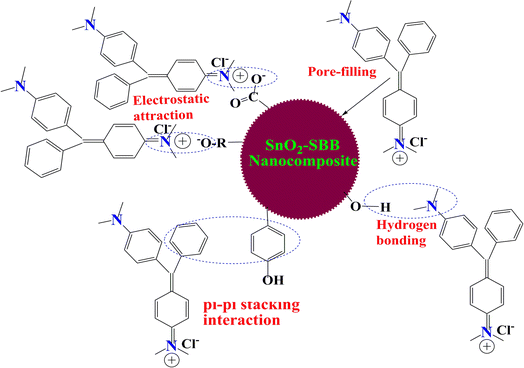 |
| | Fig. 11 Plausible adsorption mechanism of SnO2-SBB nanocomposites for the removal of MG dye. | |
4. Conclusion
The current study investigates the possibility of using SnO2-modified sugarcane bagasse biochar nanocomposites as an effective adsorbent for the extraction of MG dye from wastewater. The amount of MG dye adsorbed depends on several variables, including temperature, pH, contact time, and adsorbent dosages. According to kinetic studies, the MG dye adsorption by nanocomposites fits well into the Langmuir adsorption isotherm and follows pseudo-second-order kinetics. The adsorption of MG dye over nanocomposites exhibits both spontaneous and exothermic behaviour, as indicated by the thermodynamic characteristics. Due to negative zeta potential values, the tenable mechanism suggests that electrostatic attraction has a significant effect on the adsorption of MG dye from waste water. Better adsorption effectiveness depends on the capacity of the nanocomposites to interact with solvent molecules, as demonstrated by the hydrodynamic diameter values. The adsorption effectiveness of composites is influenced by variations in the tin(IV) oxide content between the two nanocomposites. The 0.5 SnO2-SBB composite is a superior adsorbent to the 0.3 SnO2-SBB composite, according to the characterization data. In comparison to the others, it also exhibits better adsorption efficiency.
Data availability
The datasets generated and analyzed in this current study are available from the corresponding author upon reasonable request.
Conflicts of interest
There are no conflicts to declare.
References
- T. N. Lotha, V. Sorhie, P. Bharali and L. Jamir, Advancement in Sustainable Wastewater Treatment: A Multifaceted Approach to Textile Dye Removal through Physical, Biological and Chemical Techniques, ChemistrySelect, 2024, 9, e202304093, DOI:10.1002/slct.202304093.
- X. Song, J. Lu, M. Liu, L. Tang, L. Sun, R. Jiang and L. Zhang, Highly selective removal of triarylmethane dyes by molecular switched adsorbents via charge-assisted hydrogen bond, Chem. Eng. J., 2024, 481, 148714, DOI:10.1016/j.cej.2024.148714.
- N. Aramesh, A. R. Bagheri, Z. Zhang, B. Yadollahi and H. K. Lee, Polyoxometalate-based materials against environmental pollutants: A review, Coord. Chem. Rev., 2024, 507, 215767, DOI:10.1016/j.ccr.2024.215767.
- S. Dutta, S. Adhikary, S. Bhattacharya, D. Roy, S. Chatterjee, A. Chakraborty, D. Banerjee, A. Ganguly, S. Nanda and P. Rajak, Contamination of textile dyes in aquatic environment: Adverse impacts on aquatic ecosystem and human health, and its management using bioremediation, J. Environ. Manage., 2024, 353, 120103, DOI:10.1016/j.jenvman.2024.120103.
- V. Singh, C. Pandit, A. Roy, S. Pandit, A. K. Rai, A. Rani, N. Ranjan, S. Rustagi and S. Malik, Degradation of food dyes via biological methods: A state-of-the-art review, Bioresour. Technol., 2024, 25, 101780, DOI:10.1016/j.biteb.2024.101780.
- M. M. Abdullah, H. B. Albargi, S. D. Alahmari, J. S. Algethami, A. M. A. Henaish, Z. Ahmad, J. Mustafa, M. M. Rahman, M. Z. Ahmad and K. Pal, Visible-light-driven 2D carbonaceous-based SnSenanohybrid soft materials: A photocatalyst for efficient photo reduction of malachite green dye, J. Mol. Liq., 2024, 401, 124668, DOI:10.1016/j.molliq.2024.124668.
- J. Sharma, S. Sharma and V. Soni, Toxicity of malachite green on plants and its phytoremediation: a review, Reg. Stud. Reg. Sci., 2023, 62, 102911, DOI:10.1016/j.rsma.2023.102911.
- J. Sharma, G. Shah, R. J. Strasser and V. Soni, Effects of malachite green on biochemistry and photosystem II photochemistry of Eichhornia crassipes, Funct. Plant Biol., 2023, 50, 663–675, DOI:10.1071/FP23094.
- M. S. Gharavi-Nakhjavani, A. Niazi, H. Hosseini, M. Aminzare, R. Dizaji, B. Tajdar-Oranj and A. MirzaAlizadeh, Malachite green and leucomalachite green in fish: a global systematic review and meta-analysis, Environ. Sci. Pollut. Res., 2023, 30, 48911–48927, DOI:10.1007/s11356-023-26372-z.
- R. Gopinathan, J. Kanhere and J. Banerjee, Effect of malachite green toxicity on non target soil organisms, Chemosphere, 2015, 120, 637–644, DOI:10.1016/j.chemosphere.2014.09.043.
- S. Mani and R. N. Bharagava, Textile industry wastewater: environmental and health hazards and treatment approaches, in Recent Advances in Environmental Management, CRC Press, 2018, pp. 47–69 Search PubMed.
- R. R. Karri, G. Ravindran and M. H. Dehghani, Wastewater-sources, toxicity, and their consequences to human health, in Soft Computing Techniques in Solid Waste and Wastewater Management, Elsevier, 2021, pp. 3–33, DOI:10.1016/B978-0-12-824463-0.00001-X.
- R. Al-Tohamy, S. S. Ali, F. Li, K. M. Okasha, Y. A. Mahmoud, T. Elsamahy, H. Jiao, Y. Fu and J. Sun, A critical review on the treatment of dye-containing wastewater: Ecotoxicological and health concerns of textile dyes and possible remediation approaches for environmental safety, Ecotoxicol. Environ. Contam., 2022, 231, 113160, DOI:10.1016/j.ecoenv.2021.113160.
- G. A. Kallawar and B. A. Bhanvase, A review on existing and emerging approaches for textile wastewater treatments: challenges and future perspectives, Environ. Sci. Pollut. Res., 2024, 31, 1748–1789, DOI:10.1007/s11356-023-31175-3.
- C. D. Venkatachalam, A. Govindaraj, M. Sengottian and S. R. Ravichandran, Recent trends in advanced oxidation processes for tannery effluent treatment–A review, Development in Wastewater Treatment Research and Processes, 2024, pp. 75–87, DOI:10.1016/B978-0-323-95656-7.00006-3.
- R. Rashid, I. Shafiq, P. Akhter, M. J Iqbal and M. A. Hussain, state-of-the-art review on wastewater treatment techniques: the effectiveness of adsorption method, Environ. Sci. Pollut. Res., 2021, 28, 9050–9066, DOI:10.1007/s11356-021-12395-x.
- A. K. Badawi, M. AbdElkodous and G. A. Ali, Recent advances in dye and metal ion removal using efficient adsorbents and novel nano-based materials: an overview, RSC Adv., 2021, 11, 36528–36553, 10.1039/D1RA06892J.
- A. Rathore, S. Sharma, A. Sharma and S. K. Sharma, Evaluation of structure-reactivity correlation of efficient corrosion inhibitor ionic liquids for mild steel in acidic medium, J. Dispersion Sci. Technol., 2023, 45, 1107–1119, DOI:10.1080/01932691.2023.2197996.
- S. Sharma, Y. K. Paridwal, S. Sharma, A. Sharma and S. K. Sharma, Synthesis, characterization, and computational study of N-protected amino acid inhibitors as well as assessment of corrosion resistance properties on mild steel in acidic medium, Asia-Pac. J. Chem. Eng., 2023, 18, e2959, DOI:10.1002/apj.2959.
- S. Sharma, A. S. Solanki and S. K. Sharma, Anticorrosive action of eco-friendly plant extracts on mild steel in different concentrations of hydrochloric acid: An Overview, Corros. Rev., 2024, 42(2), 185–201, DOI:10.1515/corrrev-2023-0053.
- S. Sharma, S. Gurjar, S. Ratnani and S. K. Sharma, Synthesis, Characterization and Applications of Surface Modified Carbon Nanotubes, Surface Modified Carbon Nanotubes Volume 1: Fundamentals, Synthesis and Recent Trends, 2023, ch. 3, vol. 1424, pp. 49–65, DOI:10.1021/bk-2022-1424.ch003.
- S. Gurjar, S. Ratnani, S. K. Sharma and S. Sharma, Adsorption of Ionic Liquids on the Metal Surface: Coordination Chemistry of Ionic Liquids, ed. C. Verma, Bentham Science, 2023, pp. 77–92, DOI:10.2174/9789815136234123010009.
- S. Sharma, A. Sharma and S. K. Sharma, Chapter 23 Ecotoxicological effects and socio-economical aspects of nanoadsorbent materials, Adsorption through advanced nanoscale materials, Elsevier, 2023, pp. 507–531, DOI:10.1016/B978-0-443-18456-7.00023-7.
- S. Sharma, A. S. Solanki, A. Thakur, A. Sharma, A. Kumar and S. K. Sharma, Phytochemicals as eco-friendly Corrosion Inhibitors for Mild Steel in Sulphuric Acid solutions: a review, Corros. Rev., 2024, 42(6) DOI:10.1515/corrrev-2024-0018.
- P. Sharma, S. Sharma, S. K. Sharma, A. Jain and K. Shrivastava, Review on Recent advancement of adsorption potential of sugarcane bagasse biochar in wastewater treatment, Chem. Eng. Res. Des., 2024, 206, 428–439, DOI:10.1016/j.cherd.2024.04.055.
- A. Sharma, Y. Paridwal, S. Sharma, A. Rani, S. Sharma and S. K. Sharma, Impact of proximity of hard and soft segment on IR frequency of carbamate links correlating the mechanical properties of surface functionalized fly ash reinforced polyurethane composites, J. Polym. Eng., 2024, 44(7), 457–466, DOI:10.1515/polyeng-2024-0055.
- A. Singh, S. K. Sharma and S. Sharma, Microwave and Ultrasound-assisted Synthesis of Polymers, Green Chemical Synthesis with Microwaves and Ultrasound, Wiley, 2024, ch. 8, pp. 219–234 Search PubMed.
- S. Sharma, Current Synthetic Methodologies of Carbon Nanotubes: A Review, Mini-Reviews Org. Chem., 2023, 20, 55–80, DOI:10.2174/1570193X19666220224093459.
- S. Sharma and A. Singh, Synthesis of Graphene-based Nanomaterials for Medicinal Applications. A Mini-Review, Curr. Org. Chem., 2022, 26, 1112–1118, DOI:10.2174/1385272826666220621141128.
- S. Gurjar, S. Ratnani, P. Kandwal, K. K. Tiwari, A. Sharma and S. K. Sharma, Experimental and theoretical studies of 1-Benzyl pyridazinium bromide as green inhibitor for mild steel corrosion, e-Prime, 2022, 2, 100054, DOI:10.1016/j.prime.2022.100054.
- G. Murtaza, Z. Ahmed, M. Valipour, I. Ali, M. Usman, R. Iqbal, U. Zulfiqar, M. Rizwan, S. Mahmood, A. Ullah and M. Arslan, Recent trends and economic significance of modified/functionalized biochars for remediation of environmental pollutants, Sci. Rep., 2024, 14, 217, DOI:10.1038/s41598-023-50623-1.
- Z. Hashmi, A. S. Jatoi, S. Nadeem, A. Anjum, S. M. Imam and H. Jangda, Comparative analysis of conventional to biomass-derived adsorbent for wastewater treatment: a review, Biomass Convers. Biorefin., 2024, 14, 45–76, DOI:10.1007/s13399-022-02443-y.
- B. Díaz, A. Sommer-Márquez, P. E. Ordoñez, E. Bastardo-González, M. Ricaurte and C. Navas-Cárdenas, Synthesis Methods, Properties, and Modifications of Biochar-Based Materials for Wastewater Treatment: A Review, Resources, 2024, 13, 8, DOI:10.3390/resources13010008.
- L. Leng, Q. Xiong, L. Yang, H. Li, Y. Zhou, W. Zhang, S. Jiang, H. Li and H. Huang, An overview on engineering the surface area and porosity of biochar, Sci. Total Environ., 2021, 763, 144204, DOI:10.1016/j.scitotenv.2020.144204.
- Z. Jin, S. Xiao, H. Dong, J. Xiao, R. Tian, J. Chen, Y. Li and L. Li, Adsorption and catalytic degradation of organic contaminants by biochar: Overlooked role of biochar's particle size, J. Hazard. Mater., 2022, 422, 126928, DOI:10.1016/j.jhazmat.2021.126928.
- M. Anjum, R. Miandad, M. Waqas, F. Gehany and M. A. Barakat, Remediation of wastewater using various nano-materials, Arabian J. Chem., 2019, 12, 4897–4919, DOI:10.1016/j.arabjc.2016.10.004.
- Z. Cai, Y. Sun, W. Liu, F. Pan, P. Sun and J. Fu, An overview of nanomaterials applied for removing dyes from wastewater, Environ. Sci. Pollut. Res., 2017, 24, 15882–15904, DOI:10.1007/s11356-017-9003-8.
- C. T. Umeh, A. B. Akinyele, N. H. Okoye, S. S. Emmanuel, K. O. Iwuozor, I. P. Oyekunle, J. O. Ocheje and J. O. Ighalo, Recent approach in the application of nanoadsorbents for malachite green (MG) dye uptake from contaminated water: A critical review, Environ. Nanotechnol., Monit. Manage., 2023, 26, 100891, DOI:10.1016/j.enmm.2023.100891.
- M. T. M. Hussien Hamad, Optimization study of the adsorption of malachite green removal by MgO nano-composite, nano-bentonite and fungal immobilization on active carbon using response surface methodology and kinetic study, Environ. Sci. Eur., 2023, 35, 26, DOI:10.1186/s12302-023-00728-1.
- M. E. Ali, M. E. Hoque, S. K. SafdarHossain and M. C. Biswas, Nanoadsorbents for wastewater treatment: next generation biotechnological solution, Int. J. Environ. Sci. Technol., 2020, 17, 4095–4132, DOI:10.1007/s13762-020-02755-4.
- P. Kumari, K. M. Tripathi, K. Awasthi and R. Gupta, Cost-Effective and Ecologically Sustainable Carbon Nano-Onions for Antibiotic Removal from Wastewater, Ind. Eng. Chem. Res., 2023, 62, 13837–13847 CrossRef CAS.
- Z. Alhalili, Metal Oxides Nanoparticles: General Structural Description, Chemical, Physical, and Biological Synthesis Methods, Role in Pesticides and Heavy Metal Removal through Wastewater Treatment, Molecules, 2023, 28(7), 3086, DOI:10.3390/molecules28073086.
- S. K. Ben, S. Gupta, K. K. Raj and V. Chandra, Adsorption of malachite green from polyaniline facilitated cobalt phosphate nanocomposite from aqueous solution, Chem. Phys. Lett., 2023, 820, 140469, DOI:10.1016/j.cplett.2023.140469.
- A. Rubio-Clemente, J. Gutiérrez, H. Henao, A. M. Melo, J. F. Pérez and E. Chica, Adsorption capacity of the biochar obtained from Pinus patula wood micro-gasification for the treatment of polluted water containing malachite green dye, J. King Saud Univ. Eng. Sci., 2023, 35, 431–441, DOI:10.1016/j.jksues.2021.07.006.
- Y. A. E. H. Ali, M. Ahrouch, A. A. Lahcen and Y. A. M. Stitou, Recent Advances
and Prospects of Biochar-based Adsorbents for Malachite Green Removal: A Comprehensive Review, Chem. Afr., 2023, 6, 579–608, DOI:10.1007/s42250-022-00391-8.
- M. T. M. Hussien Hamad, Optimization study of the adsorption of malachite green removal by MgO nano-composite, nano-bentonite and fungal immobilization on active carbon using response surface methodology and kinetic study, Environ. Sci. Eur., 2023, 35, 26, DOI:10.1186/s12302-023-00728-1.
- M. Khalatbary, M. H. Sayadi and M. Hajiani, Adsorption studies on the removal of malachite green by γ-Fe2O3/MWCNTs/Cellulose as an eco-friendly nanoadsorbent, Biomass Convers. Biorefin., 2024, 14, 2495–2513, DOI:10.1007/s13399-022-0247.
- M. Akram, A. T. Saleh, W. A. W. Ibrahim, A. S. Awan and R. Hussain, Continuous microwave flow synthesis (CMFS) of nano-sized tin oxide: Effect of precursor concentration, Ceram. Int., 2016, 42, 8613–8619, DOI:10.1016/j.ceramint.2016.02.092.
- V. Verma and Y. C. Sharma, Facile preparation, characterization and application of novel sugarcane bagasse–derived nanoceria-biochar for defluoridation of drinking water: kinetics, thermodynamics, reusability and mechanism, Environ. Sci. Pollut. Res., 2024, 31, 494–508, DOI:10.1007/s11356-023-30993-9.
- J. Li, C. Chen, J. Li, S. Li and C. Dong, Synthesis of tin-glycerate and it conversion into SnO2 spheres for highly sensitive low-ppm-level acetone detection, J. Mater. Sci.: Mater. Electron., 2020, 31, 16539–16547, DOI:10.1007/s10854-020-04208-7.
- L. Liu, M. An, P. Yang and J. Zhang, Superior cycle performance and high reversible capacity of SnO2/graphene composite as an anode material for lithium-ion batteries, Sci. Rep., 2015, 5, 9055, DOI:10.1038/srep09055.
- S. Banerjee and M. C. Chattopadhyaya, Adsorption characteristics for the removal of a toxic dye, tartrazine from aqueous solutions by a low cost agricultural by-product, Arabian J. Chem., 2017, 10, S1629–S1638, DOI:10.1016/j.arabjc.2013.06.005.
- F. Raposo, M. A. De La Rubia and R. Borja, Methylene blue number as useful indicator to evaluate the adsorptive capacity of granular activated carbon in batch mode: Influence of adsorbate/adsorbent mass ratio and particle size, J. Hazard. Mater., 2009, 165, 291–299, DOI:10.1016/j.jhazmat.2008.09.106.
- K. S. Padmavathy, G. Madhu and P. V. Haseena, A study on effects of pH, adsorbent dosage, time, initialconcentration and adsorption isotherm study for the removal of hexavalent chromium (Cr (VI)) from wastewater by magnetite nanoparticles, Proc. Technol., 2016, 24, 585–594, DOI:10.1016/j.protcy.2016.05.127.
- P. Kumari, K. M. Tripathi, K. Awasthi and R. Gupta, Sustainable carbon nano-onions as an adsorbent for the efficient removal of oxo-anions, Environ. Sci. Pollut. Res., 2023, 30, 15480–15489, DOI:10.1007/s11356-022-22883-336.
- P. Kumari, K. M. Tripathi, K. Awasthi and R. Gupta, Adsorptive Removal of Nitrophenols from Water by Biomass-Derived Carbon Nano-Onions, Ind. Eng. Chem. Res., 2023, 62, 19801–19812 CrossRef CAS.
- H. Wang, X. Z. Yuan, G. Zeng, L. Leng, X. Peng, K. Liao and L. P. Z. Xiao, Removal of malachite green dye from wastewater by different organic acid-modified natural adsorbent: kinetics, equilibriums, mechanisms, practical application, and disposal of dye-loaded adsorbent, Environ. Sci. Pollut. Res., 2014, 21, 11552–11564, DOI:10.1007/s11356-014-3025-2.
- P. Sharma and H. Kaur, Sugarcane bagasse for the removal of erythrosin B and methylene blue from aqueous waste, Appl. Water Sci., 2011, 1, 135–145, DOI:10.1007/s13201-011-0018-x.
- P. Praipipat, P. Ngamsurach, N. Libsittikul, C. Kaewpetch, P. Butdeesak and W. Nachaiperm, Cationic oxides and dioxides of modified sugarcane bagasse beads with applications as low-cost sorbents for direct red 28 dye, Sci. Rep., 2024, 14, 1278, DOI:10.1038/s41598-024-51934-7.
- Y. Jiang, P. Tan, X. Q. Liu and L. B. Sun, Process-oriented smart adsorbents: tailoring the properties dynamically as demanded by adsorption/desorption, Acc. Chem. Res., 2021, 55, 75–86, DOI:10.1021/acs.accounts.1c00555.
- L. Leng, S. Xu, R. Liu, T. Yu, X. Zhuo, S. Leng, Q. Xiong and H. Huang, Nitrogen containing
functional groups of biochar: An overview, Bioresour. Technol., 2020, 298, 122286, DOI:10.1016/j.biortech.2019.122286.
- Y. Cao, S. Mao, M. Li, Y. Chen and Y. Wang, Metal/porous carbon composites for heterogeneous catalysis: old catalysts with improved performance promoted by N-doping, ACS Catal., 2017, 7, 8090–8112, DOI:10.1021/acscatal.7b02335.
- K. Chinoune, K. Bentaleb, Z. Bouberka, A. Nadim and U. Maschke, Adsorption of reactive dyes from aqueous solution by dirty bentonite, Appl. Clay Sci., 2016, 123, 64–75, DOI:10.1016/j.clay.2016.01.006.
- M. A. Al-Ghouti, J. Li, Y. Salamh, N. Al-Laqtah, G. Walker and M. N. Ahmad, Adsorption mechanisms of removing heavy metals and dyes from aqueous solution using date pits solid adsorbent, J. Hazard. Mater., 2010, 176, 510–520, DOI:10.1016/j.jhazmat.2009.11.059.
- R. N. Asha, M. Sankarganesh, N. Bhuvanesh and B. R. Nayagam, Synthesis, structural, spectral, antidiabetic, DNA interactions and molecular docking investigations of a piperidine derivative, J. Mol. Struct., 2022, 1250, 131692, DOI:10.1016/j.molstruc.2021.131692.
|
| This journal is © The Royal Society of Chemistry 2024 |
Click here to see how this site uses Cookies. View our privacy policy here. 
 Open Access Article
 This Open Access Article is licensed under a Creative Commons Attribution-Non Commercial 3.0 Unported Licence
 *b,
Sushil Kumar Sharmac,
Shao Yifeid,
Fangqin Guo
*b,
Sushil Kumar Sharmac,
Shao Yifeid,
Fangqin Guo