
 Open Access Article
 This Open Access Article is licensed under a Creative Commons Attribution-Non Commercial 3.0 Unported Licence
Molecular insight into oil displacement by CO2 flooding in water-cut dead-end nanopores†
Pengfei Lua,
Zichen Yana,
Jiawen Laia and
Keke Wang *b
*b
aAnhui Key Laboratory of Spin Electron and Nanomaterials, School of Chemistry and Chemical Engineering, Suzhou University, Suzhou 234000, China
bSchool of Information Engineering, Suzhou University, Suzhou 234000, China. E-mail: kekewang@ahszu.edu.cn
First published on 13th August 2024
Abstract
Understanding the mechanisms underlying residual oil displacement by CO2 flooding is essential for CO2-enhanced oil recovery. This study utilizes molecular dynamics (MD) simulations to investigate the displacement of residual oil by CO2 flooding in dead-end nanopores, focusing specifically on the water-blocking effect. The findings reveal that oil displacement does not commence until the water film is breached. The dissolution of CO2 molecules in water and the hydrogen bond interactions between water and rock are the primary factors that disrupt the hydrogen bond network among the water molecules, facilitating the breakthrough of the water film. Additionally, the displacement process can be delineated into four distinct stages – encompassing water film rupture, oil swelling, massive oil displacement, and displacement completion – as evidenced by the oil recovery-displacement time curves. Moreover, a cutting-edge oil recovery-displacement time model precisely quantifies crucial stages in the displacement process. For example, when t < δ, trapped oil is impeded by the water film, while when t > δ + 3τ, displacement culminates successfully. Altogether, this research bolsters comprehension of residual oil displacement in the presence of water blocking and advocates for sustainable oil production strategies in oilfields.
1. Introduction
After secondary oil recovery, approximately 60–70% of the residual oil remains underground, forming water-cut reservoirs.1,2 Further exploitation of this residual oil is vital for increasing oil production and meeting the growing energy demands. In such reservoirs, residual oil typically exhibits a pattern of “overall scatter and local enrichment”, and the presence of water adds resistance to oil production, complicating the displacement process.3 To address these challenges, various displacement media, including nanofluids, surfactants, polymers, and gases, have been developed and utilized to extract oil obstructed by water and enhance oil recovery.4–9 Among these, CO2 injection-enhanced oil recovery (CO2 EOR) has emerged as a pivotal technique. This method injects high-pressure CO2 into the stratum to increase subsurface reservoir pressure and stimulate oil production. Additionally, CO2 injection facilitates underground storage and reduces atmospheric CO2 levels, contributing to environmental protection. Understanding the processes and mechanisms of storage-driven CO2 EOR in water-cut reservoirs is crucial for achieving sustainable oil production and net-zero emissions.10Given that residual oil is generally trapped in micro- and nanopores, various microscopic experimental techniques have been employed to characterize these formations. Techniques such as atomic force microscopy (AFM),11,12 scanning electron microscopy (SEM),13 nuclear magnetic resonance (NMR),14,15 and X-ray computed tomography scanning16 are used to determine pore size distribution and identify the occurrence states of residual oil in porous media. To study oil displacement in porous rocks, core-flood experiments17–20 have been conducted. Additionally, the swelling test, slim tube displacement method, rising bubble experiment, and vanishing interfacial tension technique21–24 have been utilized to explore the CO2–oil mixing process and ascertain the CO2–oil minimum miscibility pressure (MMP). Nevertheless, the actual operating procedures for these experimental techniques are typically complex, and the costs are significant, which has led to slow progress in both the experimental research and application of CO2 flooding technology. Given these inherent defects and limitations, molecular dynamics (MD) simulations can serve as a supplementary and extended approach to experimental studies, providing an efficient and cost-effective method for fundamental research into the surface tension, mechanisms of oil displacement and fluid mass transfer processes.25,26 Numerous simulation studies have been conducted to elucidate the mechanisms of CO2 EOR, both with and without water blocking.
In oil recovery, the blending and interaction between CO2 and crude oil significantly influence oil displacement. Santos et al.27 used MD simulations to predict the adsorption behavior of CO2–hydrocarbon mixtures in calcite slit-shaped nanopores. They asserted that the confinement effects must be considered in such small spaces and that CO2 tends to adsorb preferentially onto the available calcium sites on the calcite surfaces, displacing the adsorbed hydrocarbons. Zhang et al.28 investigated the mixing mechanism of CO2 and crude oil in nanoslits and predicted the minimum miscible pressure (MMP). Their findings suggested that CO2 and crude oil are more likely to blend in confined spaces, likely due to increased molecular collision probability in such environments. Feng et al.29 calculated the surface tension between CO2 and crude oil to predict the MMP. Their study revealed that both temperature and the presence of impurity gases significantly influence the blending pressure. Beyond the static properties of CO2 and oil in nanoslits, the hydrodynamic properties and transport behavior of liquid hydrocarbons through rock nanopores are critical in determining the ultimate displacement efficiency, which remains a concern. Wang et al.30 investigated the transport behavior of n-octane through slit-shaped quartz nanopores using nonequilibrium molecular dynamics. Their findings demonstrated that in the center of wider slits, n-octane molecules exhibit nearly the same density, viscosity, and self-diffusion coefficient as the continuum bulk liquid. Closer to a solid surface, the alkane chains preferentially align parallel to the substrate and diffuse more slowly. Liu et al.31 explored the pressure-driven transport behavior of supercritical CO2 in silica nanochannels. Their simulations indicate that the slip length increases nonlinearly with rising pressure gradients or larger nanochannel sizes. Fang et al.32 compared the displacement behaviors of CO2 and N2 flooding through MD simulations. They observed that the synergy between CO2 and N2 slugs surpasses that of single-phase injection and mixed gas flooding.
Additionally, researchers examined the shielding effects of high water saturation and residual oil distribution by CO2 flooding in water-cut reservoirs when a water film encapsulated the residual oil. Using MD simulation and dimensional analysis, Luan et al.33,34 confirmed that the rupture of the water film significantly affects both the velocity of displacement and the oil recovery. Li et al.35 noted that supercritical CO2 can penetrate the water film, forming a path that detaches organic molecules; the thicker the water film, the lower the level of organic molecule detachment.
As discussed earlier, CO2–oil interactions and displacement mechanisms at the atomic scale have been extensively studied, and the influence of water has been considered to some extent. However, few studies have examined the entire process of microscopic residual oil displacement caused by CO2 flooding in water-cut reservoirs. Moreover, the quantitative relationship between oil recovery and displacement time, particularly considering the influence of water, remains unclear. Therefore, this study primarily aims to elucidate this aspect using MD simulations. Initially, the entire displacement process of oil in the water-cut dead-end nanopore is demonstrated through snapshots from the MD simulations, and the collapse details of the water film between CO2 and oil are examined. Subsequently, the study reveals the relationship between oil recovery and displacement time. Finally, the displacement mechanism of the residual oil by CO2 injection is elucidated based on the fitted oil recovery-displacement time curve.
2. Models and simulations
2.1 Molecular models
Quartz is reported to be one of the primary inorganic components of tight reservoirs, comprising one-fifth of the Earth's continental crust.36 Consequently, in this study, quartz was chosen as the solid matrix for constructing slit nanopores. The quartz unit cell structure, sourced from the Materials Studio material library, was initially cleaved along the (001) plane. Next, through a replication operation, the rock wall was constructed with a surface size of 2.95 nm × 10.75 nm on the x–y plane. Subsequently, the slit nanopore was formed by joining the two meticulously constructed rock walls in the z-direction with a slit aperture of 5.02 nm. To investigate the behavior of oil molecules confined within the grooves of the slit, modifications were made to the upper and lower walls. Specifically, several atoms were removed from the previously obtained lower wall to form a rectangular groove with the size of w × h = 2.20 nm × 2.70 nm in the y–z plane, and the thickness of the upper wall was reduced to 0.68 nm to manage computing costs. Finally, a slit nanopore with a hydroxyl-covered inner surface was created by hydroxylating the surface oxygen atoms of each rock wall.Utilizing the meticulously constructed slit nanopore, CO2 fills the main channel, whereas oil molecules, with the decane (C10) chosen as the representative oil component based on our previous work,37 are confined to a groove in the lower wall. Notably, a water film initially surrounds the oil phase in the groove, representing the residual water post-secondary recovery. To isolate the CO2 region in the y-direction, two rigid carbon sheets were positioned on both sides of the system, maintaining a specific pressure difference. Additionally, vacuum spaces were introduced outside the carbon sheets on the left and right sides to prevent fluid interactions from opposite directions. The entire CO2 EOR system is encapsulated in a rectangular box measuring 2.95 × 40.00 × 10.81 nm3, as depicted in Fig. 1.
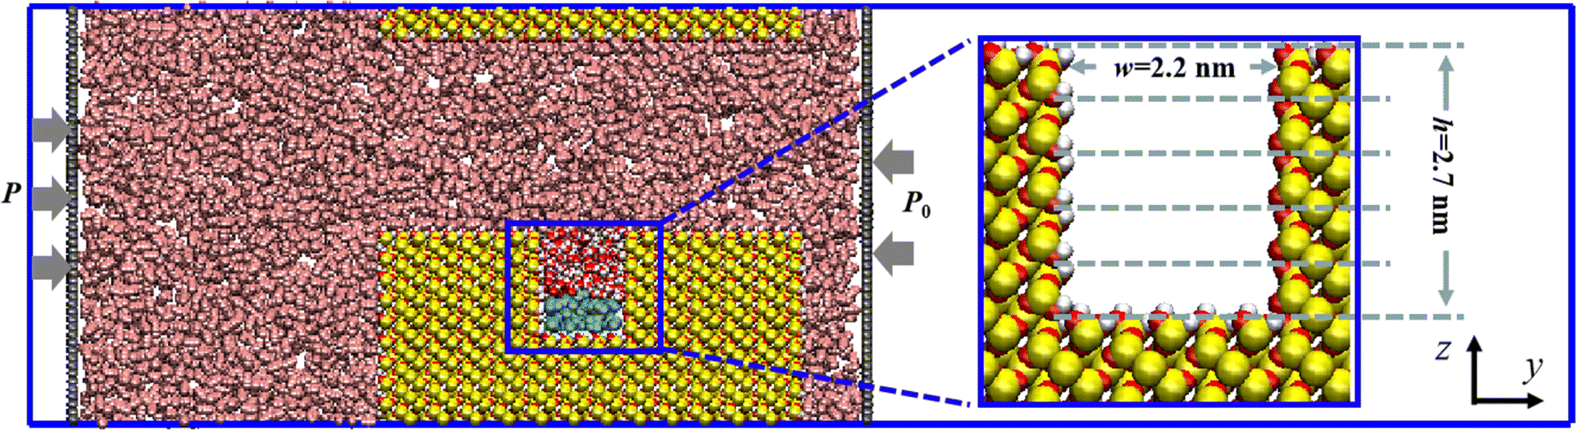 | ||
| Fig. 1 Initial model of the CO2 EOR system: silicon, oxygen, and hydrogen atoms for rock and water are represented in brown, red, and white, respectively, while the decane, CO2, and piston molecules are in cyan, pink, and gray, respectively. | ||
2.2 Simulation details
To eliminate unreasonable intermolecular contacts in the initial model, the configurations of the oil and CO2 molecules were pre-optimized at 20 MPa and 344 K, with the rock atoms fixed in place.32 Subsequently, oil displacement simulations were conducted by applying a specific pressure on the left plate and maintaining 20 MPa on the right. Moreover, to assess the impacts of underground pressure and water on the CO2 EOR process, we designed six initial models with two types of displacing pressures (4 MPa and 1 MPa) and three levels of water contents. The water film thicknesses are set at 0.54 nm (1/5 of the groove volume), 1.08 nm (2/5 of the groove volume), and 1.62 nm (3/5 of the groove volume), respectively. The specific configurations are detailed in Table 1 and illustrated in the inset of Fig. 1. Cases with different water contents are denoted as H1, H2, and H3 for higher pressures (4 MPa) and L1, L2, and L3 for lower pressures (1 MPa).| Case name | Pressure difference (MPa) | Water film thickness (nm) | Water (#) | Oil (#) |
|---|---|---|---|---|
| H1 | 4 | 0.54 | 83 | 37 |
| H2 | 4 | 1.08 | 166 | 27 |
| H3 | 4 | 1.62 | 250 | 18 |
| L1 | 1 | 0.54 | 83 | 37 |
| L2 | 1 | 1.08 | 166 | 27 |
| L3 | 1 | 1.62 | 250 | 18 |
For each scenario, dynamic simulations were performed under the NVT ensemble,38 utilizing three-dimensional periodic boundary conditions. The steepest descent method was employed in the energy-minimization step. The system temperature was regulated using a Nose–Hoover thermostat,39 and the cutoff distances for the electrostatic and van der Waals (vdW) interactions were set at 1.4 nm. The total number of simulation steps for the displacement simulations was established at 6![[thin space (1/6-em)]](https://www.rsc.org/images/entities/char_2009.gif) 000000 with a time step of 0.5 fs. The microstructures and locations of the entire system were recorded every 1 ps for analysis. All experiments adhered to the simulation procedures previously mentioned. The displacement simulations utilized the GROMACS package,40 and the microstructures of the system were visualized using VMD software.41
000000 with a time step of 0.5 fs. The microstructures and locations of the entire system were recorded every 1 ps for analysis. All experiments adhered to the simulation procedures previously mentioned. The displacement simulations utilized the GROMACS package,40 and the microstructures of the system were visualized using VMD software.41
Intermolecular interactions play a pivotal role in molecular simulations. This study modeled decane as a molecule with ten pseudo atoms connected by bonds, employing a coarse-grained force field. The force field developed by Zhu et al.42 was applied to CO2. The TIP3P force field was used for water, while the CLAY force field43 was designated for the rock walls. For non-bonding interactions, coulombic and Lennard–Jones (L–J) potentials were utilized to manage electrostatic and vdW interactions, respectively. As detailed in our previous works,29,44 the interaction parameter (ε) between CO2 and decane was calculated using modified Lorentz–Berthelot rules with a scaling parameter of 0.9. The L–J parameters (ε and σ) and charges (q) for all atomic species are listed in Table S1.†
3. Results and discussion
3.1 Overall oil displacement process
To investigate the displacement process across cases with varying water contents and external pressures, configuration snapshots at different moments during the CO2 flooding process for each case are displayed in Fig. 2 and S1.† Taking H1 (external pressure of 4 MPa and water film thickness of 0.54 nm) as an example (Fig. 2), it can be observed that at the outset of the oil displacement (0 ps), the water film in the rock groove completely isolated the crude oil from CO2. CO2 advanced along the main channel under external pressure. As the simulation commenced, part of the CO2 dissolved in the water film, gradually causing the film to collapse (∼10 ps). Then, the dissolved CO2 penetrated the water film and entered the oil phase, leading to partial dissolution and swelling of the crude oil (∼50 ps). Subsequently, the water film fully opened and spread out on the rock surface, and the dissolved crude oil molecules diffused from the grooves into the main rock channel (100–500 ps). Ultimately, the crude oil was propelled out of the main channel with the CO2 fluid under the displacement pressure, achieving crude oil displacement (∼2000 ps).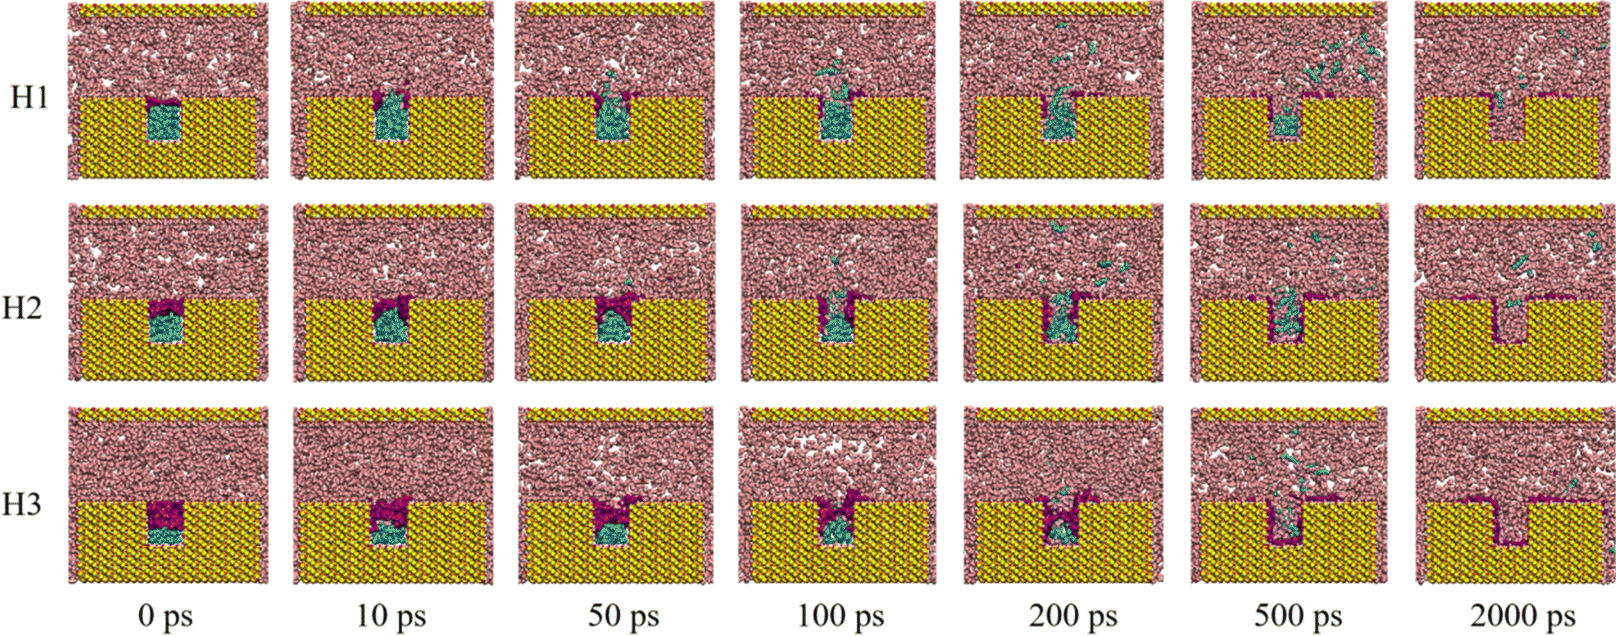 | ||
| Fig. 2 Snapshots of the systems with different water film thicknesses under 4 MPa during displacing process. | ||
Similar displacement processes were observed for cases with higher water content (H2 and H3). Notably, as the water content increased, the rupture of the water film became more challenging. In the case of H3, the water film took over 100 ps to completely break. When the external pressure was reduced to 1 MPa for cases with varying water contents, the displacement process exhibited similar patterns to those observed at 4 MPa (Fig. S1†).
To further explore the evolution of the displacement process in silica groove, we divided the silica groove into five parts along the z direction (inset of Fig. 1), and calculated the density distributions of CO2 and C10 in the silica groove with different water film thicknesses. As shown in Fig. 3, in the silica groove, the total numbder density of CO2 increased gradually with increasing simulation time, while the oil density rapidly decreased, regardless of the water film thickness. This akin to the phenomenon in Fig. 2 that the CO2 molecules could dissolve and diffuse through the water film, and oil molecules were subsequently squeezed out of the groove after breakthrough of the water film. Under the pressure of 1 MPa, similar density distributions means the similar displacement processes to those of 4 MPa (Fig S2†).
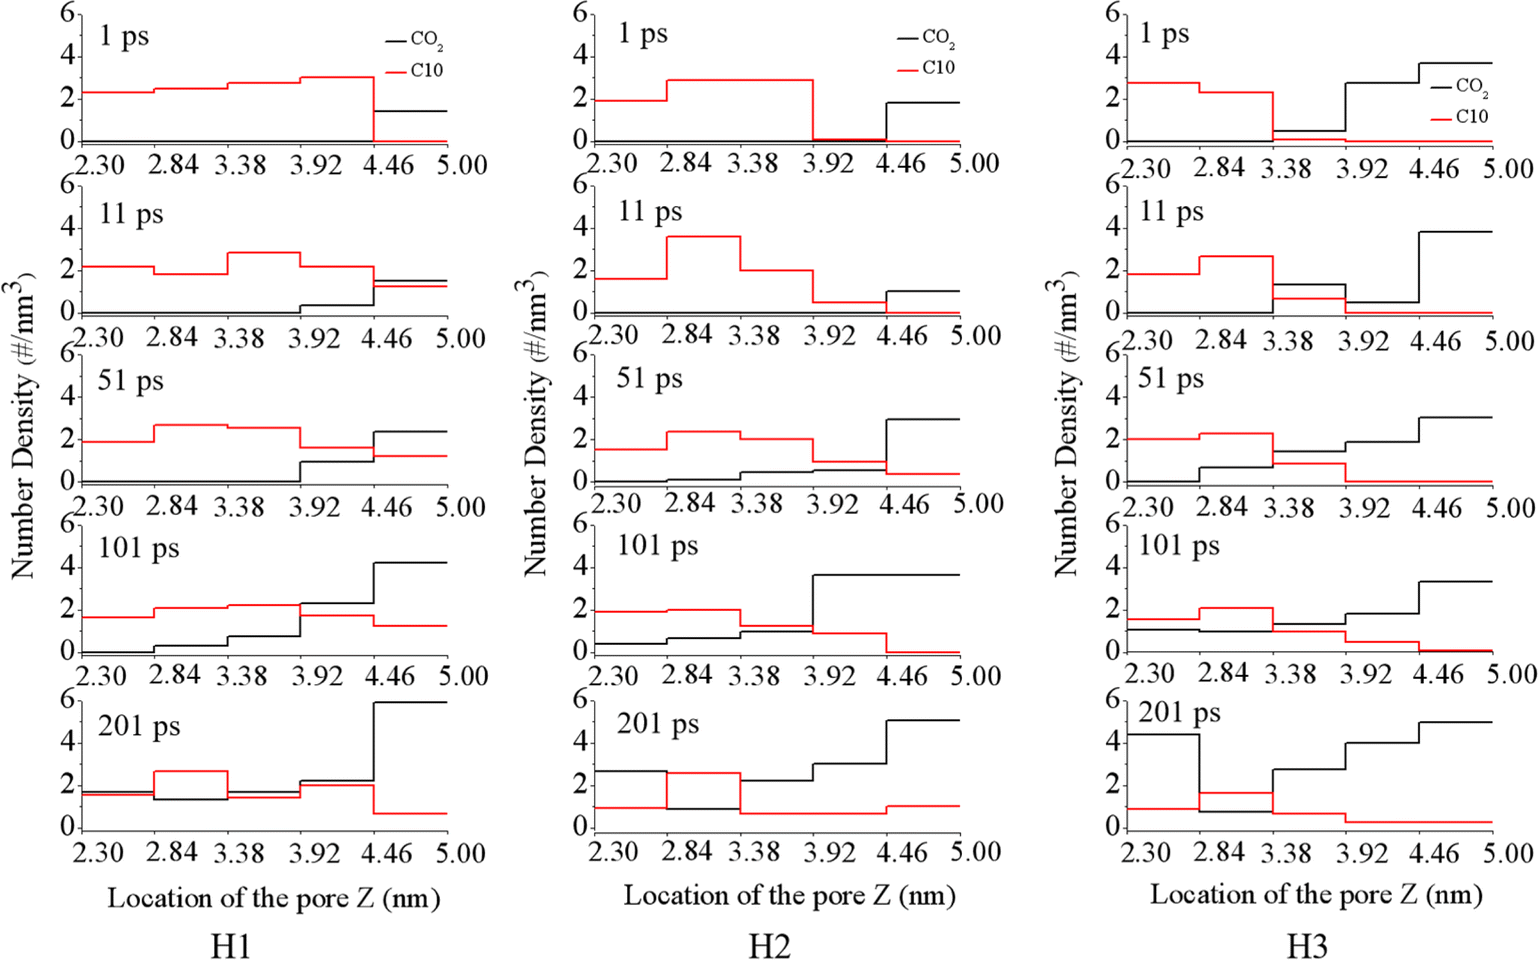 | ||
| Fig. 3 Number density distribution of CO2 and C10 perpendicular to the displacement direction in the groove with different water film thicknesses under the pressure of 4 MPa. | ||
3.2 Influence of water film on the oil displacement process under different displacing pressure
Based on the results discussed above, the rupture of the water film is a critical prerequisite for blending CO2 and oil, significantly influencing the start-up time for oil displacement. As the simulation progresses, some water molecules diffuse out of the film region, leading to a decrease in residual water molecules and the eventual rupture of the water film. To further analyze the rupture process of the water film during oil displacement, we recorded the number of residual water molecules and calculated the porosity of the water film (P) throughout the rupture process, as shown in Fig. 4. The porosity of the water film was determined using a characterization method commonly applied to porous materials, governed by the following equation:| P = V0/Vt | (1) |
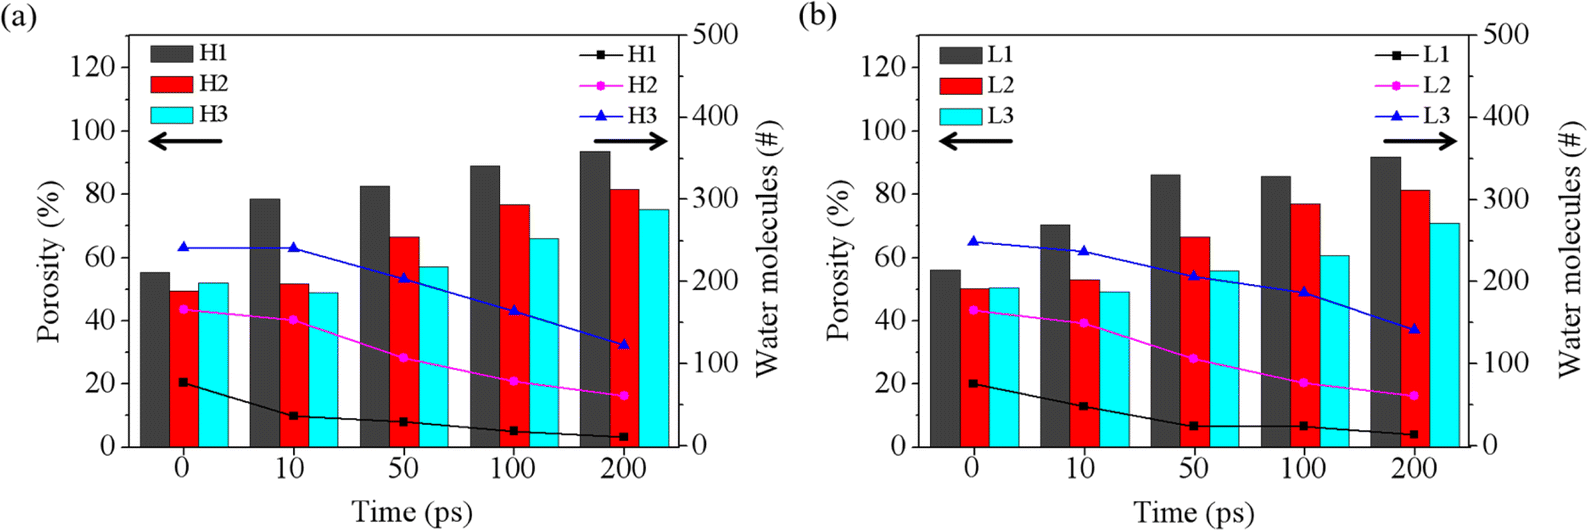 | ||
| Fig. 4 Porosity and water contents of water film at different times under the pressure of 4 MPa (a) and 1 MPa (b). | ||
P represents the porosity of the porous material; in this case, the water film Vt is the total volume of the water film region at the outset, namely 1/5 (H1 and L1), 2/5 (H2 and L2) and 3/5 (H3 and L3) of the volume of the groove, as illustrated in the inset of Fig. 1. V0 is the volume occupied by water molecules within the water film region, determined by the volume enclosed by the Connolly surface.
As depicted in Fig. 4a, at 4 MPa, the initial porosity is approximately 50% for H1, H2, and H3. The case with the thinner water film (H1) demonstrates a rapid decrease in water molecules and a swift increase in porosity (reaching about 80%) during the first 10 ps. Conversely, for H3, which has the thickest water film, there is little change in both the number of water molecules and porosity from 0 to 10 ps. This observation aligns well with the phenomena depicted in Fig. S3,† suggesting that a thinner water film facilitates quicker formation of a through-hole in the water layer. A similar pattern is observed at 1 MPa, as shown in Fig. 4b and S4.†
As noted in the molecular models, the rock surface exhibits hydrophilic properties due to the presence of hydroxyl groups. Therefore, the hydrogen bonding interactions between water and rock (w–r) play a crucial role in the rupture of the water film. The dynamics of water–rock and water–water (w–w) hydrogen bonds over time are detailed in Fig. 5 and S5.† Initially, there is a sharp increase in the number of w–r hydrogen bonds, which then stabilizes. In contrast, the number of w–w hydrogen bonds shows a decreasing trend. This can be attributed to the strong affinity of water for the hydroxyl groups on the rock surface, leading to the formation of hydrogen bonds. As a result, the hydrogen bond network among water molecules within the film is disrupted, facilitating the breakthrough of the water film.
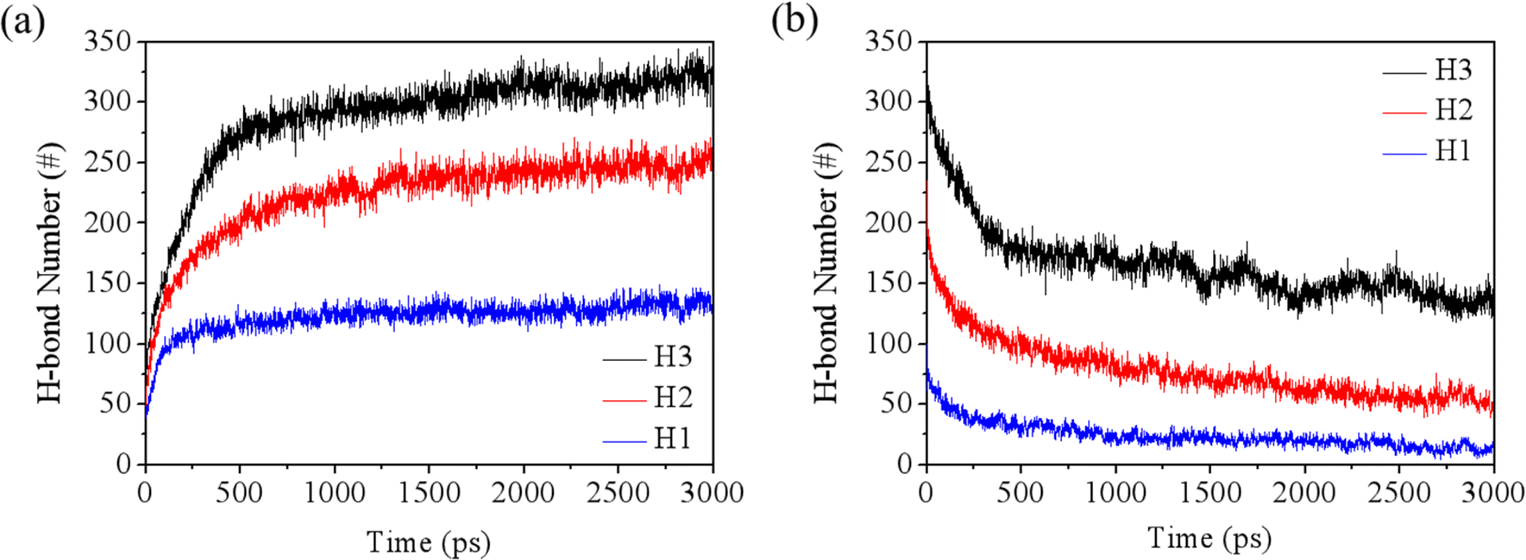 | ||
| Fig. 5 Evolution of (a) w–r hydrogen bonds and (b) w–w hydrogen bonds during the simulations under the pressure of 4 MPa. | ||
Despite the water–rock interactions, another factor contributing to the breakthrough of the water film is the dissolution of CO2 molecules from the main channel into the water film under high displacement pressure. Fig. 6 illustrates CO2 molecules surrounding water molecules in water films of varying thicknesses. The presence of CO2 disrupts the integrity of the hydrogen-bond networks within the water film, thereby promoting the opening of the oil channel. This observation is also supported by Fig. 2 and S1,† which show that as the simulation progressed, more CO2 molecules dissolved into the water film, increasing the number of water molecules adsorbed along the rock surface and rendering the water film more fragile. Once the water film collapses, CO2 bursts into the oil phase, displacing the oil molecules out of the groove, akin to scenarios without a water film.37
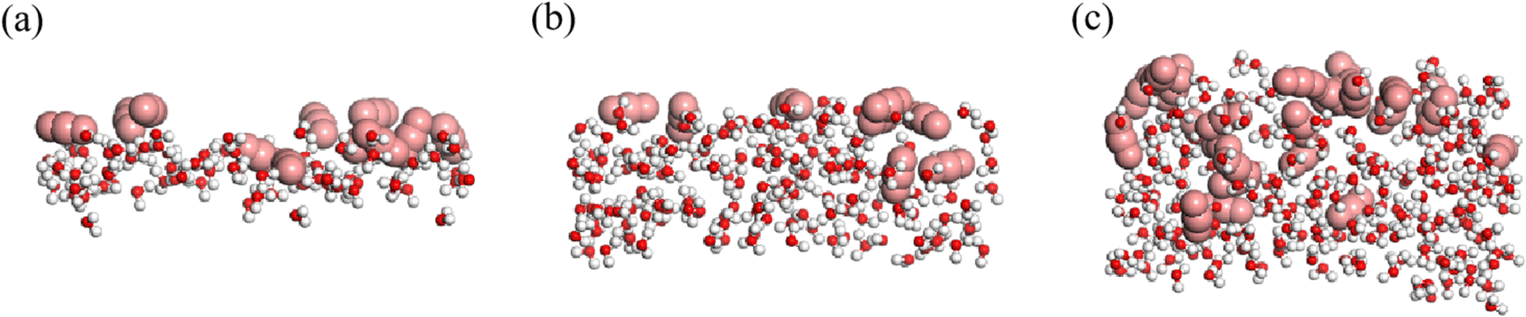 | ||
| Fig. 6 CO2 molecules dissolved in the water films with thicknesses of (a) 0.54 nm, (b) 1.08 nm, and (c) 1.62 nm, respectively. The water molecules were displayed in the ball–stick style and the CO2 molecules in the CPK style. | ||
3.3 Quantification of oil displacement process and oil recovery efficiency
CO2 molecules were propelled forward during the displacement simulation under specific pressure. Oil molecules are not displaced from the groove until the water film ruptures. After a sufficient duration, the number of extracted oil molecules from the groove peaks, indicating the completion of the oil displacement. To further verify and analyze these simulation results, the number of residual oil molecules in the groove was recorded every 1 ps, generating corresponding residual oil number–time curves for all cases. As depicted in Fig. S6,† the number of oil molecules does not decrease immediately during the initial picoseconds, especially in cases with a thicker water film. This delay correlates with the water film outside the oil molecules impeding oil displacement. Following the breakthrough of the water film, the number of residual oil molecules decreases dramatically over time and eventually stabilizes.The plots of oil recovery efficiency (φ) along with displacement time (t) for each case were depicted in Fig. 7 and S7† to quantitatively investigate the oil displacement processes. The oil recovery efficiency was calculated as the ratio of the number of displaced oil molecules to the total number of oil molecules. To ensure the ergodicity of the MD simulations, each case underwent three simulations, and the results were then averaged. Based on the averaged simulation results, despite the water film thickness and pressure, the relationship between φ and t can be fitted using the following piecewise function:
 | (2) |
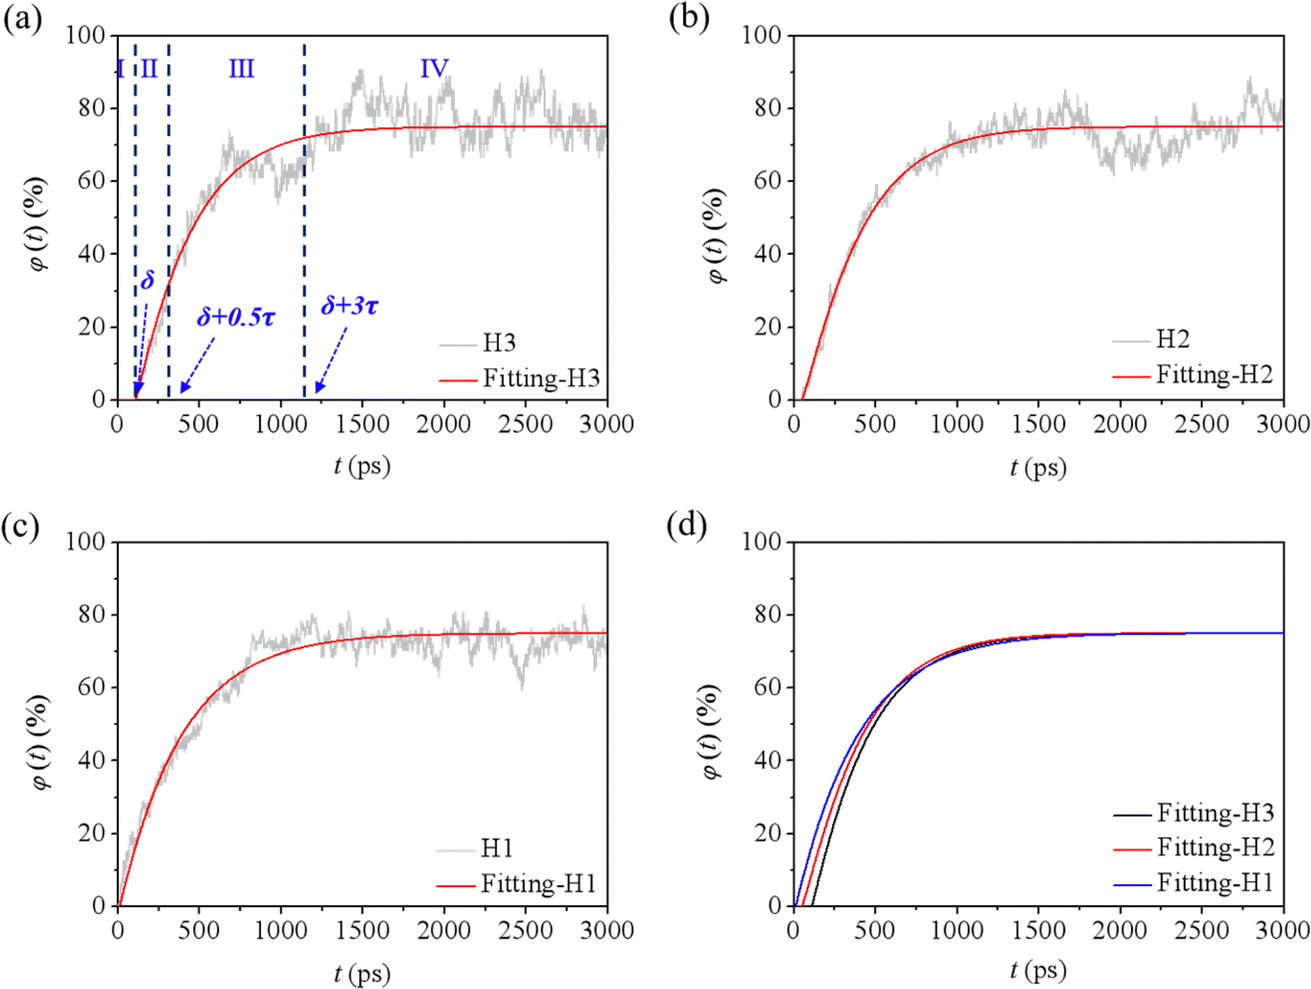 | ||
| Fig. 7 Oil recovery for the cases (a) H1, (b) H2, and (c) H3, and the corresponding fitted curves (d). | ||
| Case name | φm (%) | α | δ (ps) | τ (ps) |
|---|---|---|---|---|
| H1 | 75 | 1.018 | 12.0 | 385.0 |
| H2 | 75 | 1.124 | 50.0 | 374.3 |
| H3 | 75 | 1.078 | 110.0 | 352.3 |
| L1 | 78 | 1.202 | 9.0 | 326.5 |
| L2 | 80 | 1.222 | 37.0 | 380.9 |
| L3 | 84 | 1.825 | 85.0 | 385.8 |
Taking H3 as an example, according to the fitted φ(t)–t curve, the whole displacing process could be divided into four stages (Fig. 7a). During stage I, when t is less than δ, the value of φ equals to zero, which means the oil is well sealed by the water film and no oil molecules is displaced out of the groove. When t is equal and more than δ, an exponential increase of φ can be observed, corresponding to the swelling and massive displacement of oil. This process belongs to stages II and III, which can be split by the inflection point time t = δ + 0.5τ. When t is larger than δ + 3τ, φ reaches 99% of the φm value, and the displacement is completed (donated as stage IV). The observed trend remained consistent across different water contents and external pressures in other cases (Fig. 7b, c, S7a–c†). This discovery mirrors the findings of Luan and Tang's work.34,45
As indicated in Table 2, for each case, when t ≥ δ, the stretching factor a is greater than 1, conforming to the characteristics of a compressed exponential function. Comparing cases with different water contents under the same external pressure, it is observed that a more extended time δ is required for oil molecules to break through the water film in cases with higher water content. The scaling law for δ relative to water film thickness is approximately 2, consistent with Luan's findings.34 Surprisingly, a longer time is required to rupture the water film for the same water content under higher pressures. Conversely, the displacement time constant τ decreases with water film thickness at higher pressures, while an opposite trend is observed at lower displacement pressures. According to formula (2), when t exceeds δ + 3τ, the φm for each case is calculated as 75% for H1, H2, and H3 at 4 MPa, and 78%, 80%, and 84% for L1, L2, and L3 at 1 MPa, respectively. This shows a lower value for cases under higher external pressures. For all cases, the corresponding fitted curves are depicted in Fig. 7d and S7d,† respectively. Overall, formula (2) enables the quantitative determination of displacement efficiency and completion time under various conditions.
4. Conclusions
This study simulated and analyzed the displacement of residual oil in a water-cut silica groove by CO2 flooding. Our findings affirm that the rupture of the water film is essential for effective oil displacement; no oil molecules are displaced from the groove until the water film is breached, and the time it takes to rupture the water film directly determines the initiation of oil displacement. Two primary factors were identified for the collapse of the water film: the dissolution of CO2 molecules within the water film and the hydrogen bond interactions between water and rock. Both factors contribute to the rupture by disrupting the hydrogen bond network among the water molecules. Furthermore, it was established that the relationship between oil recovery and displacement time follows a piecewise function, which allows the displacement process to be segmented into four distinct stages. This segmentation enables the quantitative assessment of displacement efficiency and completion time under varying conditions. This research enhances the understanding of the CO2 EOR process involving water blocking and is expected to benefit practical oil exploitation endeavors.Data availability
The data supporting this article have been included as part of the ESI.†Author contributions
Pengfei Lu: writing-original draft and funding acquisition. Zichen Yan: software and data curation. Jiawen Lai: investigation and visualization. Keke Wang: writing-review & editing and funding acquisition.Conflicts of interest
There are no conflicts to declare.Acknowledgements
This work was financially supported by the Doctoral Research Start-up Fund Project of Suzhou University (No. 2021BSK053), Natural Science Research Project of Suzhou University (No. 2022YKF04), and University-Level Platform Project of Suzhou University (2021XJPT07).References
- S. A. Shedid, J. Pet. Sci. Eng., 2006, 50, 285–292 CrossRef CAS.
- L. Xue, P. Liu and Y. Zhang, Water, 2023, 15, 1342 CrossRef CAS.
- Y. Yang, H. Yang, L. Tao, J. Yao, W. Wang, K. Zhang and L. Luquot, J. Energy Resour. Technol., 2019, 141, 092903 CrossRef CAS.
- Z. Xue, K. Panthi, Y. Fei, K. P. Johnston and K. K. Mohanty, Energy Fuels, 2015, 29, 5750–5760 CrossRef CAS.
- F. Wang and H. Wu, Soft Matter, 2013, 9, 7974 RSC.
- M. A. Ahmadi and S. R. Shadizadeh, J. Pet. Sci. Eng., 2013, 110, 66–73 CrossRef CAS.
- M. Tahir, R. E. Hincapie, N. Langanke, L. Ganzer and P. Jaeger, Polymers, 2020, 12, 1227 CrossRef CAS PubMed.
- S. B. Badmos, T. Bui, A. Striolo and D. R. Cole, J. Phys. Chem. C, 2019, 123, 23907–23918 CrossRef CAS.
- L. Li, Y. Su, Y. Hao, S. Zhan, Y. Lv, Q. Zhao and H. Wang, J. Pet. Sci. Eng., 2019, 181, 106174 CrossRef CAS.
- Y. Liu and Z. Rui, Engineering, 2022, 18, 79–87 CrossRef CAS.
- A. I. Vavouraki, C. V. Putnis, A. Putnis and P. G. Koutsoukos, Cryst. Growth Des., 2009, 10, 60–69 CrossRef.
- R. Shen, W. Xiong, X. Lang, L. Wang, H. Guo, H. Zhou, X. Zhang and H. Yang, Energy Explor. Exploit., 2021, 39, 1839–1856 CrossRef CAS.
- R. G. Loucks, R. M. Reed, S. C. Ruppel and D. M. Jarvie, J. Sediment. Res., 2009, 79, 848–861 CrossRef.
- P. Zhao, Z. Wang, Z. Sun, J. Cai and L. Wang, Mar. Pet. Geol., 2017, 86, 1067–1081 CrossRef.
- Y. Zhao, Y. Zhang, X. Lei, Y. Zhang and Y. Song, Energy, 2020, 203, 117878 CrossRef CAS.
- J. Liu and R. Song, Prog. Comput. Fluid Dyn., 2015, 15, 317–326 CrossRef CAS.
- H. Ott, K. de Kloe, M. van Bakel, F. Vos, A. van Pelt, P. Legerstee, A. Bauer, K. Eide, A. van der Linden, S. Berg and A. Makurat, Rev. Sci. Instrum., 2012, 83, 084501 CrossRef CAS PubMed.
- H. Wang, Y. Bernabé, U. Mok and B. Evans, J. Geophys. Res.: Space Phys., 2016, 121, 7965–7983 CrossRef CAS.
- M. S. Karambeigi, R. Abbassi, E. Roayaei and M. A. Emadi, J. Ind. Eng. Chem., 2015, 29, 382–391 CrossRef CAS.
- L. Li, C. Wang, D. Li, J. Fu, Y. Su and Y. Lv, RSC Adv., 2019, 9, 28857–28869 RSC.
- H. Zhang, D. Hou and K. Li, J. Chem., 2015, 2015, 1–10 Search PubMed.
- M. Abdurrahman, A. K. Permadi and W. S. Bae, J. Pet. Sci. Eng., 2015, 131, 165–171 CrossRef CAS.
- K. Zhang, N. Jia and F. Zeng, Fuel, 2018, 220, 412–419 CrossRef CAS.
- F. M. Orr and K. Jessen, Fluid Phase Equilib., 2007, 255, 99–109 CrossRef CAS.
- K. E. Karim, M. Barisik, C. Bakli and B. Kim, Phys. Chem. Chem. Phys., 2024, 26, 19069–19082 RSC.
- Q. Kim and W. Jhe, NANOSCALE, 2020, 12, 18701–18709 RSC.
- M. S. Santos, L. F. M. Franco, M. Castier and I. G. Economou, Energy Fuels, 2018, 32, 1934–1941 CrossRef CAS.
- T. Fang, Y. Zhang, J. Liu, B. Ding, Y. Yan and J. Zhang, Int. J. Heat Mass Transfer, 2019, 141, 643–650 CrossRef CAS.
- F. Peng, R. Wang, Z. Guo and G. Feng, J. Phys. Commun., 2018, 2, 115028 CrossRef CAS.
- S. Wang, F. Javadpour and Q. Feng, Fuel, 2016, 171, 74–86 CrossRef CAS.
- B. Liu, X. Li, C. Qi, T. Mai, K. Zhan, L. Zhao and Y. Shen, RSC Adv., 2018, 8, 1461–1468 RSC.
- T. Fang, M. Wang, Y. Gao, Y. Zhang, Y. Yan and J. Zhang, Chem. Eng. Sci., 2019, 197, 204–211 CrossRef CAS.
- Y. Luan, B. Liu, P. Hao, K. Zhan and J. Liu, J. Pet. Sci. Eng., 2020, 188, 106899 CrossRef CAS.
- Y. Luan, X. Dou, Y. Zhou, P. Hao, B. Liu and J. Liu, Energy Fuels, 2022, 36, 4348–4357 CrossRef CAS.
- S. Li, Y. Pan, S. Yang and Z. Li, Geoenergy Sci. Eng., 2023, 231, 212290 CrossRef CAS.
- Y. Deng, Z. Li, S. Rao, H. Zheng, X. Huang, Q. Liu, D. Wang and H. Lu, Appl. Surf. Sci., 2023, 633, 157559 CrossRef CAS.
- P. Lu, T. Mo, Y. Wei, Z. Guo and G. Feng, J. Supercrit. Fluids, 2022, 181, 105507 CrossRef CAS.
- H. J. C. Berendsen, J. P. M. Postma, W. F. van Gunsteren, A. DiNola and J. R. Haak, J. Chem. Phys., 1984, 81, 3684–3690 CrossRef CAS.
- S. Nosé, J. Chem. Phys., 1984, 81, 511–519 CrossRef.
- B. Hess, C. Kutzner, D. van der Spoel and E. Lindahl, J. Chem. Theory Comput., 2008, 4, 435–447 CrossRef CAS.
- W. Humphrey, A. Dalke and K. Schulten, J. Mol. Graphics, 1996, 14, 33–38 CrossRef CAS PubMed.
- A. Zhu, X. Zhang, Q. Liu and Q. Zhang, Chin. J. Chem. Eng., 2009, 17, 268–272 CrossRef CAS.
- R. T. Cygan, J. Liang and A. G. Kalinichev, J. Phys. Chem. B, 2004, 108, 1255–1266 CrossRef CAS.
- R. Wang, F. Peng, K. Song, G. Feng and Z. Guo, Fluid Phase Equilib., 2018, 467, 25–32 CrossRef CAS.
- M. Cui, R. Wang, C. Lv and Y. Tang, J. Pet. Sci. Eng., 2017, 154, 315–321 CrossRef CAS.
Footnote |
| † Electronic supplementary information (ESI) available. See DOI: https://doi.org/10.1039/d4ra04962d |
| This journal is © The Royal Society of Chemistry 2024 |