
 Open Access Article
 This Open Access Article is licensed under a Creative Commons Attribution-Non Commercial 3.0 Unported Licence
Chitosan-stabilized gold nanoparticles decorated with a thiodiacetic acid nanoprobe for selective detection of arsenic(III) in rice and water samples†
Asmah Kunoab,
Nuryanee Hamaab,
Panwadee Wattanasina and
Thitima Rujiralai *ab
*ab
aCenter of Excellence for Innovation in Chemistry and Division of Physical Science, Faculty of Science, Prince of Songkla University, Songkhla, 90110, Thailand. E-mail: thitima.r@psu.ac.th
bAnalytical Chemistry and Environment Research Unit, Division of Science, Faculty of Science and Technology, Prince of Songkla University, Pattani, 94000, Thailand
First published on 22nd August 2024
Abstract
A sensitive and selective method for the detection of arsenic(III) (As3+) based on chitosan-stabilized gold nanoparticles (CS/AuNPs) decorated with a 2,2′-thiodiacetic acid (TDA) nanoprobe was developed and used to detect and indicate the contamination of rice, drinking water and environmental water samples. AuNPs were reduced and stabilized with CS and subsequently functionalized with TDA. As3+ interacted with the carboxylate group of TDA to form an As–TDA complex, inducing the aggregation of CS/AuNPs@TDA. The aggregation of CS/AuNPs@TDA was accompanied with a change in color from red to bluish purple and a shift in surface plasmon resonance wavelength from 525 nm to 645 nm. The response for the detection of As3+ was linear at concentrations from 10 to 1000 μg L−1 with a limit of detection of 6.1 μg L−1. The method exhibited selectivity toward As3+ among various cations (As5+, Cu2+, Fe3+, Fe2+, Hg2+, Al3+, Cr3+, Cd2+, Co2+, Ni2+, Pb2+ and Zn2+) and anions (Br−, Cl−, F−, SO42−, NO3− and PO42−). The CS/AuNPs@TDA nanoprobe was applied to detect As3+ in rice, drinking water and environmental water samples. The results were consistent with those obtained via inductively coupled plasma-optical emission spectrometry (ICP-OES). Satisfactory recoveries ranging from 88.22% to 105.74% (RSDs of 0.25–2.99%) were obtained from spiked samples.
1 Introduction
Arsenic is a highly toxic metalloid occurring in both organic and inorganic compounds and is found in the environment due to natural occurrence and anthropogenic activity.1 The inorganic forms of arsenic, arsenite (As3+) and arsenate (As5+) are relatively more toxic to human health than organic arsenic and are predominantly detected in water.1,2 As5+ is less reactive with tissues than As3+ and thus is excreted more through urine.3 People can be exposed to arsenic in three ways: from the ingestion of water, food, and soil; from the inhalation of smoke and particles; and by absorption through dermal contact with soil and water containing arsenic.3 Inorganic arsenic exposure via the ingestion of food and drinking water has received the most attention, and adverse effects related to long-term arsenic ingestion include skin lesions, cancer, neurotoxicity, and diabetes.1 The high adsorption rate of arsenic in rice is attributed to anaerobic conditions in soils,4 and it has been suggested that the health risks related to arsenic exposure through contaminated rice are similar to those through contaminated water.5 Arsenic and inorganic arsenic compounds are classified as group I human carcinogens by the International Agency for Research on Cancer.6 The United States Environmental Protection Agency has set a standard limit of 10 μg L−1 for arsenic in drinking water7 while the United States Food and Drug Administration permits a concentration of 100 μg kg−1 for inorganic arsenic in infant rice cereals.8Arsenic in several types of samples has been determined using various techniques, such as atomic absorption spectrometry (AAS),9,10 atomic fluorescence spectrometry (AFS),11 inductively coupled plasma mass spectrometry (ICP-MS),12 inductively coupled plasma-optical emission spectrometry (ICP-OES),13 electrochemistry14,15 and fluorescence detection.16,17 Although these sophisticated methods are highly sensitive and accurate, their costly instruments, maintenance, and complex operation processes lead to high costs. Moreover, they are not feasible for on-site applications. In terms of simplicity and cost-effectiveness, colorimetric detection is more practical, can be applied for real time analysis and provides results that can be seen by the naked eye.
Over the past ten years, colorimetric detection based on gold nanoparticles (AuNPs) has attracted increasing interest and has been applied for the quantitative analysis of organic compounds and metals in the environmental, medical, and food sectors.18–21 AuNPs have unique optical and electrical features that can be tuned by varying the shape, size, and aspect ratio between reducing or capping agents and AuNPs. The color of a dispersion of AuNPs is determined by the collective oscillations of the light-excited electron cloud at their surface, a phenomenon known as surface plasmon resonance (SPR).18 A visual red-to-blue color change of AuNPs and a spectrum shift to longer wavelength are directly proportional to the concentration of analytes present. AuNPs are nontoxic, biocompatible, and more easily synthesized and photostable than silver nanoparticles, copper nanoparticles, and quantum dots.19,22–24 The application of AuNPs-based electrochemical sensors for As3+ in rice samples has been previously reported and includes the use of a AuNPs-modified boron-doped diamond electrode coupled with a multistep paper-based analytical device (AuNP/BDD-mPAD),25 and glutamic acid-AuNPs with a screen-printed graphene electrode (AuNPs-PGA/SPGE).26 Furthermore, the use of AuNPs as a colorimetric nanoprobe for As3+ detection in water samples depends on surface functionalization of the AuNPs with various compounds, such as lauryl sulphate,20 citrate,21 glutathione,27 glucose,28 glutathione/DL-dithiothreitol/L-cysteine/2,6-pyridinedicarboxylic acid,29 Ars-3 aptamer,30 and polyethylene glycol.31 These approaches have enabled the detection of As3+ in water samples at limits ranging from 0.12 to 16.9 μg L−1. However, these methods have some notable drawbacks, including the need for NaBH4 (a moisture-sensitive reagent), the use of costly dialysis and tedious protocols entailing long functionalization times (15 min–2 h), and multistep procedures. 2,2′-Thiodiacetic acid (TDA) is a cysteine metabolite that occurs in the human body and has been used as a chelating ligand to detect various metals, such as Cu2+, Zn2+, Ni2+, Cr3+, U6+, and Al3+.32–36 In the present study, we functionalized AuNPs with TDA for the specific colorimetric detection of As3+. Also, to reach our goal of an environmentally friendly and cost-effective synthesis of AuNPs, chitosan (CS) was used to reduce and stabilize the AuNPs. CS is a natural polysaccharide polymer, generally derived from chitin, that is comprised of units of β-(1-4)-linked D-glucosamine (GlcN) and N-acetyl-D-glucosamine (GlcNAc). It is considered a biocompatible, biodegradable, and environmentally friendly, nontoxic material, and has gained interest in both reduction and stabilization processes for AuNPs due to its abundance of reactive amino and hydroxyl groups.37–39 However, to the best of our knowledge, CS-stabilized AuNPs functionalized with TDA (CS/AuNPs@TDA) have not been used before for As3+ detection.
In this work, we developed a colorimetric CS/AuNPs@TDA nanoprobe for the detection of As3+. The Au3+ precursor was reduced and stabilized using chitosan to form CS/AuNPs. The surface of CS/AuNPs was then functionalized with TDA to improve the selectivity toward As3+. The thioether of TDA can covalently attach to CS/AuNPs to form an Au–S bond. The carboxylate of TDA has a strong affinity to coordinate with As3+, while CS/AuNPs@TDA aggregates in the presence of As3+. This response to As3+ can be observed by the naked eye as a color change and can also be measured by UV-visible (UV-vis) spectrometry. Here, the condition parameters of the assay were optimized by varying the TDA concentration, pH, reaction temperature, and reaction time. The proposed sensing of As3+ by the CS/AuNPs@TDA was successfully applied to quantify As3+ contamination in rice and water samples.
2 Experimental
2.1 Chemicals and reagents
CS with a molecular weight of 1526.5 g mol−1 was purchased from TCI (Japan). Hydrogen tetrachloroaurate(III) trihydrate (HAuCl4·3H2O, ≥49.0% Au basis) and TDA were obtained from Sigma-Aldrich (USA). Arsenic trioxide (As2O3) was obtained from Fluka (Switzerland). Boric acid (H3BO3) was purchased from Loba-Chemie (India). Acetic acid (CH3COOH), phosphoric acid (H3PO4) and sodium hydroxide (NaOH) were purchased from RCI Labscan (Thailand). Britton–Robinson buffer was prepared by mixing appropriate ratios of H3BO3, CH3COOH, and H3PO4 followed by pH adjustment with NaOH. Sulfuric acid was purchased from Merck (Germany). Hydrogen peroxide (H2O2, 35%) was obtained from Vidhyasom Co. Ltd (Thailand). Deionized (DI) water was used to prepare solutions of the reagents. The glassware was cleaned with freshly prepared aqua regia solution (HCl/HNO3, 3![[thin space (1/6-em)]](https://www.rsc.org/images/entities/char_2009.gif) :1 v/v) before the syntheses and experiments, and subsequently washed thoroughly with water. Chitosan (1% w/v) was prepared in 0.1 M acetic acid at 65 °C. A stock solution of As3+ was prepared by dissolving As2O3 in 0.1 M (final concentration) of hydrochloric acid under sonication and diluted using DI water to obtain concentrations of As3+ in the range of 0.01 to 5.00 mg L−1.
:1 v/v) before the syntheses and experiments, and subsequently washed thoroughly with water. Chitosan (1% w/v) was prepared in 0.1 M acetic acid at 65 °C. A stock solution of As3+ was prepared by dissolving As2O3 in 0.1 M (final concentration) of hydrochloric acid under sonication and diluted using DI water to obtain concentrations of As3+ in the range of 0.01 to 5.00 mg L−1.
2.2 Apparatus
UV-vis absorption spectra were recorded with a Shimadzu UV-2600i UV-visible spectrophotometer (Shimadzu Corporation, Japan) in the 400–800 nm range. The functional groups of particles were investigated by Fourier-transform infrared (FTIR) spectrometry (Nicolet iS5, Thermo Scientific, USA). The size and morphology of the materials were investigated by field emission transmission electron microscopy (FE-TEM) (Talos F200i, Thermo Scientific, Czech Republic). Dynamic light scattering analysis (DLS) and zeta potential analysis were performed using a ZetaPALS instrument (Brookhaven, USA).2.3 Synthesis of the chitosan-stabilized AuNPs
AuNPs were synthesized via the in situ reduction of HAuCl4·3H2O with CS, following the method reported by Tian et al.37 with modifications. Here, 5 mL of 10 mM HAuCl4·3H2O solution was added to a solution of 10 mL of 1% (w/v) CS in a 50 mL beaker under magnetic stirring at 65 °C. The solution color gradually turned from pale yellow to wine-red after 20 min, indicating the formation of CS/AuNPs. Then, after cooling to room temperature, the synthesized CS/AuNPs were centrifuged at 10000 rpm for 30 min to remove any unreacted reactants. The supernatant was discarded, and the CS/AuNPs pellets were dispersed in 15 mL of DI water. Finally, the CS/AuNPs were transferred to an amber bottle and kept at 4 °C for at least 4 days before functionalization with TDA. The concentration of the colloidal CS/AuNPs was calculated according to Beer's law as 19.28 ± 0.95 nM, with a molar absorptivity (ε) of 2.01 × 10⁸ M−1 cm−1 at 520 nm.40 The prepared CS/AuNPs were stable for at least 7 weeks at 4 °C without any shift in the SPR band, nor any sign of aggregation.
2.4 Functionalization of the CS/AuNPs with TDA
To functionalize the CS/AuNPs with TDA (CS/AuNPs@TDA), the CS/AuNPs were 5-fold diluted with DI water. When not in use, these diluted CS/AuNPs were stored in a refrigerator. The diluted CS/AuNPs were capped in an amber bottle at room temperature mixed with 0.025 mM TDA at a ratio of 2:1. The CS/AuNPs@TDA was, and should be, freshly prepared before detecting As3+.
2.5 Colorimetric sensing of As3+
To detect As3+, 250 μL of the sample solution was added to a 1.5 mL Eppendorf tube containing 675 μL of freshly diluted CS/AuNPs@TDA and 75 μL of 5 mM Britton–Robinson buffer (pH 4.0). The mixture was heated in a heating block for 90 min at 90 °C. The change in color depends on the amount of As3+ present in the sample solution. The solution color was observed, photographed, and measured using a UV-vis spectrophotometer.2.6 Sample collection and preparation
Rice and drinking water samples were collected randomly from houses and local shops. Environmental water samples were collected from an abandoned shallow public well (W1), a creek at Huai Nong Ped (W2), and an abandoned tin mine (W3), all in Nakhon Si Thammarat Province, Thailand. The collected water samples were filtered twice with Whatman No. 42 filter paper to remove particulates. Rice samples were digested based on the work of Ghorbanian and Alizadeh16 with modifications. Briefly, rice samples were ground using a mortar to obtain rice powder, which was then sieved (<300 microns) into a container. Concentrated sulfuric acid was added to 0.1250 g of sieved powder, which was digested on a hotplate at about 70 °C for about 5 min. Then, 16.5 mL of H2O2 was added. The solution became clear within 2 min. The clear solution was adjusted with DI water to 100 mL in a volumetric flask and then filtered through Whatman No. 42 filter paper. All the samples were kept in the refrigerator at 4 °C until analysis. The prepared samples were adjusted to pH 7 with 0.1 M HCl or 0.1 M NaOH before detection with CS/AuNPs@TDA.The recoveries of the proposed method were studied at three concentrations of As3+ (0.05, 0.2, and 0.5 mg L−1). Drinking water and filtered water samples (W1, W2, and W3) were spiked with As3+ and left at room temperature for about 5 min. Rice samples were spiked and left at room temperature for at least 24 h. Each sample was pretreated and detected using the CS/AuNPs@TDA as mentioned in Section 2.5. The results obtained by colorimetric detection were compared with the results obtained by inductively coupled plasma-optical emission spectrometry (ICP-OES) (AVIO 500 PerkinElmer, USA).
2.7 Selectivity tests
To evaluate the selectivity of the colorimetric detection for As3+ by CS/AuNPs@TDA, different metal cations (As5+, Cu2+, Fe3+, Fe2+, Hg2+, Al3+, Cr3+, Cd2+, Co2+, Ni2+, Pb2+, Zn2+) and anions (Br−, Cl−, F−, SO42−, NO3−, PO42−) were chosen as interference ions. The ions were prepared by dissolving a certain amount of metal salts (H3AsO4, CuCl2·2H2O, FeCl3·6H2O, FeSO4·7H2O, HgCl2, Al(NO3)3·9H2O, Cr(NO3)3, CdCl2·2.5H2O, CoCl2·6H2O, NiCl2·6H2O, Pb(NO3)2, ZnSO4·7H2O, KBr, KCl, KF, K2SO4, KNO3, K2HPO4) in DI water to obtain concentrations of Cu2+ and Hg2+ at 0.25 mg L−1, and other cations at 1.0 mg L−1 and anions at 2.5 mg L−1. Furthermore, a competitive assay in a mixture containing As3+, and other cations and anions was also assessed. Here, like for As3+ detection, 250 μL of each cation solution or anion solution or mixture solution was added to 675 μL of diluted CS/AuNPs@TDA and 75 μL of 5 mM Britton–Robinson buffer (pH 4.0) in a 1.5 mL Eppendorf tube. Then, each solution was heated at 90 °C for 90 min. After being cooled to room temperature, the changes in the spectra due to the addition of various ions were recorded by UV-vis spectrophotometry. All the measurements were performed in triplicate.3 Results and discussion
3.1 Characterization
CS/AuNPs, CS/AuNPs@TDA, CS/AuNPs@TDA with As3+, and associated materials were characterized by UV-vis spectrometry, FTIR spectroscopy, zeta potential analysis, FE-TEM, and DLS analysis. The UV-vis absorption spectrum of the red-colored dispersion of CS/AuNPs (Fig. 1A, red line) presented a characteristic SPR absorption band at 525 nm. The spectrum of CS/AuNPs@TDA (green line) exhibited the same profile as the spectrum of CS/AuNPs, showing no peak shift. The CS/AuNPs@TDA also remained red. These results indicate that the optimal TDA concentration did not cause CS/AuNPs to aggregate. In the presence of As3+ (blue line), the intensity of the SPR band of CS/AuNPs@TDA at 525 nm decreased and a new band appeared at 645 nm. The color of the nanoparticles changed noticeably from red to bluish purple. The aggregation of CS/AuNPs@TDA was caused by a complexation between As3+ and oxygen in the carboxylate group of TDA based on the concept of hard–soft-acid–base (HSAB) theory.41 We further applied the ratio of the absorbance at 645 and 525 nm (A645/A525) to determine the detection sensitivity.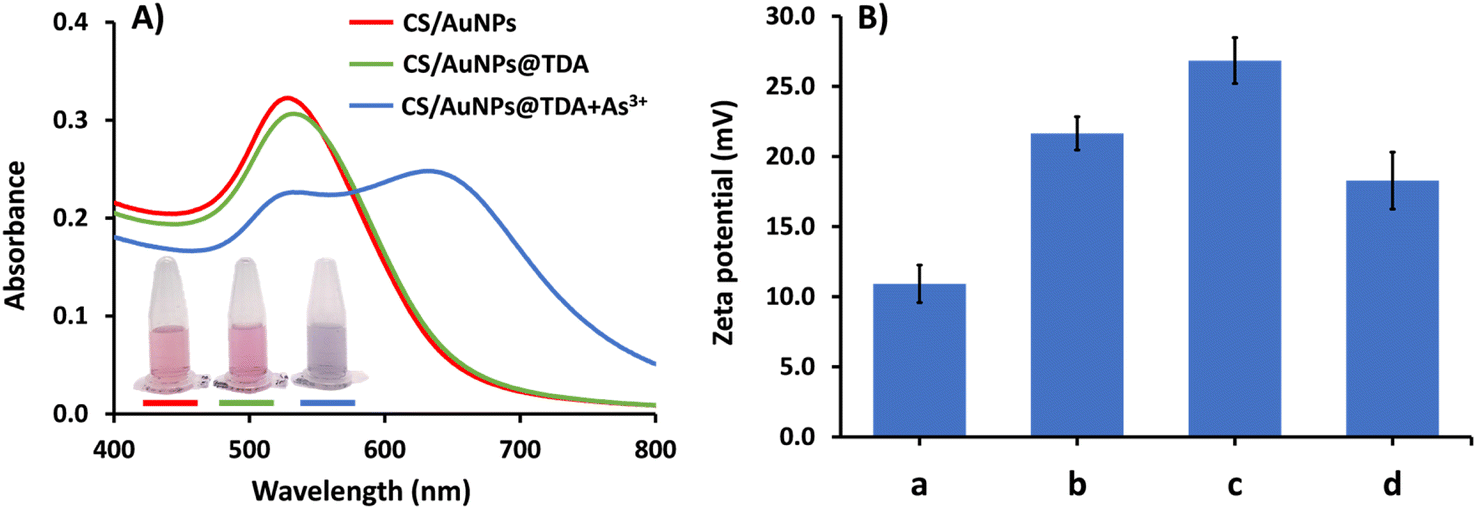 | ||
| Fig. 1 (A) UV-vis spectra and corresponding color images of CS/AuNPs, CS/AuNPs@TDA and CS/AuNPs@TDA with 1.0 mg L−1 of As3+. (B) Zeta potential analysis of (a) CS/AuNPs, (b) CS/AuNPs@TDA, (c) CS/AuNPs@TDA with 0.5 mg per L As3+ and (d) CS/AuNPs@TDA with 1.0 mg per L As3+. | ||
The zeta potentials of CS/AuNPs, CS/AuNPs@TDA, and CS/AuNPs@TDA in the presence of 0.5 mg per L As3+ and 1.0 mg per L As3+ were measured to determine the stability of the AuNPs in various conditions (Fig. 1B). The different particles had positive zeta potential values from +10.92 to +26.84 mV. The positive zeta potential value of CS/AuNPs (10.92 ± 1.34 mV) was due to the amine protonation (–NH3+) of CS and increased after CS/AuNPs were capped with TDA (21.65 ± 1.19 mV). The increased zeta potential of CS/AuNPs@TDA without As3+ was due to electrostatic interaction between the carboxylate (–COO−) group of TDA and –NH3+ of CS and indicated increased stability. The zeta potential of CS/AuNPs@TDA was higher in the presence of 0.5 mg per L As3+ (26.84 ± 1.64 mV) compared to CS/AuNPs@TDA alone because of the complexation between the –COO− groups of TDA and As3+. The complexation reduced the particle stability, allowing a greater aggregation of CS/AuNPs@TDA. However, the increase in the zeta potential was to be expected due to the reduction in the numbers of –COO− groups of TDA that were complexed with As3+ and the exposure of more –NH3+ groups of CS, leading to an increase in the positive charge. Even though CS/AuNPs@TDA with As3+ had reduced stability due to complexation, the overall surface positive charge was higher than that of CS/AuNPs@TDA. Thus, a higher zeta potential of CS/AuNPs@TDA with 0.5 mg per L As3+ was observed. The zeta potential of CS/AuNPs@TDA in the presence of the higher concentration of As3+ (1.0 mg L−1) was lower (18.28 ± 2.03 mV) because higher concentrations of As3+ increased the thickness of the electric double layer (EDL) of the nanoparticles, thus reducing the zeta potential with lesser stability.42 The positive zeta potential values obtained for CS/AuNPs@TDA with and without As3+ were below the recommended limit of ± 30.0 mV, implying a high degree of particle stability.42
In the FTIR spectrum of CS, the peak at 3355 cm−1 (Fig. 2a) indicated the stretching vibrations of N–H and O–H groups, while the peak at 2880 cm−1 indicated C–H stretching from the pyranose rings.38,39 The two peaks at 1650 and 1600 cm−1 confirmed C![[double bond, length as m-dash]](https://www.rsc.org/images/entities/char_e001.gif) O stretching (amide I) from the N-acetyl-D-glucosamine units and N–H bending (amide II) in the D-glucosamine units, respectively. The bands located between 1150 and 900 cm−1 were attributed to C–C and C–O vibrations from the pyranose ring.38,39 The FTIR spectrum of CS/AuNPs (Fig. 2b) presented CS signals with a reduced intensity that were also slightly shifted. The differences between the two spectra also included shifts in CO stretching and N–H bending vibrations to 1700 and 1547 cm−1, respectively, and the loss of the peak for C–H stretching at 2880 cm−1. The peak for N–H bending was also shifted and diminished, indicating the attachment of AuNPs to CS at nitrogen atoms in NH3+ groups.43 The peak for C–O vibration in the CS/AuNPs at 1022 cm−1 was reduced compared to the same peak in the spectrum of CS; possibly due to the hydrolysis of partial glycoside linkages during the synthesis.44 The FTIR results indicated that CS covered the surface of the AuNPs, making the colloidal AuNPs stable in aqueous medium.
O stretching (amide I) from the N-acetyl-D-glucosamine units and N–H bending (amide II) in the D-glucosamine units, respectively. The bands located between 1150 and 900 cm−1 were attributed to C–C and C–O vibrations from the pyranose ring.38,39 The FTIR spectrum of CS/AuNPs (Fig. 2b) presented CS signals with a reduced intensity that were also slightly shifted. The differences between the two spectra also included shifts in CO stretching and N–H bending vibrations to 1700 and 1547 cm−1, respectively, and the loss of the peak for C–H stretching at 2880 cm−1. The peak for N–H bending was also shifted and diminished, indicating the attachment of AuNPs to CS at nitrogen atoms in NH3+ groups.43 The peak for C–O vibration in the CS/AuNPs at 1022 cm−1 was reduced compared to the same peak in the spectrum of CS; possibly due to the hydrolysis of partial glycoside linkages during the synthesis.44 The FTIR results indicated that CS covered the surface of the AuNPs, making the colloidal AuNPs stable in aqueous medium.
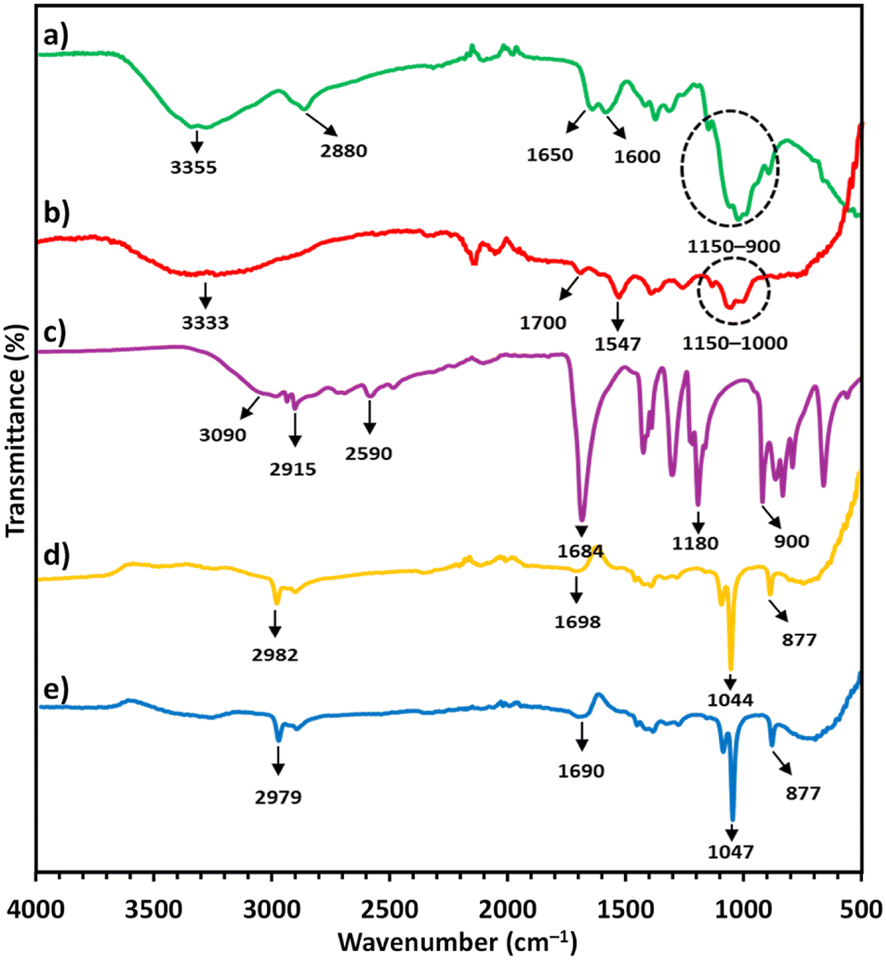 | ||
| Fig. 2 FTIR spectra of (a) pure CS, (b) CS/AuNPs, (c) pure TDA, (d) CS/AuNPs@TDA and (e) CS/AuNPs@TDA with 1.0 mg L−1 of As3+. | ||
The FTIR spectrum of TDA (Fig. 2c) presented peaks at 3090 and 2915–2590 cm−1, corresponding to O–H stretching in the free carboxyl group and symmetric and asymmetric stretching vibrations of the aliphatic –CH2 group, respectively.34,45 The strong peaks at 1684, 1180, and 900 cm−1 (Fig. 2c) were attributed to CO stretching in the carboxyl group, C–O stretching, and out-of-plane OH bending or CH2 bending vibrations, respectively.45,46 Decreased peak intensities of TDA and peak shifts were observed in the CS/AuNPs@TDA spectrum (Fig. 2d). CS signals were also present in the CS/AuNPs@TDA spectrum. The intensity of the OH peaks in TDA was reduced in the spectrum of CS/AuNPs@TDA; probably due to the formation of hydrogen bonds between the N–H in CS and oxygen in TDA.45 Furthermore, the CO peak of TDA at 1180 cm−1 was not present in the spectrum of CS/AuNPs@TDA because of the formation of hydrogen bonds.45 These results indicated that the AuNPs were capped with TDA. CS/AuNPs@TDA was scanned in the presence of 1.0 mg L−1 of As3+ at a solution pH of 4 (Fig. 2e). Compared with the spectrum of CS/AuNPs@TDA, Fig. 2e shows there was a shift in the CO peak from 1698 cm−1 to 1690 cm−1 due to the complexation with As3+ and the deprotonation of the carboxyl groups of TDA. Here, the strongly acidic As3+ interacted with the strongly basic O in carboxylate groups of TDA based on the concept of HSAB theory.41
Next, the morphologies of CS/AuNPs, CS/AuNPs@TDA, and CS/AuNPs@TDA in the presence of 0.5 and 1.0 mg per L As3+ were observed by FE-TEM. The CS/AuNPs and CS/AuNPs@TDA presented spherical and uniform particles with respective average sizes of 12.44 ± 1.22 nm and 12.73 ± 1.25 nm (Fig. 3a and b). However, after adding As3+ to the CS/AuNPs@TDA, the spherical CS/AuNPs@TDA particles (Fig. 3c and d) aggregated. More particle aggregation was observed in the presence of As3+ at 1.0 mg L−1 than 0.5 mg L−1, and the particles were larger in size: 19.04 ± 1.28 nm compared to 16.49 ± 1.30 nm.
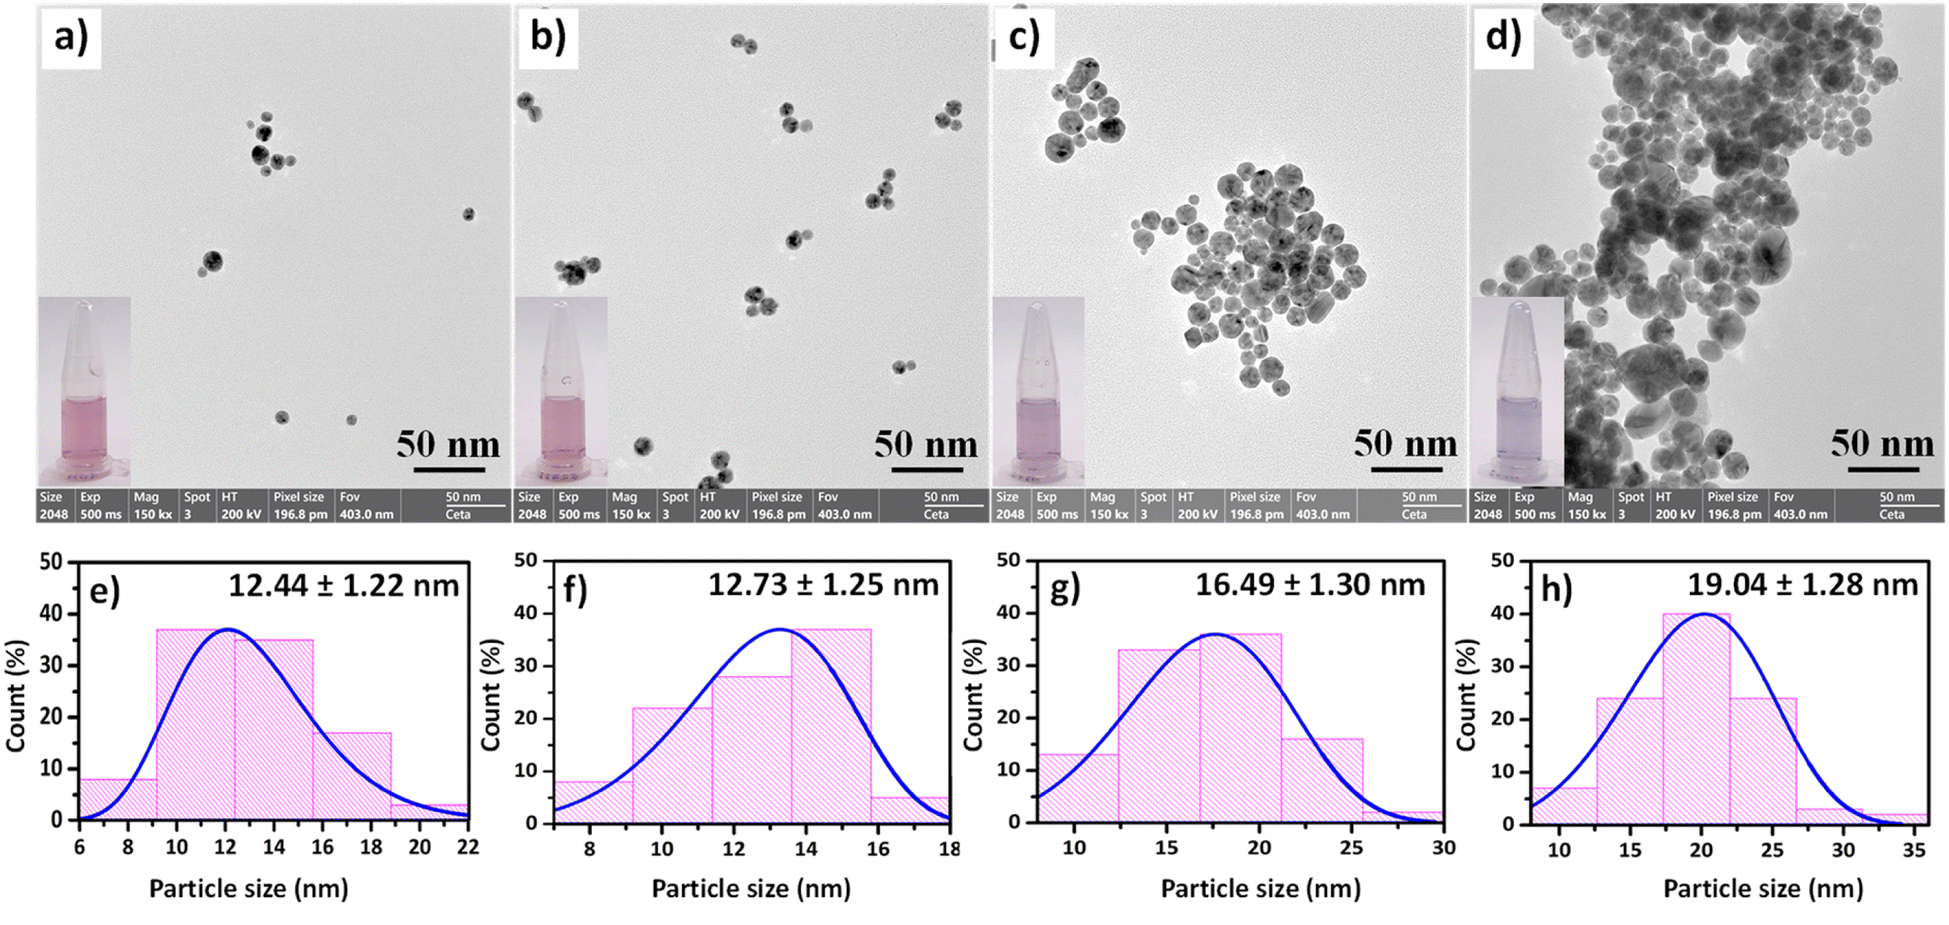 | ||
| Fig. 3 FE-TEM images and size histograms of (a and e) CS/AuNPs, (b and f) CS/AuNPs@TDA, and (c and g) CS/AuNPs@TDA with 0.5 mg per L As3+ and (d and h) CS/AuNPs@TDA with 1.0 mg per L As3+. A magnification of 150000× was applied. | ||
The hydrodynamic diameters of the various particles were determined from DLS data by considering the hydrodynamic diameter of a corresponding theoretical sphere that could diffuse with the same speed as the measured nanoparticle.47 DLS is influenced by the thickness of the electrical double layer moving with the particle.47 The polydispersity index (PDI) was also obtained from DLS to predict the degree of uniformity of the size distribution of the nanoparticles. Generally, particles having a PDI > 0.4 display a polydispersed morphology.48 CS/AuNPs and CS/AuNPs@TDA had diameters of 98.6 ± 0.7 nm (PDI = 0.292) and 89.8 ± 0.5 nm (PDI = 0.292), respectively. CS/AuNPs@TDA in the presence of 0.5 mg per L As3+ was more aggregated and thus its size distribution was 70.1 ± 0.2 nm (PDI = 0.284). This change in diameter corresponded to the changes that took place at the surface of CS/AuNPs from the interaction of TDA and As3+. Surprisingly, in the presence of As3+ at 1.0 mg L−1, the CS/AuNPs@TDA particles increased in size to a diameter of 162.7 ± 1.1 nm (PDI = 0.071). At the higher concentration of As3+, the electrical double layer absorbed on the surface of the nanoparticles was thicker, and therefore the CS/AuNPs@TDA particles were bigger in the presence of As3+ at 1.0 mg L−1 than at 0.5 mg L−1. The PDI values of CS/AuNPs@TDA in the absence and presence of As3+ confirmed that the particles were monodispersed. The results from DLS were consistent with the results from the UV-vis, zeta potential, and FE-TEM studies. It is normal that the particle size determined by DLS is greater than the size obtained from TEM, but both sets of results confirmed that the colloidal AuNPs were assembled with layers of chitosan and TDA.47,49
3.2 Proposed mechanism of detection
The mechanism by which CS/AuNPs@TDA responded to the presence of As3+ is shown in Scheme 1. The mechanism is based on the formation of the TDA–As3+ complex. We utilized CS as a reducing agent in the synthesis of AuNPs due to its electronegative property, and as an electrostatic stabilizer to aid the dispersion of AuNPs through its polyelectrolyte property. CS has free amine (–NH2) groups in D-glucosamine repeating units and with a pKa of 6.5, it is soluble in an acidic solution, which here was 0.1 M acetic acid. Thus, the –NH2 groups of CS can be protonated to –NH3+, resulting in less free –NH2.37,39 The CS-mediated reduction of HAuCl4 can be achieved by two reactions in which the –NH2 and –OH groups play important roles. First, after adding HAuCl4 into an acidic CS solution under heating, AuCl4− can interact with –NH3+ at the C2 position in the CS chains via electrostatic attraction, resulting in the adsorption of AuCl4− on CS.37,50,51 At the same time, electrostatic interaction drives the reduction of the precursor Au3+ (AuCl4−) to Au0 in the form of the AuNPs.48 Simultaneously, the –CHO groups at the C1 position and –CH2OH groups at the C6 position in the CS structure undergo oxidation.38,43,44 The successful reduction was indicated by a color change from pale yellow to wine-red and finally, the surface of AuNPs is coated with a CS shell via an affinity interaction with amino groups (Au–N bond formation). The AuNPs are stable and remain dispersed with no aggregation due to the electrostatic repulsive forces and steric stabilization between particles.51 The steric effect also occurs through repulsive forces between AuNPs. The stabilization of AuNPs was evidenced by the red color of the dispersion and the stable SPR peak at 525 nm.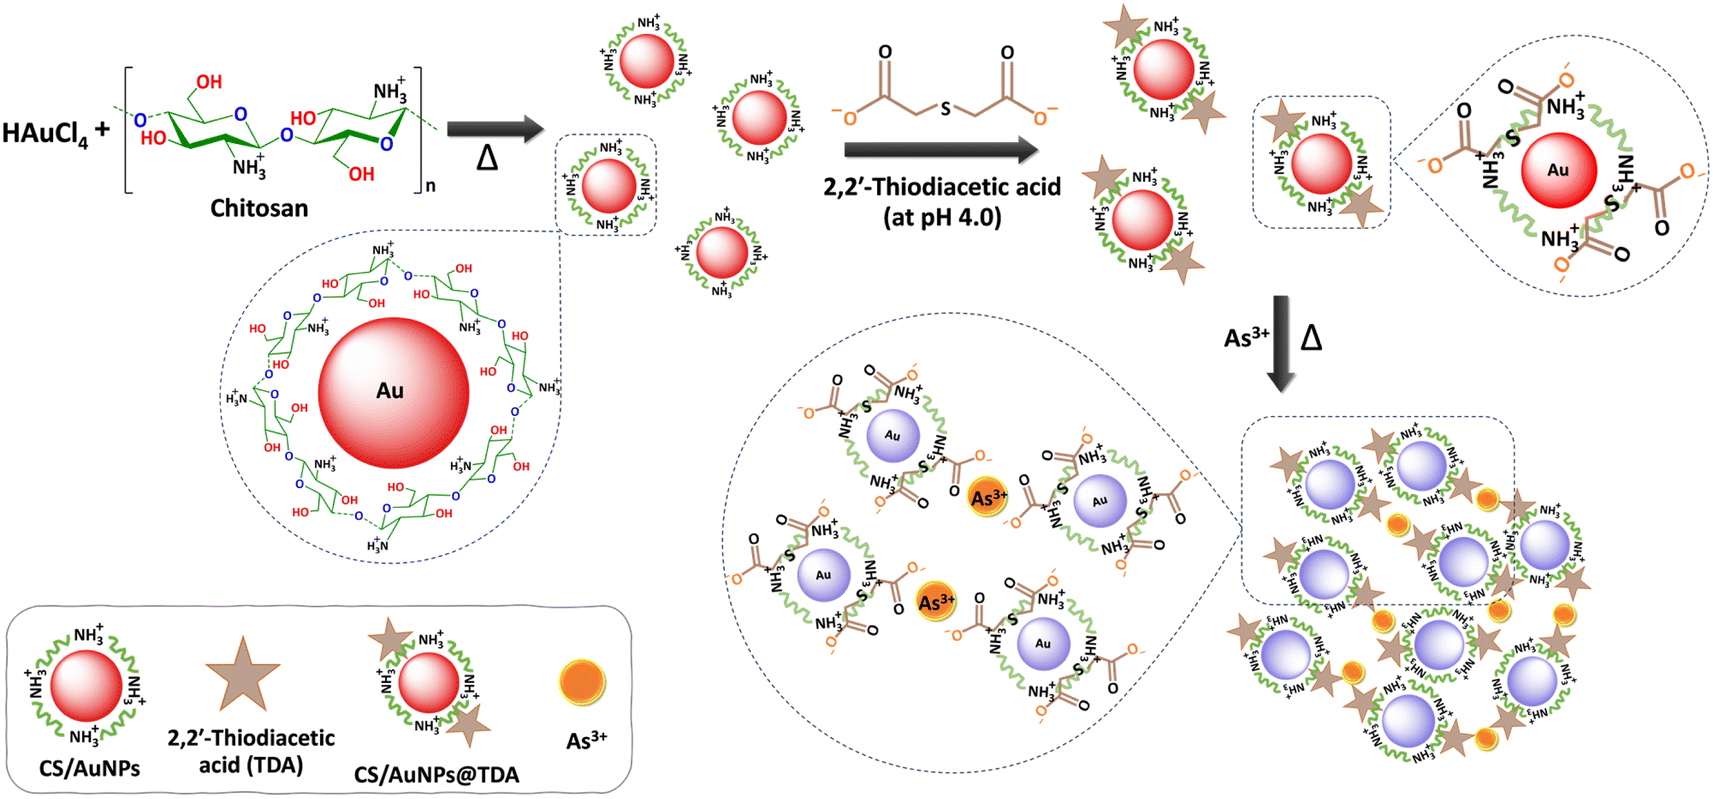 | ||
| Scheme 1 Schematic of the proposed detection mechanism of As3+ by CS/AuNPs@TDA. Chitosan is dissolved in acetic acid; thus, the –NH2 of chitosan is protonated to NH3+. | ||
The abundant carboxyl groups of compounds such as citrate and glutathione, and dicarboxylic acids, such as TDA, 3,3′-thiodipropionic acid and fumaric acid, can coordinate to metals.21,27,32,33 In the present work, we functionalized the surface of CS/AuNPs with TDA, as shown in Scheme 1. TDA is a dicarboxylic organosulfur compound that is widely employed as a multidentate and chelating ligand for different metal ions.32–34 TDA contains a soft thioether and hard oxygen donor atoms, which can bind to hard, soft, or intermediate metal ions according to the HSAB theory.41 In Scheme 1, TDA is deprotonated to a dianion under the optimal condition of pH 4 (pKa1 of TDA = 3.14),52 producing terminal carboxylate (–COO−) groups. The thioether of TDA with a lone pair of electrons is connected to the CS/AuNPs surface via an Au–S covalent bond.33,34 Two carboxylate groups of TDA will be positioned outside the CS/AuNPs surface with one terminal –COO− ionically bonded with –NH3+ in the CS backbone and another terminal –COO− free to coordinate with As3+. The carboxylate groups of TDA have previously been reported to stabilize nanoparticles33,34 and the –NH3+ of CS has been shown to interact with oxygen in TDA via hydrogen bonding.45 Under optimal conditions, the CS/AuNPs@TDA is stable without any sign of aggregation, as confirmed by the results from the UV-vis, FE-TEM, DLS, and zeta potential analyses. In the presence of As3+, the oxygen (hard base) in the free –COO− group of TDA shows strong affinity with As3+ (hard acid) through complexation (As–O bond formation). To determine the stoichiometry of the complex, a Job's plot for the absorbance after reaction was measured. Fig. S1† demonstrates a plot of the absorbance at 645 nm versus the mole fraction of As3+. As obtained by Job's plot, the absorbance of the mole fraction of As3+ was highest at 0.325, thus CS/AuNPs@TDA was 0.675, indicating that the complex formation of As3+ with the CS/AuNPs@TDA probe was in a 1:2 stoichiometry. Moreover, the adjacent CS/AuNPs@TDA can be cross-linked by a chelation reaction between As3+ and TDA, reducing the inter-particle distance. As a result, the complexation induces a strong aggregation of the CS/AuNPs@TDA particles, producing a color change from red to bluish purple and a red-shift from 525 nm to 645 nm.
3.3 Optimizations of the condition variables
The performance of the assay can be affected by various conditions, such as the concentration of TDA and solution pH. Thus, the experimental variables were optimized to achieve the best sensitivity and efficiency of detection. A preliminary test for As3+ detection among other cations, i.e. As5+, Al3+, Ni2+, Fe2+, Fe3+, Cr3+, Cd2+, Zn2+, Co2+, Pb2+, and Hg2+, was conducted. The test showed that when the surface of the CS/AuNPs was not functionalized and pH-adjusted, Fe3+, Pb2+, and Hg2+ interfered with the colorimetric response of As3+ and that TDA-functionalized CS/AuNPs (CS/AuNPs@TDA) sensed As3+ only at a pH below 4. Thus, TDA was essential for the selectivity of the method. The effect of the TDA concentration was studied in the range of 0.01–0.20 mM (Fig. 4a). The A645/A525 ratio was highest at 0.025 mM TDA and afterwards decreased noticeably, since an excessive amount of TDA induced the aggregation of CS/AuNPs, reducing the response to As3+. Therefore, the optimal concentration of TDA was 0.025 mM.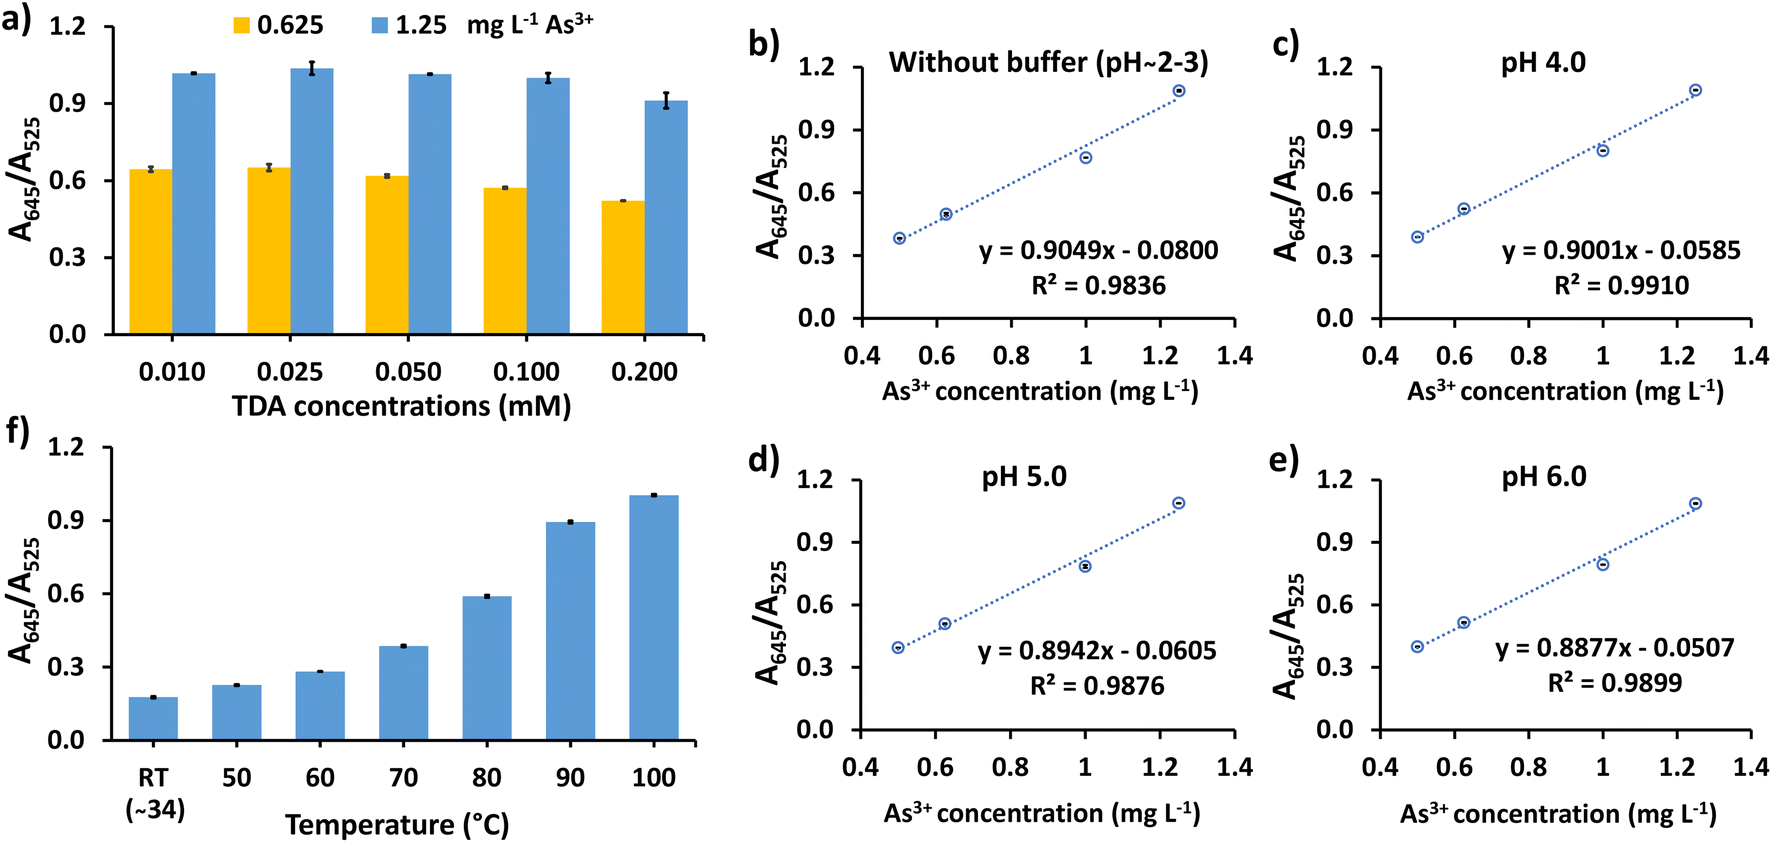 | ||
| Fig. 4 (a) Effect of TDA concentration on the detection of As3+ at 0.625 and 1.25 mg L−1, (b–e) effect of pH (3.0 to 6.0) of 5 mM Britton–Robinson buffer on the sensitivity of the linear plot between the A645/A525 ratio and As3+ ranging from 0.5 to 1.25 mg L−1, and (f) the effect of reaction temperature on the detection of As3+ at 1.0 mg L−1. | ||
The effect of pH of Britton–Robinson buffer from 3.0 to 10.0 on the aggregation of CS/AuNPs@TDA in the presence of As3+ was studied, as shown in Fig. S2.† In the absence of As3+, CS/AuNPs@TDA (blank solution) started aggregating from pH 7 to 10 as noted by observing the red-to-purple colored change (Fig. S2a†) and increased UV-vis spectrum (Fig. S2b†). In the presence of 1.0 mg L−1 As3+, a little change of aggregation of CS/AuNPs@TDA was observed when the pH was varied (Fig. S2c†). Since the blank solution aggregated at pH 7–10, we decided to study the sensitivity of As3+ detection from 0.5 to 1.25 mg L−1 (Fig. 4b–e) at pH from 3.0 to 6.0 by plotting the A645/A525 ratio versus the As3+ concentration. The best linearity for the studied concentration range was obtained by using Britton–Robinson buffer at pH 4, which was therefore the pH used in the next experiment.
The reaction temperature can increase the aggregation rate of the nanoparticles,53 thus the effect of temperature was studied from room temperature (about 34 °C) to 100 °C (Fig. 4f). When the reaction temperature was increased from about 34 °C to 100 °C, the A645/A525 ratio increased with temperature, confirming the increased aggregation of CS/AuNPs@TDA. However, a blank dispersion of CS/AuNPs@TDA (without As3+) started to aggregate at 100 °C, with CS/AuNPs@TDA changing color from red to bluish purple. Therefore, 90 °C was chosen as the optimal reaction temperature of CS/AuNPs@TDA with As3+.
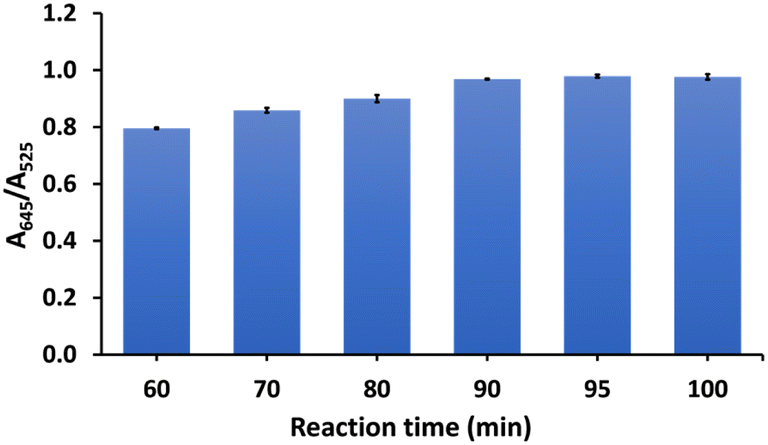
The effect of the reaction time on the detection of As3+ was studied at 10 min intervals from 60 to 100 min at a temperature of 90 °C (Fig. 5). We found the color of CS/AuNPs@TDA changed from 60 min to 90 min. Thus, it can be mentioned that the probe started responding to As3+ at 60 min. The A645/A525 ratio increased with time from 60 to 90 min and then remained constant. Therefore, to achieve the highest detection, the reaction time at 90 min was selected as optimal.
 | ||
| Fig. 5 Effect of reaction time on the detection of 1.0 mg L−1 of As3+. | ||
3.4 Analytical validation
Under optimal conditions, concentrations of As3+ from 0.01 to 5.00 mg L−1 were added to CS/AuNPs@TDA to evaluate the detection method (Fig. 6). As the concentration of As3+ was increased, the CS/AuNPs@TDA changed from a dispersed state to an aggregated state, accompanied by a corresponding color change from red to bluish purple and a red-shift in the SPR band from 525 nm to 645 nm (Fig. 6a). Fig. 6b shows the plot of the A645/A525 ratio against As3+ concentrations from 0.01 to 5.00 mg L−1. The A645/A525 ratio exhibited a linear relationship with the As3+ concentration from 0.01 to 1.00 mg L−1 with a linear regression equation of y(A645/A525) = (0.7603 ± 0.0436)x (mg L−1) + (0.2361 ± 0.0264) and an R2 of 0.9902 (Fig. 6c). The limit of detection (LOD) was calculated as = 3.3σ/S and the limit of quantification (LOQ) as = 10σ/S, where σ is the standard deviation of the blank (n = 15) and S is the slope of the linear calibration curve.54 The values of σ (Table S1†) and S were 0.0014 and 0.7603, respectively. As a result, the LOD and LOQ were found to be 0.0061 and 0.0184 mg L−1, respectively.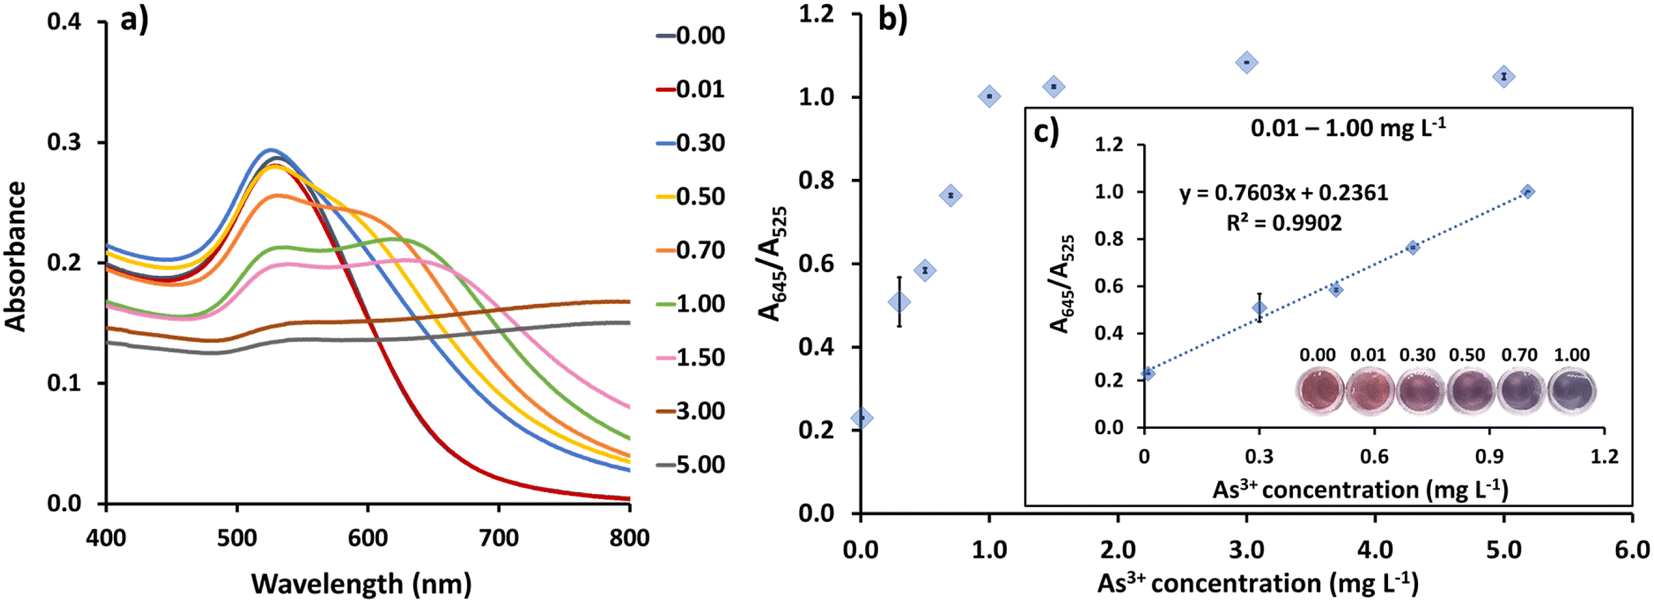 | ||
| Fig. 6 (a) UV-vis spectra of CS/AuNPs@TDA in the presence of eight concentrations of As3+. (b) Plot of the absorbance ratio (A645/A525) vs. As3+ concentration from 0.01 to 5.00 mg L−1. (c) Linear calibration plot for the As3+ concentration range of 0.01–1.00 mg L−1 and the corresponding color response. | ||
The precision of the detection method was evaluated at three concentrations of As3+ (0.10, 0.50, and 1.00 mg L−1) on the same day (intraday; n = 5), and at the same three concentrations on three consecutive days (interday; n = 3 for each day) (Table 1). The relative standard deviations (RSDs) for the intraday and interday precisions ranged from 1.22% to 2.98% and 0.45% to 3.27%, respectively, demonstrating the good precision of the method.
| As3+ (mg L−1) | RSD (%) | |
|---|---|---|
| Intraday (n = 5) | Interday (3 days) | |
| 0.10 | 2.98 | 3.01 |
| 0.50 | 2.87 | 3.27 |
| 1.00 | 1.22 | 0.45 |
3.5 Selectivity
The selectivity of the proposed method was tested against 12 cations, namely (As5+, Cu2+, Fe3+, Fe2+, Hg2+, Al3+, Cr3+, Cd2+, Co2+, Ni2+, Pb2+, Zn2+), and six anions, namely Br−, Cl−, F−, SO42−, NO3−, and PO42− (Fig. 7). These metal ions are found naturally or as contaminants in food. Heavy metals, such as Hg2+, Cr3+, Cd2+, Ni2+, and Pb2+ especially pose a risk to human health.55 The anions, i.e., Br−, Cl−, F−, SO42−, NO3−, PO42−, are of interest since they have been detected in bottled drinking water and river stream.56,57 It was found that As3+ gave the highest A645/A525 ratio, accompanied by appropriate color responses, while the other ions exhibited A645/A525 ratios that were either significantly lower or equal to the blank intensity (red bar) of ∼0.22. Moreover, the A645/A525 ratio of CS/AuNPs@TDA in the presence of a mixture of As3+ and other studied ions (yellow bar) was relatively consistent with the ratio produced in the presence of As3+ alone (orange bar). This result confirmed the good selectivity of CS/AuNPs@TDA toward As3+.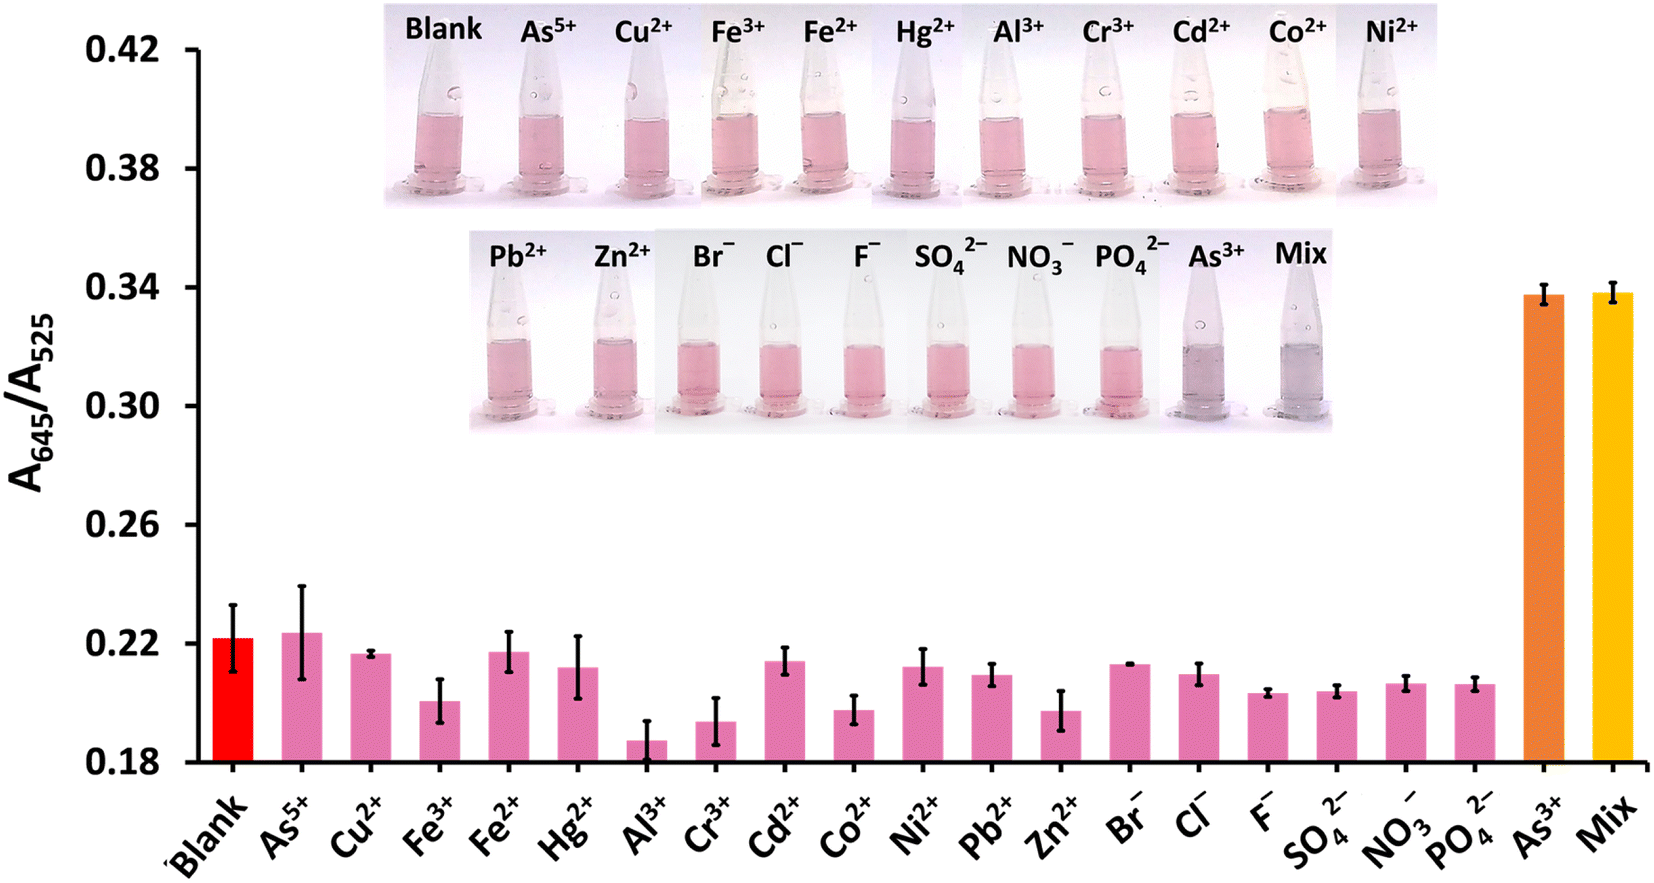 | ||
| Fig. 7 Selectivity study of the CS/AuNPs@TDA for As3+ detection. The absorbance ratio (A645/A525) of the nanoprobe was plotted in the presence of a single analyte (As5+, Cu2+, Fe3+, Fe2+, Hg2+, Al3+, Cr3+, Cd2+, Co2+, Ni2+, Pb2+, Zn2+, Br−, Cl−, F−, SO42−, NO3− and PO42−) and a mixture (Mix) of As3+ and the other ions. All signals were compared with the signal for CS/AuNPs@TDA without cations and anions (blank) and As3+. The inset shows the corresponding colorimetric responses for ion detection. The concentrations of As3+, Cu2+ and Hg2+ were 0.25 mg L−1 whereas the other cations were at 1.0 mg L−1. The concentrations of the anions were 2.5 mg L−1. | ||
3.6 Comparison with previously reported methods
The proposed detection method based on CS/AuNPs@TDA was compared with previous studies (Table 2) in terms of its linear range, LOD, and recovery. Our colorimetric method provided a wide linear range and had comparable recovery values to the other methods. Its LOD was as low as some reported studies and lower than 10 μg L−1, which is the standard limit in drinking water.7 We also investigated the fluorescence spectra of the CS/AuNPs, CS/AuNPs@TDA, and CS/AuNPs@TDA in the presence of 0.5 and 1.0 mg L−1 of As3+, as shown in Fig. S3.† The CS/AuNPs and CS/AuNPs@TDA showed no emission peak. Moreover, no fluorescence of CS/AuNPs@TDA was produced after the addition of As3+. Compared to sophisticated techniques such as atomic absorption spectrometry, electrochemistry, and fluorescence spectrometry, our method offers a cost-effective detection solution and simple operation without instrument maintenance requirements.| Detection method | Linear range (μg L−1) | LOD (μg L−1) | Recovery (%) | Reference |
|---|---|---|---|---|
| a AuNPs/SPGE = gold nanoparticles/screen-printed graphene electrode; MSA-CdTe QDs = mercaptosuccinic acid-capped CdTe quantum dots; LS = lauryl sulphate; GSH-DTT-CYs-PDCA = glutathione-dithiothreitol-L-cysteine-2,6-pyridinedicarboxylicacid; CTAB = cetyltrimethylammonium bromide. | ||||
| Hydride generation atomic fluorescence spectrometry | 0.1–10 | 0.023 | 96.7–105 | 11 |
| Electrochemistry (AuNPs/SPGE) | 100–150 | 30 | 90.1–109.7 | 14 |
| Fluorescence detection (MSA-CdTe QDs) | 50–1000 | 16 | 92.0–112.0 | 17 |
| Colorimetry (LS-AuNPs) | 5–500 | 2 | — | 20 |
| Colorimetry (citrate-AuNPs) | 4–100 | 1.8 | 95.0–102.8 | 21 |
| Colorimetry (glucose-AuNPs) | 20–500 | 5.6 | — | 28 |
| Colorimetry (GSH-DTT-CYs-PDCA-AuNPs) | 2–20 | 2.5 | 77.4–128.2 | 29 |
| Colorimetry (Ars-3 aptamer-CTAB-AuNPs) | 1–100 | 16.9 | 95.6–107.3 | 30 |
| Colorimetry (polyethylene glycol-AuNPs) | 5–20 | 5 | — | 31 |
| Colorimetry (CS/AuNPs@TDA) | 10–1000 | 6.1 | 88.2–105.7 | Present work |
3.7 Detection of As3+ in real samples
To investigate the efficiency of the developed assay, CS/AuNPs@TDA was applied to detect As3+ in rice, drinking water, and environmental water samples, as presented in Tables S2 and S3.† The concentrations of As3+ detected by CS/AuNPs@TDA were compared to the results obtained from ICP-OES analysis to ensure accuracy. Spike and recovery tests were also performed using three concentration levels of As3+ (0.05, 0.20, and 0.50 mg L−1). The results showed that no concentration of As3+ was detected by CS/AuNPs@TDA in the unspiked samples, except for the W3 sample, which was found to contain 0.007 ± 0.002 mg L−1 of As3+, which was lower than our LOQ (0.018 mg L−1). This result agreed with the result from ICP-OES (0.008 ± 0.004 mg L−1 of As3+). Recoveries were obtained by the CS/AuNPs@TDA in the range of 91.27–104.24% in rice samples, 93.54–99.18% in drinking water, and 88.22–105.74% in environmental water samples, with RSDs ranging from 0.72% to 2.94%, 0.34% to 2.91%, and 0.25% to 2.99%, respectively. The recoveries and RSDs results of our method were not significantly different from those of ICP-OES based on Student's t-test and ANOVA at a 95% confidence level. These results demonstrate that the proposed CS/AuNPs@TDA can be applied for the on-site testing of As3+ and as an alternative to ICP-OES analysis.4 Conclusions
A sensitive and selective colorimetric assay for As3+ detection was developed. The probe was prepared by reducing HAuCl4 with chitosan and functionalizing the chitosan-stabilized AuNPs with TDA to form CS/AuNPs@TDA through an Au–S bond. The CS/AuNPs@TDA interacts with As3+ at the carboxylate group of TDA and aggregates, changing color in the process. FTIR, FE-TEM, DLS, and zeta potential analyses confirmed the aggregation due to As3+, together with a visual color changes and red-shift in the spectrum. The relationship between A645/A525 and the As3+ concentration was linear from 10 to 1000 μg L−1. The proposed method had an LOD of 6.1 μg L−1, achieved recoveries above 88.23%, showed interday and intraday precisions of less than 3.28%, and good selectivity against other metal ions. The proposed method was used to detect As3+ in real rice and water samples. The application of CS/AuNPs@TDA for the determination of As3+ in soils samples is of interest in subsequent projects.Data availability
The data supporting this article have been included as part of the ESI.†Author contributions
Asmah Kuno: methodology, validation, formal analysis, writing – original draft. Nuryanee Hama: investigation, visualization. Panwadee Wattanasin: validation, writing – review & editing. Thitima Rujiralai: conceptualization, investigation, validation, visualization, writing – review & editing, supervision, funding acquisition.Conflicts of interest
There are no conflicts to declare.Acknowledgements
This research was supported by the National Science, Research and Innovation Fund (NSRF) and Prince of Songkla University (Ref. No. SCI6701120S). The Center of Excellence for Innovation in Chemistry (PERCH-CIC), Ministry of Higher Education, Science, Research and Innovation, Faculty of Science, Prince of Songkla University was acknowledged for partial support. We thank Mr Thomas Duncan Coyne for English proofreading.References
- European Food Safety Authority (EFSA), EFSA J., 2009, 7, 1351–1549, DOI:10.2903/j.efsa.2009.1351.
- H. Garelick, H. Jones, A. Dybowska and E. Valsami-Jones, in Reviews of Environmental Contamination and Toxicology Volume 197, ed. D. M. Whitacre, Springer Science + Business Media LLC, New York, 2008, ch 2, p. 44 Search PubMed.
- A. K. Sharma, J. C. Tjell, J. J. Sloth and P. E. Holm, Appl. Geochem., 2014, 41, 11–33, DOI:10.1016/j.apgeochem.2013.11.012.
- R. B. Neumann, A. P. St Vincent, L. C. Roberts, A. B. M. Badruzzaman, M. A. Ali and C. F. Harvey, Environ. Sci. Technol., 2011, 45, 2072–2078, DOI:10.1021/es102635d.
- B. Booth, Environ. Sci. Technol., 2009, 43, 1243–1244, DOI:10.1021/es900020m.
- The International Agency for Research on Cancer, IARC Monographs on the identification of carcinogenic hazards to humans, https://monographs.iarc.who.int/list-of-classifications, accessed June 2024.
- United States Environmental Protection Agency (U.S. EPA), Drinking water arsenic rule history, https://www.epa.gov/dwreginfo/drinking-water-arsenic-rule-history, accessed June 2024.
- United States Food and Drug Administration (U.S. FDA), Supporting document for action level for inorganic arsenic in rice cereals for infants, https://www.fda.gov/food/chemical-metals-natural-toxins-pesticides-guidance-documents-regulations/supporting-document-action-level-inorganic-arsenic-rice-cereals-infants, accessed June 2024.
- M. Kanke, T. Kumamaru, K. Sakai and Y. Yamamoto, Anal. Chim. Acta, 1991, 247, 13–18, DOI:10.1016/S0003-2670(00)83046-9.
- F. L. Pantuzzo, J. C. J. Silva and V. S. T. Ciminelli, J. Hazard. Mater., 2009, 168, 1636–1638, DOI:10.1016/j.jhazmat.2009.03.005.
- X.-P. Yan, X.-B. Yin, X.-W. He and Y. Jiang, Anal. Chem., 2002, 74, 2162–2166, DOI:10.1021/ac0157019.
- C. Huang, W. Xie, X. Li and J. Zhang, Microchim. Acta, 2011, 173, 165–172, DOI:10.1007/s00604-010-0532-9.
- J. F. R. Paula, R. E. S. Froes-Silva and V. S. T. Ciminelli, Microchem. J., 2012, 104, 12–16, DOI:10.1016/j.microc.2012.03.019.
- W. Khamcharoen, P. Duchda, K. Songsrirote, N. Ratanawimarnwong, N. Limchoowong, P. Jittangprasert, T. Mantima and W. Siangproh, Anal. Methods, 2022, 14, 3087–3093, 10.1039/D2AY00782G.
- Q. Tang, G. Zhu, Y. Ge, J. Yang, M. Huang and J. Liu, J. Electroanal. Chem., 2020, 873, 114381–114389, DOI:10.1016/j.jelechem.2020.114381.
- N. Ghorbanian and N. Alizadeh, J. Food Compos. Anal., 2024, 126, 105942–105948, DOI:10.1016/j.jfca.2023.105942.
- O. Thepmanee, K. Prapainop, O. Noppha, N. Rattanawimanwong, W. Siangproh, O. Chailapakul and K. Songsrirote, Anal. Methods, 2020, 12, 2718–2726, 10.1039/D0AY00273A.
- X. Hu, Y. Zhang, T. Ding, J. Liu and H. Zhao, Front. Bioeng. Biotechnol., 2020, 8, 990–1006, DOI:10.3389/fbioe.2020.00990.
- S. J. Amina and B. Guo, Int. J. Nanomed., 2020, 15, 9823–9857, DOI:10.2147/ijn.s279094.
- K. Shrivas, R. Shankar and K. Dewangan, Sens. Actuators, B, 2015, 220, 1376–1383, DOI:10.1016/j.snb.2015.07.058.
- L. Gong, B. Du, L. Pan, Q. Liu, K. Yang, W. Wang, H. Zhao, Li. Wu and Y. He, Microchim. Acta, 2017, 184, 1185–1190, DOI:10.1007/s00604-017-2122-6.
- Y. A. Attia, D. Buceta, F. G. Requejo, L. J. Giovanetti and M. A. López-Quintela, Nanoscale, 2015, 7, 11273–11279, 10.1039/C5NR01887K.
- M. D. Susman, Y. Feldman, A. Vaskevich and I. Rubinstein, Chem. Mater., 2012, 24, 2501–2508, DOI:10.1021/cm300699f.
- W. R. Algar, M. Massey and U. J. Krull, TrAC, Trends Anal. Chem., 2009, 28, 292–306, DOI:10.1016/j.trac.2008.11.012.
- K. Pungjunun, S. Chaiyo, I. Jantrahong, S. Nantaphol, W. Siangproh and O. Chailapakul, Microchim. Acta, 2018, 185, 324–331, DOI:10.1007/s00604-018-2821-7.
- S. Kruekaew, Master thesis, Srinakharinwirot University, 2018.
- B. Zheng, J. Li, Z. Zheng, C. Zhang, C. Huang, J. Hong, Y. Li and J. Wang, Opt. Laser Technol., 2021, 133, 106522–106527, DOI:10.1016/j.optlastec.2020.106522.
- B. Sahu, R. Kurrey, M. K. Deb, K. Shrivas, I. Karbhal and B. R. Khalkho, RSC Adv., 2021, 11, 20769–20780, 10.1039/D1RA02929K.
- R. Domínguez-González, L. G. Varela and P. Bermejo-Barrera, Talanta, 2014, 118, 262–269, DOI:10.1016/j.talanta.2013.10.029.
- N. L. Thao Nguyen, C. Y. Park, J. P. Park, S. K. Kailasa and T. J. Park, New J. Chem., 2018, 42, 11530–11538, 10.1039/C8NJ01097H.
- B. S. Boruah and R. Biswas, Mater. Res. Express, 2018, 5, 015059, DOI:10.1088/2053-1591/aaa661.
- I. Loubalová and P. Kopel, Molecules, 2023, 28, 1445–1473, DOI:10.3390/molecules28031445.
- M. R. Fallahi and G. Khayatian, Curr. Anal. Chem., 2017, 13, 167–173, DOI:10.2174/1573411012666161102164539.
- S. Faham, G. Khayatian, H. Golmohammadi and R. Ghavami, Microchim. Acta, 2018, 185, 374–380, DOI:10.1007/s00604-018-2875-6.
- P. Di Bernardo, P. Zanonato, A. Bismondo, H. Jiang, A. Y. Garnov, J. Jiang and L. Rao, Eur. J. Inorg. Chem., 2006, 2006, 4533–4540, DOI:10.1002/ejic.200600554.
- S. N. Dubey, A. Singh, H. L. Kalra and D. M. Puri, J. Indian Chem. Soc., 1979, LVI, 451–454 Search PubMed.
- K. Tian, G. Siegel and A. Tiwari, Mater. Sci. Eng., C, 2017, 71, 195–199, DOI:10.1016/j.msec.2016.10.006.
- A. Leiva, S. Bonardd, M. Pino, C. Saldías, G. Kortaberria and D. Radić, Eur. Polym. J., 2015, 68, 419–431, DOI:10.1016/j.eurpolymj.2015.04.032.
- Y.-C. Wang, C. O. Mohan, J. Guan, C. N. Ravishankar and S. Gunasekaran, Food Control, 2018, 85, 186–193, DOI:10.1016/j.foodcont.2017.09.031.
- M. M. Maye, L. Han, N. N. Kariuki, N. K. Ly, W.-B. Chan, J. Luo and C.-J. Zhong, Anal. Chim. Acta, 2003, 496, 17–27, DOI:10.1016/S0003-2670(03)00986-3.
- H. Hu, H. He, J. Zhang, X. Hou and P. Wu, Nanoscale, 2018, 10, 5035–5046, 10.1039/C8NR00350E.
- S. Bhattacharjee, J. Controlled Release, 2016, 235, 337–351, DOI:10.1016/j.jconrel.2016.06.017.
- A. Komalam, L. G. Muraleegharan, S. Subburaj, S. Suseela, A. Babu and S. George, Int. Nano Lett., 2012, 2, 26–34, DOI:10.1186/2228-5326-2-26.
- A. Pestov, A. Nazirov, E. Modin, A. Mironenko and S. Bratskaya, Carbohydr. Polym., 2015, 117, 70–77, DOI:10.1016/j.carbpol.2014.09.030.
- V. Gomathi and C. Theivarasu, Acta Crystallogr., 2017, C73, 97–103, DOI:10.1107/S2053229617000559.
- T. Kondratenko, O. Ovchinnikov, I. Grevtseva, M. Smirnov, O. Erina, V. Khokhlov, B. Darinsky and E. Tatianina, Materials, 2020, 13, 909–923, DOI:10.3390/ma13040909.
- K. Soliwoda, E. Tomaszewska, B. Tkacz-Szczesna, M. Rosowski, G. Celichowski and J. Grobelny, Pol. J. Chem. Technol., 2014, 16, 86–91, DOI:10.2478/pjct-2014-0015.
- K. N. Clayton, J. W. Salameh, S. T. Wereley and T. L. Kinzer-Ursem, Biomicrofluidics, 2016, 10, 054107–054120, DOI:10.1063/1.4962992.
- V.-D. Doan, B.-A. Huynh, T.-D. Nguyen, X.-T. Cao, V.-C. Nguyen, T. L.-H. Nguyen, H. T. Nguyen and V. T. Le, J. Nanomater., 2020, 2020, 1–18, DOI:10.1155/2020/8492016.
- S. Alex, K. Tian, S. Teng, G. Siegel and A. Tiwari, J. Cryst. Growth, 2014, 406, 12–17, DOI:10.1016/j.jcrysgro.2014.08.008.
- S. Grammatikos, I. Svoliantopoulos and E. Gizeli, Anal. Chem., 2023, 95, 18514–18521, DOI:10.1101/2023.06.09.23291198.
- V. Cerda, E. Casassas, F. Borrull and M. Esteban, Thermochim. Acta, 1982, 55, 1–10, DOI:10.1016/0040-6031(82)87001-9.
- A. Dutta, A. Paul and A. Chattopadhyay, RSC Adv., 2016, 6, 82138–82149, 10.1039/C6RA17561A.
- ICH, Q2B Validation of Analytical Procedures: Methodology, ICH-Q2B, 1996, pp. 1–10, https://www.fda.gov/media/71725/download, accessed June 2024.
- M. S. Sankhla, M. Kumari, M. Nandan, R. Kumar and P. Agrawal, Int. J. Curr. Microbiol. Appl. Sci., 2016, 5, 759–766, DOI:10.20546/ijcmas.2016.510.082.
- H. Daraei, A. Maleki, A. H. Mahvi, L. Alaei, R. Rezaee, E. Ghahremani and N. Mirzaei, J. Water Chem. Technol., 2015, 37, 253–257, DOI:10.3103/S1063455X15050082.
- R. K. Gandhi, N. Sharma and A. K. Raina, Environ. Conserv. J., 2018, 19, 17–30, DOI:10.36953/ECJ.2018.19302.
Footnote |
| † Electronic supplementary information (ESI) available. See DOI: https://doi.org/10.1039/d4ra04961f |
| This journal is © The Royal Society of Chemistry 2024 |