DOI:
10.1039/D4RA04397A
(Paper)
RSC Adv., 2024,
14, 25359-25368
Composite hydrogels based on deep eutectic solvents and lysine for pressure sensors and adsorption of Fe3+
Received
16th June 2024
, Accepted 18th June 2024
First published on 14th August 2024
Abstract
This study explored the preparation of a novel composite hydrogel based on deep eutectic solvent (DES) with lysine (Lys) and its application in pressure sensing and Fe3+ adsorption. DES was synthesized from acrylamide (AM) and urea (U) as hydrogen bond donors (HBD) with choline chloride (ChCl) as hydrogen bond acceptor (HBA), and Lys was used as a functional filler, and Lys/P(AM-U-ChCl) composite hydrogels were successfully prepared by frontal polymerization (FP) method. The structure of the hydrogels was characterized in depth using Fourier transform infrared spectroscopy (FTIR) and scanning electron microscopy (SEM). The effects of Lys content on the mechanical properties, pH-responsive behavior, pressure-sensitive properties, and Fe3+ adsorption capacity of the hydrogels were further analyzed. It was found that the introduction of Lys significantly improved the compressive and pressure-sensitive properties of the hydrogels. The composite hydrogels exhibited excellent swelling equilibrium rates at different pH values. The capacitance change of the hydrogel with 0.5 wt% Lys at 200 g pressure was 2.12-fold higher than that of the hydrogel without Lys addition, and the adsorption efficiency of the hydrogel for Fe3+ was greatly enhanced. This study provides a new idea for the functionalized design of composite hydrogels and demonstrates their great application prospects in high-performance pressure sensors and heavy metal ion adsorption.
1. Introduction
Hydrogels are a class of polymers that form a three-dimensional network structure through chemical covalent bonding or physical linkages, with excellent water retention and reversible three-dimensional structure, capable of absorbing large amounts of water and maintaining the stability of the gel structure.1,2 Due to their excellent properties, such as hydrophilicity, stimulus responsiveness, biocompatibility, and high elasticity, hydrogels have shown a wide range of applications in biomedicine,3,4 agriculture,5 food additives,6 wastewater treatment,7,8 and energy storage.9 In biomedicine, hydrogels are widely used in drug delivery systems, tissue engineering scaffolds, and wound dressings.10,11 In agriculture and food additives, hydrogels can effectively regulate the release of water and nutrients.12 In wastewater treatment, hydrogels achieve water purification by adsorbing heavy metal ions and organic pollutants.13 In addition, hydrogels have shown great potential in the field of energy storage.14 Hydrogels can change their volume in response to changes in the external environment (e.g., pH, electrical stimulation, electric field, magnetic field, ionic strength, and temperature).15 However, conventional hydrogels have deficiencies in adsorption and pressure-sensitive performance, which have limited their applications in fields such as environmental purification, sensors, and wearable electronics.16 Therefore, it has become a current research hotspot to improve the performance of hydrogels by introducing fillers with different properties to extend their application prospects.17
Lysine (Lys) is an essential amino acid with unique physiological functions and nutritional value. It also plays an important role in regulating nitrogen metabolism and participating in energy metabolism.18–23 In recent years, lysine has shown great potential in materials science due to its unique molecular structure. The amino and carboxyl groups in the lysine molecule can form hydrogen bonds with the polymer chains in the hydrogel matrix, thereby effectively regulating the hydrogel's internal network structure and physicochemical properties.24 In recent years, several studies have shown that introducing lysine into hydrogels can significantly improve their mechanical properties, increase swelling responsiveness, and confer better biocompatibility and environmental sensitivity.25 The addition of lysine can enhance the mechanical properties of hydrogels, increase the swelling responsiveness, and confer better biocompatibility and environmental sensitivity. The addition of lysine enhances hydrogels' compressive strength and modulus of elasticity, making them perform better in applications that require them to withstand external pressure or deformation.
Frontal polymerization (FP) is a simple and rapid mode of polymerization reaction, and its reaction mechanism is significantly different from that of conventional homogeneous and emulsion polymerization. FP triggers the polymerization reaction by utilizing external energy (e.g., heat or light) to form stable frontal fronts in the reactant.26 FP maintains the frontal fronts through its exothermic heat to sustain the reaction process, which is sustained.27–29 FP is an effective means of preparing high-performance polymer materials compared to traditional polymerization methods because of its fast reaction speed, high energy efficiency, and simple operation. FP not only efficiently prepares polymers in a short time but also completes the reaction at room temperature without external heating or cooling, which greatly saves energy and reduces environmental pollution.30–33 FP technology shows a wide range of application prospects in materials science and engineering. It has important applications in preparing high-performance composites, functional coatings, and smart response materials. These materials show great potential in aerospace, electronic devices, and biomedical fields and can meet the stringent requirements for material properties in these fields. The unique advantages of FP make it an important tool for modern materials science research and application and provide new ways and methods for developing and applying high-performance materials in the future.34
Deep eutectic solvents (DES) are composed of hydrogen bond acceptor (HBA) and hydrogen bond donor (HBD) through specific ratios, which have the advantages of low melting point, low cost, and good biocompatibility.35,36 Due to its unique physicochemical properties, DES has many applications in polymer science and engineering, metal processing, and nanomaterials.28,37 Compared with traditional solvents, DES is more environmentally friendly, and its composition and properties can be precisely regulated by selecting different HBDs and HBAs to meet the needs of specific applications.
In this paper, Lys/P(AM-U-ChCl) composite hydrogels were prepared by front-end polymerization (FP) by incorporating lysine (Lys) into a deep eutectic solvent (DES) prepared from urea (U), acrylamide (AM), and choline chloride (ChCl) at a molar ratio of 1![[thin space (1/6-em)]](https://www.rsc.org/images/entities/char_2009.gif) :1:1. The microstructures of the composite hydrogels were characterized by scanning electron microscopy (SEM) and Fourier transform infrared spectroscopy (FTIR) to further analyze the effect patterns of Lys content on the pH responsiveness, mechanical properties, pressure sensitivity, and Fe3+ adsorption of the composite hydrogels. Compared with previous research work,38 this paper not only focuses on applying Lys as an organic filler in hydrogels but also explores its unique contribution to improving composite hydrogels. This study not only provides new ideas for the functionalized design of composite hydrogels but also demonstrates its great potential for application in the fields of high-performance pressure sensors and heavy metal ion adsorption.
:1:1. The microstructures of the composite hydrogels were characterized by scanning electron microscopy (SEM) and Fourier transform infrared spectroscopy (FTIR) to further analyze the effect patterns of Lys content on the pH responsiveness, mechanical properties, pressure sensitivity, and Fe3+ adsorption of the composite hydrogels. Compared with previous research work,38 this paper not only focuses on applying Lys as an organic filler in hydrogels but also explores its unique contribution to improving composite hydrogels. This study not only provides new ideas for the functionalized design of composite hydrogels but also demonstrates its great potential for application in the fields of high-performance pressure sensors and heavy metal ion adsorption.
2. Materials and experiments
2.1 Materials
All the chemical reagents used in this study were analytically pure. Choline chloride (ChCl), acrylamide (AM), urea (U), and N,N-methylene bisacrylamide (MBA) were purchased from Shanghai Aladdin Biochemical Technology Co. Lysine (Lys) was purchased from Hefei Chisheng Biotechnology Co., Ltd and potassium persulfate (KPS) was purchased from Sinopharm Chemical Reagent Co. The experimental water was distilled water. Before use, choline chloride was dried in a vacuum oven at 70 °C for two hours to ensure the complete removal of its moisture, thus avoiding the influence of the preparation of deep eutectic solvent (DES) and the performance of hydrogel due to the presence of moisture during the experiment. All other reagents were also handled according to standard operating procedures before use to ensure the accuracy and reliability of the experiments.
2.2 Experimental instruments
The microscopic morphology of the composite hydrogels was observed by scanning electron microscopy (GeminiSEM 500, Germany). Fourier transform infrared (FTIR) spectra were scanned by a Fourier transform spectrometer (Nicolet 6700, USA). The composite hydrogels' tensile strength and tearing energy were tested on a tensile machine (Wance, China). Metal ion solution concentration was measured by a UV-visible spectrophotometer (Puxi TU-1900, Beijing, China). Capacitance was used to measure composite hydrogel capacitance by a digital bridge (Tonghui 2817B, China).
2.3 Preparation of DES
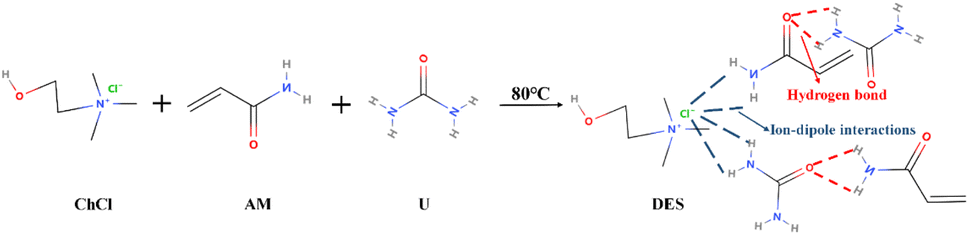
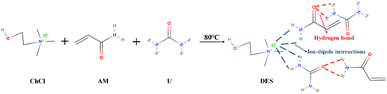
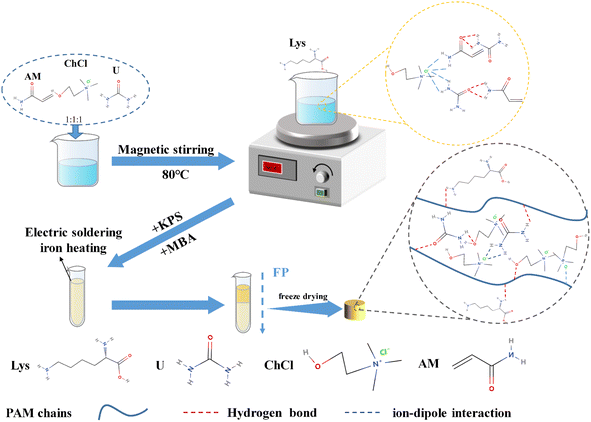
Take choline chloride (ChCl), urea (U), and acrylamide (AM) were accurately weighed in a 1:1:1 molar ratio and placed in a beaker. The beaker was heated on a magnetic stirrer set at 80 °C and stirred continuously until the mixture was completely dissolved to form a clear and clarified solution. Subsequently, different concentrations of lysine (Lys) were gradually added to the prepared DES solution according to the ratios in Table 1 of the experimental design. Stirring was continued until the lysine was fully dissolved and evenly distributed in the DES to ensure uniform dispersion. Fig. 1 illustrates the reaction process of DES formation and its chemical structure.
Table 1 Composition and ratios of hydrogel components
| Samples |
AM:U:ChCl (molar ratio) |
Lys (wt%) |
MBA (wt%) |
KPS (wt%) |
| FP0 |
1:1:1 |
0 |
0.5 |
0.5 |
| FP1 |
1:1:1 |
0.1 |
0.5 |
0.5 |
| FP2 |
1:1:1 |
0.3 |
0.5 |
0.5 |
| FP3 |
1:1:1 |
0.5 |
0.5 |
0.5 |
 |
| | Fig. 1 Formation of molecular formula of DES. | |
2.4 Preparation of Lys/P(AM-U-ChCl) composite hydrogels by frontal polymerization
To the prepared Lys/DES mixed solution, N,N-methylene bisacrylamide (MBA), a cross-linking agent, and potassium persulfate (KPS), an initiator, were added sequentially at a mass percentage of 0.5%. After thorough stirring and mixing, the solution was quickly transferred to a test tube with an inner diameter of 10 mm and a length of 100 mm and left to stand to ensure that all air bubbles completely escaped. Subsequently, a soldering iron was placed at the top of the liquid level of the test tube to initiate the front-end polymerization reaction under atmospheric pressure to form a polymerization front. The formed Lys/P(AM-U-ChCl) composite hydrogel was removed after the reaction. Fig. 2 shows the preparation process of Lys/P(AM-U-ChCl) composite hydrogel in detail.
 |
| | Fig. 2 Flow chart of Lys/P(AM-U-ChCl) composite hydrogel preparation. | |
2.5 Performance testing of Lys/P(AM-U-ChCl) composite hydrogels
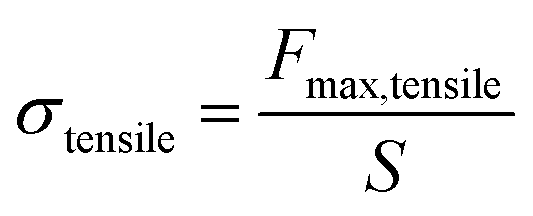
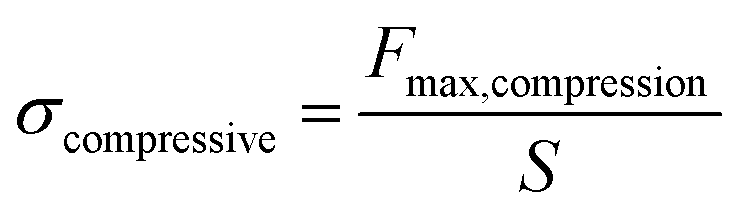
2.5.1 Mechanical performance test. The tensile and compressive properties of the composite hydrogels were tested using a tensile machine. The tensile test's speed was set at 100 mm min−1 until the hydrogel sample was fractured, and the maximum tensile stress and elongation were recorded. For the compression performance test, the samples were prepared as cylinders with a diameter of 10 mm and a height of 10 mm; the compression speed was set at 10 mm min−1, and the deformation amount was set at 80% until the maximum compressive stress was reached. To ensure the reliability of the experimental data, each test was repeated multiple times, and the average value was used for analysis.The tensile strength formula (1) is calculated as follows:
| |
 | (1) |
In
eqn (1),
Fmax,tensile is the maximum force applied when the fracture point is reached,
S is the initial cross-sectional area of the specimen.
The compressive strength formula (2) is calculated as follows:
| |
 | (2) |
In
eqn (2),
Fmax,compression is the maximum force measured at a specific compressive strain achieved, and
S is the initial cross-sectional area of the specimen.
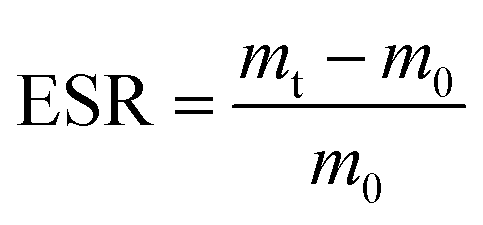
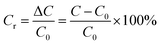
2.5.2 Hydrogel PH responsiveness performance testing. Sodium citrate and citric acid were used to prepare buffer solutions with pH values of 2.4 and 4.5, respectively, and sodium carbonate and sodium bicarbonate were used to prepare buffer solutions with pH values of 9.4 and 10.7, respectively. The pH of each buffer solution was accurately determined using a digital pen acidimeter (PH-208) with 0.01 accuracy. About 20 mg of dried hydrogel samples were weighed, placed in different pH buffer solutions, and soaked until water absorption reached equilibrium. Then, the excess water on the hydrogel surface was gently wiped off, and the sample mass was accurately weighed. Ultimately, the swelling equilibrium rate (ESR) of the dried hydrogels at swelling equilibrium was calculated using eqn (3):| |
 | (3) |
In eqn (3), mt is the swelling weight of hydrogel after water absorption at different pH, m0 is the initial weight of dry hydrogel.
2.5.3 Hydrogel pressure sensing tests. A disc-shaped hydrogel with a radius of 5 mm and a thickness of 2 mm was taken, and copper sheets were used as electrode sheets to make simple electrodes. Pressure was applied to the capacitor using different weights to record the change in capacitance of the composite hydrogel during the force. The relative change in capacitance was calculated according to eqn (4) to assess the hydrogel's pressure sensitivity under different pressure conditions.| |
 | (4) |
In eqn (4), C0 represents the original capacitance, C represents the capacitance value of the composite hydrogel after applying different pressures, ΔC represents the value of the change in capacitance of the composite hydrogel, and Cr is the relative change in capacitance.
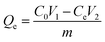
2.5.4 Hydrogel adsorption testing. The dried hydrogel samples were placed in Fe3+ solution with an initial concentration of 500 mg L−1 for adsorption kinetics experiments. The adsorption times were set at 20, 40, 60, 100, 120, and 160 min to obtain the adsorption data of Fe3+ by hydrogels at different time intervals. In order to investigate the adsorption isothermal characteristics of hydrogels on Fe3+, dried hydrogel samples were added to Fe3+ solutions with initial concentrations of 20, 40, 60, 80, 120, and 160 mg L−1, respectively, and adsorption isothermal experiments were carried out for 48 hours. After reaching the set adsorption time or adsorption equilibrium, the adsorbent in solution was removed by centrifugation at 6000 rpm for 20 min. Then, the concentration of Fe3+ in the treated supernatant was determined using a UV spectrophotometer to accurately assess the adsorption capacity of the hydrogel under different initial concentration conditions.The adsorption capacity Qe (mg g−1) was calculated by eqn (5) as follows:
| |
 | (5) |
In
eqn (5),
Qe (mg g
−1) is the equilibrium adsorption amount,
C0 (mg L
−1) is the initial concentration,
Ce (mg L
−1) is the equilibrium concentration,
m (g) is the mass of the dry hydrogel, and
V1 (L) and
V2 (L) are the volumes of the solution before and after adsorption.
2.6 Statistical analysis
Each experiment was repeated at least three times to ensure the reliability and accuracy of the data. The experimental results were expressed as the mean and standard deviation (SD), reflecting the centralized trend and the degree of dispersion of the data. Data were analyzed using SPSS 20.0 software for statistical processing, through which the experimental data were statistically analyzed in detail to verify the significance and consistency of the experimental results.
3. Results and discussion
3.1 Fourier transform infrared spectra of Lys/P(AM-U-ChCl) hydrogels
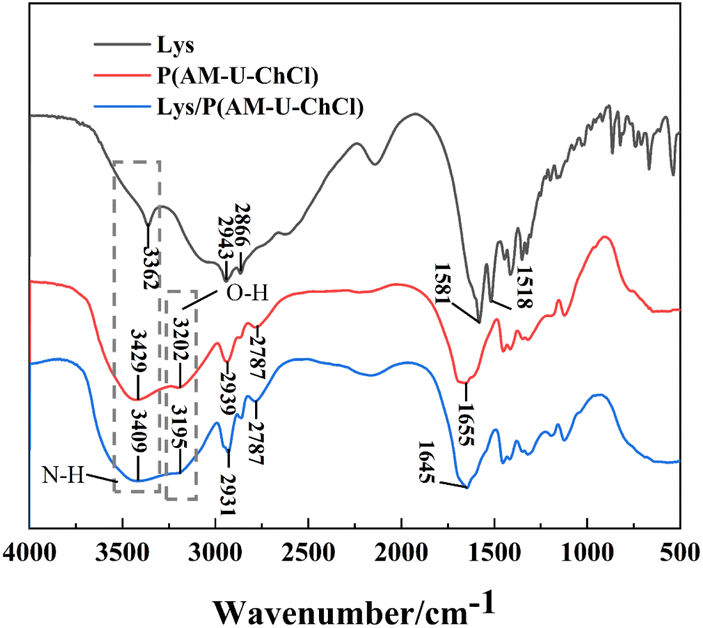
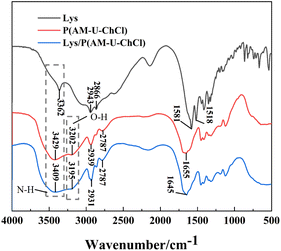
The chemical structures of lysine (Lys), P(AM-U-ChCl) hydrogel, and Lys/P(AM-U-ChCl) composite hydrogel were analyzed in detail using Fourier transform infrared spectroscopy (FTIR), as shown in Fig. 3. In the IR spectrum of Lys, the broad absorption peak at 3362 cm−1 was attributed to the stretching vibration of the N–H group in Lys, whereas the absorption peaks at 2943 cm−1 and 2866 cm−1 corresponded to the stretching vibration of the CH2 and CH3 groups, respectively. The absorption peaks at 1581 cm−1 and 1518 cm−1 are associated with the stretching vibration of C![[double bond, length as m-dash]](https://www.rsc.org/images/entities/char_e001.gif) O and the bending vibration of N–H, respectively.39 For P(AM-U-ChCl) hydrogels, their FTIR spectra absorption peaks at 3429 cm−1 and 3202 cm−1 indicate N–H and O–H stretching vibrations, respectively. The absorption peaks at 2939 cm−1 and 2787 cm−1 are attributed to the C–H symmetric and asymmetric stretching vibrations, mainly from the alkyl chains (CH2 and CH3) in AM and ChCl.40 The absorption peak at 1655 cm−1 is associated with the stretching vibration of CO (amide I) in AM and U.41 In the FTIR spectra of Lys/P(AM-U-ChCl) hydrogel, the addition of Lys resulted in a shift of the absorption peak at 3429 cm−1 to 3405 cm−1 as compared to that of P(AM-U-ChCl) hydrogel. It also enhanced the absorption peak of amide I, which may be due to the formation of hydrogen bonding between the CO of acrylamide and the –NH2 of Lys.42 In addition, the addition of Lys also led to an enhancement of the CH2 absorption peak at 2939 cm−1, further confirming its effect on the hydrogel structure.43
O and the bending vibration of N–H, respectively.39 For P(AM-U-ChCl) hydrogels, their FTIR spectra absorption peaks at 3429 cm−1 and 3202 cm−1 indicate N–H and O–H stretching vibrations, respectively. The absorption peaks at 2939 cm−1 and 2787 cm−1 are attributed to the C–H symmetric and asymmetric stretching vibrations, mainly from the alkyl chains (CH2 and CH3) in AM and ChCl.40 The absorption peak at 1655 cm−1 is associated with the stretching vibration of CO (amide I) in AM and U.41 In the FTIR spectra of Lys/P(AM-U-ChCl) hydrogel, the addition of Lys resulted in a shift of the absorption peak at 3429 cm−1 to 3405 cm−1 as compared to that of P(AM-U-ChCl) hydrogel. It also enhanced the absorption peak of amide I, which may be due to the formation of hydrogen bonding between the CO of acrylamide and the –NH2 of Lys.42 In addition, the addition of Lys also led to an enhancement of the CH2 absorption peak at 2939 cm−1, further confirming its effect on the hydrogel structure.43
 |
| | Fig. 3 FTIR plots of Lys, FTIR plots of P(AM-U-ChCl) and Lys/P(AM-U-ChCl) hydrogels. | |
3.2 Microscopic morphology of Lys/P(AM-U-ChCl) hydrogels
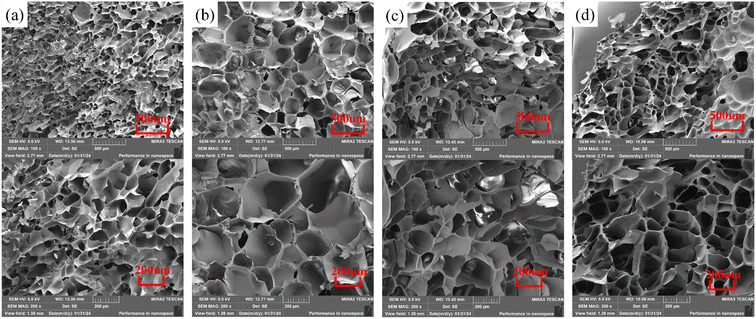
The micro-morphology of hydrogels with different lysine (Lys) contents was observed using scanning electron microscopy (SEM), and the results are shown in Fig. 4. During the freeze-drying process, the ice crystals filling the pores of the hydrogels sublimated and formed a uniform porous structure. Fig. 4(a) shows that the pore size of FP0 hydrogel is about 50–100 μm, and the pores are relatively small and uniformly distributed. With the increase of Lys content, the microstructure of the hydrogel changed significantly. It can be observed in Fig. 4(b) that some of the pore diameters of FP3 hydrogels increased to 100–200 μm, and the pore structure was more open. The connections between the pore walls were reduced, the pore walls became thicker, and the roughness of the surface increased. This change was mainly attributed to the introduction of Lys, whose hydrophilicity of the side chains attracted more water molecules into the hydrogel network, leading to localized swelling. In addition, hydrogen bonds were formed between the amino group in the Lys molecule and the acrylamide, and this interaction modulated the tightness and stability of the internal network of the hydrogel, which significantly affected the size and shape of the pores.44,45
 |
| | Fig. 4 SEM images of lyophilized FP0 (a), FP1 (b), FP2 (c), and FP3 (d) hydrogels. | |
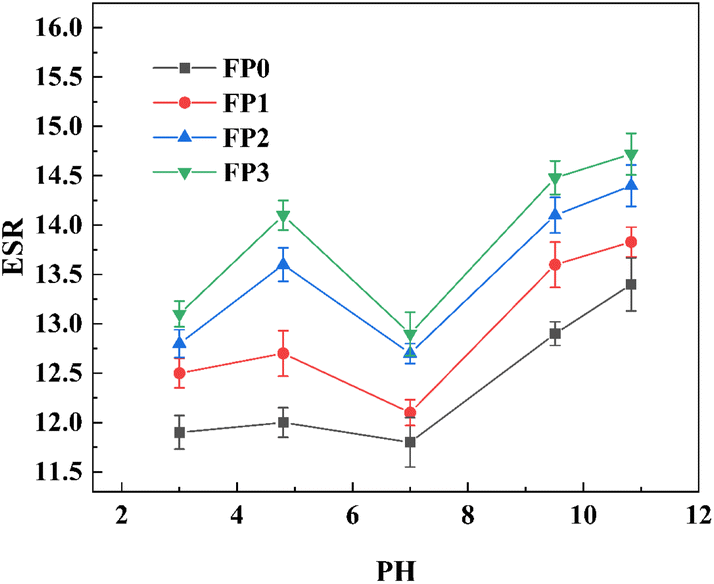
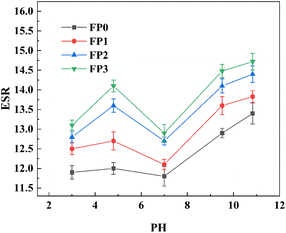
3.3 pH responsiveness of Lys/P(AM-U-ChCl) hydrogels
Fig. 5 demonstrates the equilibrium rate of swelling (ESR) of hydrogels with different contents of lysine (Lys) at different pH values (3, 4.8, 7.0, 9.4, 10.7). As shown in Fig. 5, the trend of swelling of hydrogels in different pH solutions is the same. The swelling rate of P(AM-U-ChCl) hydrogel without Lys addition was stabilized at about 12 at pH < 7. This is because the –CONH2 group in the hydrogel was not ionized under acidic conditions, resulting in the polymer network being contracted. While at pH > 7, some of the –CONH2 in the hydrogel is gradually ionized to –COO−, and the electrostatic repulsion leads to the mutual repulsion between –COO−, which in turn leads to a gradual increase in the swelling rate of P(AM-U-ChCl) hydrogel.46,47
 |
| | Fig. 5 pH responsiveness curve of Lys/P(AM-U-ChCl) composite hydrogel. | |
At pH = 3, most of the carboxylic acid groups on Lys exist as –COO– and a few as –COOH due to the pKa = 2.16 of Lys. These carboxylic acid groups are involved in hydrogen bonding interactions, causing the polymer chains within the composite hydrogel to entangle and contract with each other, resulting in a relatively low equilibrium swelling rate (ESR) of the composite hydrogel at pH = 3.48 As the pH was increased to 4.8, the –COOH group of Lys in the composite hydrogel was further dissociated into –COO–, and the hydrogen bonding between the polymer chains was weakened, while the electrostatic repulsion between the –COO– was enhanced, resulting in the expansion of the distances of the polymer network, which led to an increase in the ESR of the composite hydrogel.49 When the pH was further increased to 7, the amino group of the Lys (–NH3+) side chain began to be protonated, reducing the charge mutual repulsion in the hydrogel network. In addition, the side-chain amino group (–NH3+) strongly attracts water molecules through ion–dipole interactions. After deprotonation, the ion–dipole interactions are weakened, which leads to a decrease in the swelling properties of the Lys/P(AM-U-ChCl) hydrogel.50 When the pH is greater than 7, –COOH in the Lys/P(AM-U-ChCl) hydrogel undergoes ionization and changes into –COO–, the electrostatic repulsion between the polymers leads to further expansion of the polymer network, which increases the osmotic pressure inside the hydrogel increased, thus increasing the ESR.51 As shown in Fig. 5, the ESR of the hydrogels gradually increased with the increase of Lys content under the same pH conditions. This phenomenon is attributed to the water-absorbing property of Lys and its inclusion of functional groups such as amino and carboxyl groups, which can effectively promote the interaction with water molecules, increase the hydrophilicity of the hydrogel surface, and enhance the adsorption of water molecules inside it. In addition, the addition of Lys could also regulate the pore structure of the hydrogel and increase the number and size of pores (as shown in Fig. 4), which further facilitated the entry of water molecules into the interior, thus improving the water absorption performance.52,53
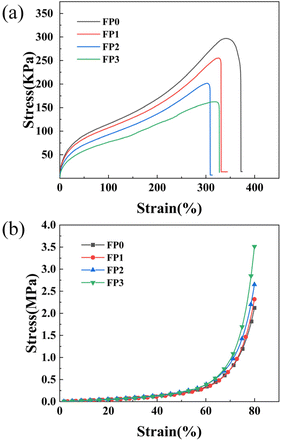
3.4 Mechanical properties of Lys/P(AM-U-ChCl) hydrogels
Hydrogel samples with different lysine (Lys) contents were tested for tensile and compressive properties to evaluate their mechanical properties. Fig. 6 demonstrates the tensile and compressive strengths of different hydrogel samples. The tensile strength of FP0 hydrogel without added Lys was about 330.2 kPa. The tensile strength gradually decreased with the increase of Lys content. The tensile strengths of FP1, FP2, and FP3 samples were 287.1 kPa, 246.6 kPa, and 202.6 kPa, respectively, which could be attributed to the interaction of amino (–NH2) and carboxylic acid (–COOH) groups on the side chain of Lys with the –CONH– in the hydrogel to form hydrogen bonds, which disrupts the original polymer network structure and thus reduces the tensile strength of the hydrogel.38,42 Fig. 6(b) demonstrates the compressive stress–strain curves of hydrogels with different Lys contents. The compressive property tests showed that the hydrogel samples with different Lys contents significantly differed in compressive strength. The maximum compressive strength of FP0 hydrogel was 2.12 MPa, whereas the compressive strength of FP3 hydrogel containing more Lys reached 3.51 MPa, which was 1.65 times higher than that of FP0. This indicates that adding Lys significantly enhanced the compressive properties of the hydrogels. This phenomenon may be because there is positively charged Lys in the hydrogel to improve the pore structure of the hydrogel through electrostatic repulsion, which is more conducive to the dispersion of pressure and reduces the possibility of localized stress concentration. In addition, the formation of hydrogen bonding interactions between the amino (–NH2) and carboxyl (–COOH) groups on the side chains of Lys and (–CONH–) in the hydrogel enhanced the stability of the hydrogel pore structure. These hydrogen bonds provide additional structural support, allowing the hydrogel to maintain its structural integrity and functionality under large deformations, thereby improving the compressive properties of the hydrogel.54,55
 |
| | Fig. 6 (a) Hydrogel tensile performance test curve; (b) hydrogel compression performance test curve. | |
3.5 Pressure-sensitive properties of Lys/P(AM-U-ChCl) hydrogels
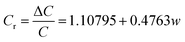
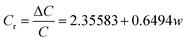
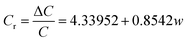
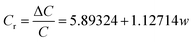
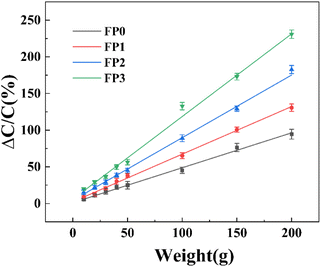
In order to evaluate the pressure-sensitive performance of Lys/P(AM-U-ChCl) hydrogels, we tested the capacitance change of hydrogel pressure sensors at different pressures, and the results are shown in Fig. 7. From the figure, it can be seen that the relative change in capacitance of the sensor increases as the applied pressure increases. This is due to the fact that under pressure, the composite hydrogel deforms, causing the distance between the two electrodes to decrease, leading to an increase in the electric field strength at a given potential. The increase in electric field strength triggers the interfacial polarization of the capacitance, which increases the dielectric constant of the composite hydrogel as a dielectric layer, leading to an increase in capacitance.56 The relationship between capacitance and pressure for FP0–FP3 hydrogels was obtained by linearly fitting the relative change curves of capacitance of FP0–FP3 hydrogels at different pressures by using the Origin software as shown in eqn (6)–(9):| |
 | (6) |
| |
 | (7) |
| |
 | (8) |
| |
 | (9) |
In eqn (6)–(9), Cr is the relative change in capacitance and w is the applied pressure.
 |
| | Fig. 7 Relative change in capacitance of Lys/P (AM-U-ChCl) hydrogel pressure sensor at different pressures. | |
When the lysine content in the hydrogel is constant, the relative change in capacitance (ΔC/C) is related to the applied pressure w as shown in eqn (10):
| |
 | (10) |
In
eqn (10),
Cr is the relative change in capacitance and
w is the applied pressure.
Since the capacitance changes relatively as Cr= (L, w), the intercept a and slope b in eqn (6)–(9) are fitted by Origin to obtain the relationship between a, b and Lys content (L):
| | |
a = 1.28689 + 951.45454L
| (11) |
| | |
b = 0.49351 + 125.88797L
| (12) |
Substituting eqn (11) and (12) into eqn (10) gives the relationship between Cr and L and w:
| |
 | (13) |
The relative change in capacitance of hydrogels at different pressures can be modeled and compared using eqn (13). The relative change in capacitance of the composite hydrogel increases gradually with the increase of Lys content when the applied pressure is all 200 g. The relative change in capacitance of the composite hydrogel is 230.8% with the increase of Lys content. Among them, the relative change in capacitance of FP3 hydrogel is 230.8%. In comparison, the relative change in capacitance of FP0 hydrogel is only 94.5%, and this result shows that the pressure sensitivity of FP3 hydrogel is significantly better than that of FP0 hydrogel. This is because Lys, as a positively charged molecule, can increase the effective charge concentration of the electric double layer when added to the hydrogel. When the hydrogel is subjected to external pressure, the position and distribution of the Lys molecules change, affecting the structure and charge distribution of the electric double layer, which leads to changes in capacitance.57,58 Table 2 shows the experimental values of the relative changes in capacitance compared with the calculated values for a certain Lys content and pressure. The experimental and calculated values of the relative change in capacitance of the composite hydrogel are almost the same when the Lys content is 0.5 wt%, and the applied pressure is 200 g. The experimental and calculated values of the relative change in capacitance of the composite hydrogel are shown in Table 2.
Table 2 Comparison between experimental (Cr) and calculated (Cr0) values of capacitance change rate
| Lys (wt%) |
Weight (g) |
Cr (%) |
Cr0 (%) |
Cr/Cr0 (%) |
| 0 |
150 |
76.3 |
75.8 |
100.64 |
| 0.1 |
50 |
20.7 |
21.9 |
97.67 |
| 0.3 |
100 |
89.1 |
91.9 |
96.85 |
| 0.5 |
200 |
230.8 |
232.8 |
99.10 |
In order to further verify the applicability of hydrogels with different Lys contents to the above eqn (13), we also tested hydrogels with Lys contents of 0.2 wt% and 0.4 wt%, respectively, and plotted the relative change in capacitance versus applied pressure as shown in Fig. 8. The results show that the relative change in capacitance of the hydrogel increases with the increase of applied pressure and Lys content. The relative change in capacitance of the hydrogel with Lys content of 0.2 wt% at an applied pressure of 150 g is 117.2%, while the relative change in capacitance calculated according to eqn (13) is 115.9%. There is only a difference of 1.3% between the experimental value of the relative change in capacitance and the calculated value (Table 3).
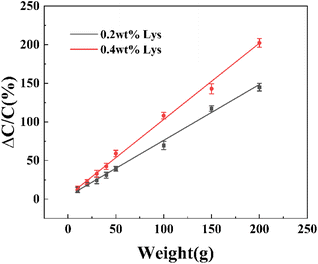 |
| | Fig. 8 Relative change in capacitance of Lys/P(AM-U-ChCl) hydrogel pressure sensors with Lys content of 0.2 wt% and 0.4 wt% at different pressures. | |
Table 3 Capacitance change rate of Lys hydrogels with 0.2 wt% and 0.4 wt% Lys content, respectively comparison of experimental value (Cr) and calculated value (Cr0)
| Lys (wt%) |
Weight (g) |
Cr (%) |
Cr0 (%) |
Cr/Cr0 (%) |
| 0.2 |
150 |
117.2 |
115.9 |
101.10 |
| 0.4 |
200 |
202.2 |
206.4 |
97.96 |
3.6 Adsorption properties of Lys/P(AM-U-ChCl) hydrogels
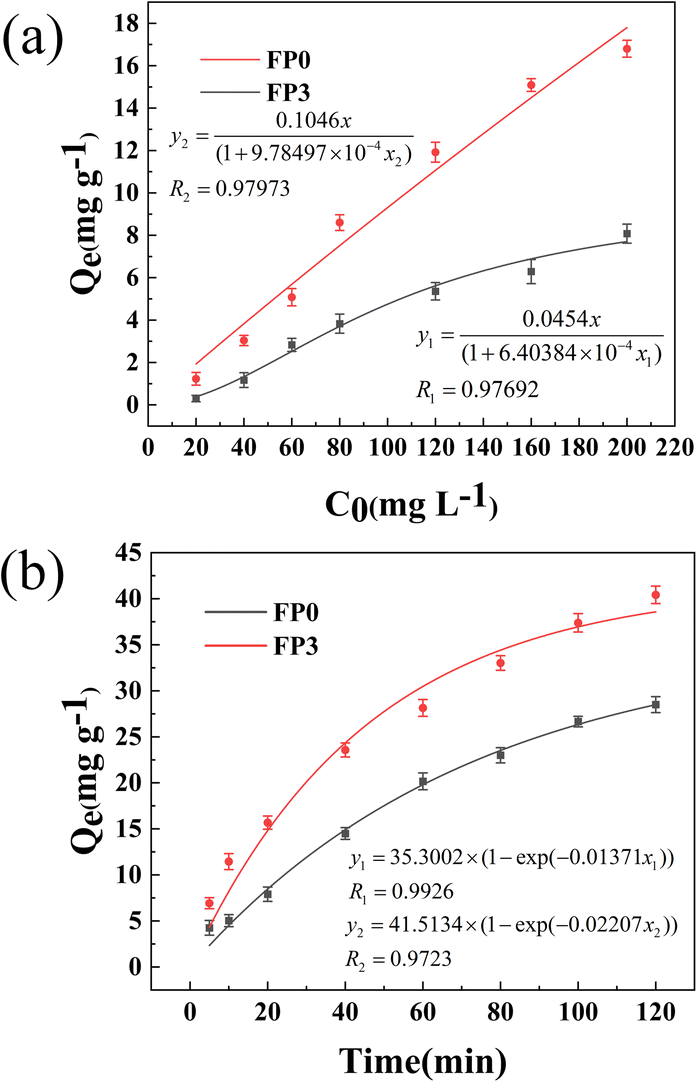
The adsorption isotherms of Fe3+ by hydrogel samples FP0 and FP3 are shown in Fig. 9(a). The equilibrium adsorption capacities of FP0 and FP3 hydrogels increased from the initial 0.3 mg g−1 and 1.3 mg g−1 to 8.1 mg g−1 and 16.8 mg g−1, respectively, with the increase of the initial concentration of Fe3+ from 20 mg L−1 to 200 mg L−1. Remarkably, the equilibrium adsorption capacity of FP3 hydrogels was always higher than the equilibrium adsorption capacity of FP0, which proved that adding Lys to P(AM-U-ChCl) hydrogels could significantly increase their adsorption capacity. This phenomenon was attributed to the porous structure in the Lys/P(AM-U-ChCl) hydrogels and to carboxyl groups and amino groups on the Lys, which provided Fe3+ adsorption with favorable conditions.59,60 The equilibrium adsorption capacities of FP0 and FP3 were fitted using the Langmuir adsorption isothermal model. The results showed that the Langmuir model's correlation coefficients for both samples were above 0.97, which indicated that the model had a good fit with the experimental data. Fig. 9(b) demonstrates the curves of the adsorption capacity of the hydrogel on Fe3+ with time before and after the addition of Lys. During the first 80 min of the adsorption process, the adsorption capacity of Fe3+ by both the hydrogel without Lys addition (FP0) and the hydrogel with Lys addition (FP3) increased significantly. They reached about 80% of their maximum adsorption capacity respectively. It can be observed from the curves that the adsorption capacity of FP3 was always higher than that of FP0 at the same time. This phenomenon was mainly attributed to introducing carboxyl and amide groups by Lys into the P(AM-U-ChCl) hydrogels, which provided more adsorption sites for Fe3+ adsorption.61 In addition, a pseudo-first-order kinetic model was used to fit the experimental data of FP0 and FP3. The results showed that the fitted correlation coefficients (R2) were more than 0.97, which indicated that the pseudo-first-order kinetic model could better describe the kinetic process of the adsorption of Fe3+ on the hydrogel and that the model was highly conforming to the experimental data.
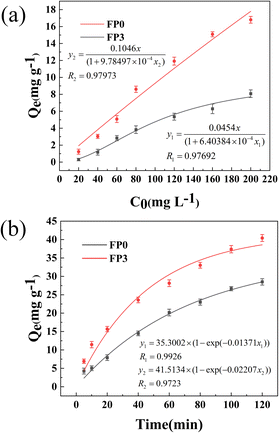 |
| | Fig. 9 (a) Langmuir adsorption profiles of Fe3+ by FP0 and FP3 hydrogels; (b) pseudo-primary adsorption profiles of Fe3+ by FP0 and FP3 hydrogels. | |
4. Conclusions
This study successfully prepared P(AM-U-ChCl) composite hydrogels containing lysine (Lys). The maximum compressive strength of the hydrogels increased significantly with the increase of Lys content, and the maximum compressive strength of hydrogels with Lys content of 0.5 wt% reached 3.5 MPa, which was 1.65 times higher than that of hydrogels without added Lys. The Lys/P(AM-U-ChCl) hydrogels showed good pressure-sensitive performance, and the relative change in capacitance when the applied pressure was 200 g amounted to 121.5%. The equilibrium adsorption capacity of Lys/P(AM-U-ChCl) hydrogel for Fe3+ increased with the increase of Fe3+ concentration from 20 mg L−1 to 200 mg L−1. When the Fe3+ concentration was 200 mg L−1, the equilibrium adsorption capacity reached 16.8 mg g−1, which was It was significantly higher than the adsorption capacity of the hydrogel without added Lys. The introduction of Lys significantly improved the hydrogels' mechanical properties, pressure sensitivity, and adsorption performance, which provides new possibilities and theoretical support for their application in environmental purification and sensors.
Data availability
The datasets used in this study are available from the corresponding authors upon reasonable request. All data have been described in detail in this paper and will be made available to researchers with legitimate research purposes, subject to ethical and legal requirements. Use of the data is subject to relevant privacy protection and data sharing agreements.
Author contributions
Y. J. J. and A. L. W. proposed the ideas, steps and details of the experiment, most of the experiments were done by Y. J. J., A. L. W., L. Y., J. W., Y. L., where Y. J. J. and A. L. W. were instrumental in the proper conduct of the experiments and wrote the article together with A. L. W., Y. L., J. W. and all the authors analyzed the data, discussed the conclusions.
Conflicts of interest
The authors declare that there are no competing interests regarding the publication of this article.
Notes and references
- H. Gai, J. Wu, C. Wu, X. Sun, F. Jia and Y. Yu, J. Mater. Res., 2015, 30, 2400–2407 CrossRef CAS.
- K. Chen, T. Zong, Q. Chen, S. Liu, L. Xu and D. Zhang, Soft Mater., 2021, 20, 99–108 CrossRef.
- L. Li, J. Zhao, Y. Sun, F. Yu and J. Ma, Chem. Eng. J., 2019, 372, 1091–1103 CrossRef CAS.
- S. Merino, C. Martín, K. Kostarelos, M. Prato and E. Vázquez, ACS Nano, 2015, 9, 4686–4697 CrossRef CAS.
- S. Fang, G. Wang, P. Li, R. Xing, S. Liu, Y. Qin, H. Yu, X. Chen and K. Li, Int. J. Biol. Macromol., 2018, 115, 754–761 CrossRef CAS.
- I. Selmer, C. Kleemann, U. Kulozik, S. Heinrich and I. Smirnova, J. Supercrit. Fluids, 2015, 106, 42–49 CrossRef CAS.
- X. Zhu, Z. Wang, J. Ren, N. AlMasoud, Z. M. El-Bahy, T. S. Alomar, C. Zhang, J. Zhang, J. Zhou, M. Li, D. Wang, I. Seok and X. Guo, Adv. Compos. Hybrid Mater., 2023, 6, 169 CrossRef CAS.
- X. Zhang, S. Luo, J. Duan, T. Lan and Y. Wei, Environ. Sci. Pollut. Res., 2023, 30, 108230–108246 CrossRef CAS.
- M. Wu, Z. Shi, H. Huang, J. Qu, X. Dai, X. Tian, W. Wei, G. Li and T. Ma, Carbohydr. Polym., 2017, 176, 65–74 CrossRef CAS.
- Z. Yang, L. Chen, D. J. McClements, C. Qiu, C. Li, Z. Zhang, M. Miao, Y. Tian, K. Zhu and Z. Jin, Food Hydrocolloids, 2022, 124, 107218 CrossRef CAS.
- D. Das and S. Pal, RSC Adv., 2015, 5, 25014–25050 RSC.
- S. M. F. Kabir, P. P. Sikdar, B. Haque, M. A. R. Bhuiyan, A. Ali and M. N. Islam, Prog. Biomater., 2018, 7, 153–174 CrossRef CAS PubMed.
- P. N. Dave and A. Gor, in Handbook of Nanomaterials for Industrial Applications, 2018, pp. 36–66 Search PubMed.
- S. Bashir, M. Hina, J. Iqbal, A. H. Rajpar, M. A. Mujtaba, N. A. Alghamdi, S. Wageh, K. Ramesh and S. Ramesh, Polymers, 2020, 12, 2702 CrossRef CAS.
- X. Zhang, C. Li, Y. Hu, R. Liu, L. He and S. Fang, Polym. Int., 2014, 63, 2030–2041 CrossRef CAS.
- C. Li, X. Zhou, D. Zhou, F. Chen, J. Shen, H. Li, J. Zhang and X. Zhou, ACS Appl. Polym. Mater., 2019, 1, 3222–3226 CrossRef CAS.
- Y. Wang, T. Lv, K. Yin, N. Feng, X. Sun, J. Zhou and H. Li, Small, 2023, 19, e2207048 CrossRef PubMed.
- J. Yu, J. Fan, Y. Song, Y. Zhao, Z. Lin, L. Jiang and H. Li, Spectrochim. Acta, Part A, 2024, 308, 123734 CrossRef CAS PubMed.
- X. Zhou, W. Cao, Y. Chen, Z. Zhu, Y. Chen, Y. Ni, Z. Liu, F. Jia, Z. Lu, Y. Ye, H. Han, K. Yao, W. Liu, X. Wei, S. Chen, Y. Wang, J. Ji and P. Zhang, Adv. Sci., 2024, 11, e2308077 CrossRef.
- M. Liu, C. Li, H. Tang, M. Gong, Z. Yue, M. Zhao, L. Liu and F. Li, J. Anim. Physiol. Anim. Nutr., 2021, 106, 1118–1129 CrossRef.
- Y. Wang, F. Wang, X. Bao and L. Fu, J. Proteomics, 2019, 205, 103419 CrossRef CAS.
- N. Roy, H. Lapierre and J. F. Bernier, Can. J. Anim. Sci., 2000, 80, 585–595 CrossRef CAS.
- N. W. Shelton, M. D. Tokach, S. S. Dritz, R. D. Goodband, J. L. Nelssen and J. M. DeRouchey, J. Anim. Sci., 2011, 89, 3587–3595 CrossRef CAS PubMed.
- Z. Meng, Y. He, F. Wang, R. Hang, X. Zhang, X. Huang and X. Yao, ACS Appl. Bio Mater., 2021, 4, 2713–2722 CrossRef CAS.
- K. A. Watkins and R. Chen, Int. J. Pharm., 2015, 478, 496–503 CrossRef CAS PubMed.
- S. Li, H. Zhang, J. Feng, R. Xu and X. Liu, Desalination, 2011, 280, 95–102 CrossRef CAS.
- Q. Feng, X. Chen, Y.-q. Zhao, S.-s. Hu, Z.-w. Xia and Q.-Z. Yan, Colloid Polym. Sci., 2017, 295, 883–890 CrossRef CAS.
- Y. Chen, S. Li and S. Yan, Carbohydr. Polym., 2021, 263, 117996 CrossRef CAS PubMed.
- M. Rassu, V. Alzari, D. Nuvoli, L. Nuvoli, D. Sanna, V. Sanna, G. Malucelli and A. Mariani, J. Polym. Sci., Part A: Polym. Chem., 2017, 55, 1268–1274 CrossRef CAS.
- J. Pojman, J. Willis, D. Fortenberry, V. Ilyashenko and A. Khan, J. Polym. Sci., Part A: Polym. Chem., 1995, 33, 643–652 CrossRef CAS.
- K. F. Fazende, M. Phachansitthi, J. D. Mota-Morales and J. A. Pojman, J. Polym. Sci., Part A: Polym. Chem., 2017, 55, 4046–4050 CrossRef CAS.
- J. D. Mota-Morales, M. C. Gutiérrez, I. C. Sanchez, G. Luna-Bárcenas and F. del Monte, Chem. Commun., 2011, 47, 5328–5330 RSC.
- D. Sanna, V. Alzari, D. Nuvoli, L. Nuvoli, M. Rassu, V. Sanna and A. Mariani, Carbohydr. Polym., 2017, 166, 249–255 CrossRef CAS PubMed.
- Q. Li, H.-X. Shen, C. Liu, C.-F. Wang, L. Zhu and S. Chen, Prog. Polym. Sci., 2022, 127, 101514 CrossRef CAS.
- J. A. Pojman, G. Curtis and V. M. Ilyashenko, J. Am. Chem. Soc., 1996, 118, 3783–3784 CrossRef CAS.
- E. L. Smith, A. P. Abbott and K. S. Ryder, Chem. Rev., 2014, 114, 11060–11082 CrossRef CAS.
- X. Cao, M. Liu, W. Bi, J. Lin and D. D. Y. Chen, Carbohydr. Polym. Technol. Appl., 2022, 4, 100222 CAS.
- B. Li, A. Wu, W. Hao, J. Liu, Z. Hu and Y. Wang, RSC Adv., 2023, 13, 11530–11536 RSC.
- M. Rozenberg and G. Shoham, Biophys. Chem., 2007, 125, 166–171 CrossRef CAS.
- L.-Y. Wang and M.-J. Wang, ACS Sustain. Chem. Eng., 2016, 4, 2830–2837 CrossRef CAS.
- S. Hong, Y. Yuan, C. Liu, W. Chen, L. Chen, H. Lian and H. Liimatainen, J. Mater. Chem. C, 2020, 8, 550–560 RSC.
- J. Lin, Y. Wang, D. Pan, Y. Sun, C. Ou and J. Cao, Int. J. Biol. Macromol., 2018, 108, 947–952 CrossRef CAS PubMed.
- H. Wang, B. Shi, H. Yu, S. Yang, G. Nie, S. Wang and W. Chen, Mater. Today Adv., 2023, 20, 100429 CrossRef CAS.
- M. J. Zohuriaan-Mehr, A. Pourjavadi, H. Salimi and M. Kurdtabar, Polym. Adv. Technol., 2009, 20, 655–671 CrossRef CAS.
- R. Zhang, Q. Fu, K. Zhou, Y. Yao and X. Zhu, Polymer, 2020, 199, 122603 CrossRef CAS.
- B. Singh, G. S. Chauhan, S. Kumar and N. Chauhan, Carbohydr. Polym., 2007, 67, 190–200 CrossRef CAS.
- B. Li, J. Liu, D. Fu, Y. Li, X. Xu and M. Cheng, RSC Adv., 2021, 11, 35268–35273 RSC.
- B. Li, W. Hao, A. Wu, M. Zhou, Q. Yan, H. Zhang and L. Su, RSC Adv., 2023, 13, 22831–22837 RSC.
- M. C. Mohd Amin, N. Ahmad, M. Pandey and C. Jue Xin, Drug Dev. Ind. Pharm., 2014, 40, 1340–1349 CrossRef CAS PubMed.
- K. Berka, R. Laskowski, K. E. Riley, P. Hobza and J. Vondrasek, J. Chem. Theory Comput., 2009, 5, 982–992 CrossRef CAS PubMed.
- G. T. Chao, Z. Y. Qian, M. J. Huang, B. Kan, Y. C. Gu, C. Y. Gong, J. L. Yang, K. Wang, M. Dai, X. Y. Li, M. L. Gou, M. J. Tu and Y. Q. Wei, J. Biomed. Mater. Res., Part A, 2008, 85, 36–46 CrossRef PubMed.
- S. An, S. Ahn, A. Letona, J. H. Shin, S. H. Kang, J. Y. Jeong, S. M. Park, J. W. Kim, D. Yu, H. Chung and D. Chung, Food Biosci., 2023, 53, 102845 CrossRef CAS.
- X. Yang, C. Wang, Y. Liu, H. Niu, W. Zhao, J. Wang and K. Dai, ACS Appl. Mater. Interfaces, 2021, 13, 36709–36721 CrossRef CAS PubMed.
- L.-X. Su, J. Chen, J. Liu, Y.-H. Shao and Z.-C. Tu, Food Hydrocolloids, 2023, 145, 109114 CrossRef CAS.
- B. M. de Souza, M. P. Dos Santos Cabrera, J. R. Neto and M. S. Palma, Amino Acids, 2011, 40, 77–90 CrossRef.
- X. Yang, Y. Wang and X. Qing, Sens. Actuators, A, 2019, 299, 111579 CrossRef CAS.
- Y. Liu, C. He, J. Fang, J. Zhou, K. Shang, X. Pu, L. Qian and T. Yang, Mater. Today Phys., 2024, 41, 101331 CrossRef CAS.
- S. He, Z. Liu, X. Wu, J. Liu, H. Fang and W. Shao, Carbohydr. Polym., 2024, 324, 121515 CrossRef CAS.
- Q. Luo, X. Huang, Y. Luo, H. Yuan, T. Ren, X. Li, D. Xu, X. Guo and Y. Wu, Chem. Eng. J., 2021, 407, 127050 CrossRef CAS.
- Y. Xiong, C. Wang, H. Wang, Q. Yao, B. Fan, Y. Chen, Q. Sun, C. Jin and X. Xu, J. Mater. Chem. A, 2017, 5, 5813–5819 RSC.
- X. Guo, D. Xu, H. Yuan, Q. Luo, S. Tang, L. Liu and Y. Wu, J. Mater. Chem. A, 2019, 7, 27081–27088 RSC.
Footnote |
| † Yajun Jiang and Aolin Wu are co-first authors. |
|
| This journal is © The Royal Society of Chemistry 2024 |
Click here to see how this site uses Cookies. View our privacy policy here. 
 Open Access Article
 This Open Access Article is licensed under a Creative Commons Attribution-Non Commercial 3.0 Unported Licence