DOI:
10.1039/D4RA04309J
(Paper)
RSC Adv., 2024,
14, 22867-22876
Electrochemical and optical protocols for the detection and removal of an antibiotic drug rifaximin from wastewater
Received
12th June 2024
, Accepted 15th July 2024
First published on 19th July 2024
Abstract
Improper disposal of pharmaceutical drugs is increasing the pollution level of water reservoirs which in turn adversely impacts the ecosystem. The current study presents an electrochemical scaffold that comprises a glassy carbon electrode modified with amino-functionalized multiwalled carbon nanotubes (NH2-fMWCNTs) for the detection of a pharmaceutical drug rifaximin in wastewater. Electrochemical impedance spectroscopic characterization revealed efficient charge transport through the modified electrode surface. Square wave voltammetry was employed for probing the electro-oxidation of antibiotic rifaximin. Under optimized experimental conditions, the designed sensor demonstrated the qualities of sensitivity, repeatability, and reproducibility as required for the practical applicability of the sensing device. After the detection of a contaminant, its removal from water is imperative. In this regard an adsorption method using ZnO nanoparticles as adsorbents was developed that led to the removal of rifaximin from wastewater. At lower adsorbate concentration, adsorption was found to occur according to the Langmuir model while at higher concentration adsorption data followed the Freundlich model. The rate of rifaximin adsorption over ZnO nanoparticles followed pseudo-second-order kinetics.
1. Introduction
Pharmaceuticals have prolonged the life span of mankind and enhanced the quality of life by improving public health and well-being.1 However, careless discharge of pharmaceutical effluents from industries and hospitals contaminates water resources. The current pandemic has enormously increased the usage and release of pharmaceuticals in water bodies.2,3 Such water contaminants cause adverse effects even if present in ng L−1.4 Some drugs such as antibiotics are extensively used. As a result, they are the dominant contaminants of effluents released from pharmaceutical industries, especially in countries where drug disposal regulations are not strictly followed. Misuse of antibiotics along with the resulting development of antimicrobial resistance is considered the top 10 threat to global health that modern society faces nowadays.5 Pharmaceutical compounds show different solubility and stability in water. Some drugs and their metabolites are extremely persistent and remain in aquatic environments for a long time.6 Therefore, it is imperative for the trace-level detection of such drugs and to develop methods for eliminating these effluents from water reservoirs. In this regard, the current work is focused on the detection of an antibiotic rifaximin and its removal from wastewater. A number of research teams are engaged in developing protocols for rifaximin detection. For instance, Abdellatef et al., developed a method that detected rifaximin up to a LOD of 967 mM.7 Similarly, Barzani et al., employed a boron-doped diamond electrode for the detection of rifaximin with a LOD of 178 mM.8 Khezerloo et al., also detected rifaximin up to a LOD of 250 nM by using a modified GCE.9 However, the literature survey reveals a lack of effective protocols for more sensitive sensing of rifaximin and its removal from wastewater. Therefore, the current work presents a carbon nanotube-based modified GCE and ZnO nanoparticles for achieving the two objectives of detection and removal of rifaximin with an LOD of 1.47 nM and adsorptive scavenging capacity of about 85% by NPs.
Carbon nanotubes (CNTs) are an appealing choice for scientists worldwide. They are utilized in electrochemical sensors owing to their good electrical conductivity. The unique conjugated system, enormous active sites, and efficient electron transfer pathways in CNTs make them ideal materials for the designing of electrochemical sensors. The introduction of specific functionalities in CNTs enhances their electrocatalytic role. Selective functionalization of CNTs not only promotes the dispersibility of CNTs but also imparts distinctive features to their structure.10,11 Amino functional groups can be attached either covalently or non-covalently to the surface of CNTs.12 Based on these considerations the current work utilizes amino-functionalized multiwalled carbon nanotubes (NH2-fMWCNTs) for the modification of GCE. The resulting modified electrode demonstrates excellent sensing attributes for responding to rifaximin in wastewater.
Drugs have been widely used in recent years to improve the health of humans and animals. In the last few decades, pharmaceuticals have been recognized as emerging pollutants. Recent studies reveal that the COVID-19 pandemic has resulted in an increase in waste production up to an average of 102.2% in public and private hospitals.13 Some drugs are considered hazardous pollutants because of their harmful consequences to the environment.14 Various methods are used for the removal of pharmaceutical effluents from water reservoirs. We adopted an adsorption approach for rifaximin removal from wastewater using ZnO NPs as adsorbent. Their excellent candidature for adsorption can be attributed to the large number of adsorptive sites on their surfaces. The small size of ZnO NPs enables the rapid transportation of drug molecules to the surface of NPs, resulting in an accelerated rate of adsorption.15 The process of adsorption lowers the concentration of drugs in wastewater, thus reducing their adverse effects on human health and the environment. To the best of our knowledge, this is the first report on nanomolar detection and 85% adsorptive removal of rifaximin from wastewater by NPs.
2. Experimental
Electrochemical measurements such as square wave voltammetry (SWV), cyclic voltammetry (CV), and electrochemical impedance spectroscopy (EIS) were carried out using Multi-Channel Metrohm Autolab (Galvanostat/Potentiostat) (Utrecht, The Netherlands). The structural properties of the ZnO NPs were investigated by using an X-ray diffractometer Phillips X'Pert Pro 3040/60. The optical and adsorption characteristics were analyzed using a Shimadzu 1700 UV-Vis spectrophotometer. The BRUKER Platinum ATR Fourier transform infrared (FTIR) spectrometer was used for FTIR analysis of the NPs. Rifaximin, zinc nitrate hexahydrate, potassium hexacyanoferrate, and functionalized multi-walled carbon nanotubes were obtained from Sigma-Aldrich and used as received.
The sol–gel approach was adopted for the synthesis of ZnO NPs. A 0.1 M solution of zinc nitrate was prepared by dissolving a stoichiometric amount into 50 mL water which was stirred for 15 minutes to get a clear solution. NaOH solution (1 M) was then dropwise added to zinc nitrate hexahydrate solution while being continuously stirred. The mixture was then heated to 60 °C to promote precipitation, and this temperature was kept constant. White precipitates were obtained which were washed using distilled water and ethanol, followed by overnight oven drying at 70 °C. Finally, Zn(OH)2 was calcinated at 500 °C for 4 h to obtain white-colored ZnO NPs.
Sensor for rifaximin detection was prepared by modifying GCE with NH2-fMWCNTs. The surface of GCE was first thoroughly cleaned by physicochemical methods. The GCE was rubbed on a nylon pad in the pattern of digit 8 over water-alumina slurry to remove any impurities from its surface. The GCE was then thoroughly cleansed by sonication in a mixture of water, acetone, and ethanol for 15 minutes and then dried at ambient conditions. It was then subsequently subjected to electrochemical cleaning in which consecutive cyclic voltammograms were recorded in the potential window of 0.1–0.5 V until consistent results were obtained. This step was carried out to remove any kind of oxidizable impurity present on the electrode surface. A three electrodes system comprising working, auxiliary (platinum wire), and reference (silver/silver chloride) electrodes was utilized for electrochemical measurements. SWV was conducted to assess the ability of the designed sensor to detect rifaximin and compare its response with that achieved for rifaximin at the bare GCE. To investigate the modifier's charge transfer ability, EIS and CV were performed on modified GCE by employing potassium ferricyanide as a redox probe. The adsorptive removal of rifaximin from wastewater was monitored by UV-Vis spectroscopy. For adsorption studies, the experiment was conducted under specific conditions, including an adsorbent concentration of 6 mg, a rifaximin solution volume of 25 mL, and a medium of pH 7. At regular intervals, aliquots of the solution were taken out, and UV-Vis spectra were recorded to monitor the adsorption process.
3. Results and discussion
3.1. Architectural analysis of ZnO NPs
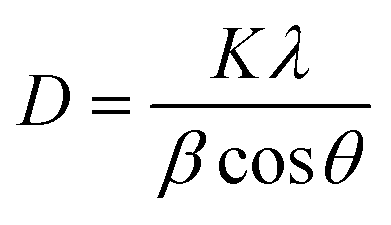
The optical (band gap), structural (crystal structure), and morphological (particle shape) characteristics of the synthesized ZnO NPs were evaluated by UV-Vis spectroscopy, XRD, and FTIR analysis. ZnO NPs showed absorption maxima at 367 nm. The Tauc plot ascertained the band gap of ZnO NPs with a value of 3.24 eV. The crystallite size of ZnO was analyzed by XRD as depicted in Fig. 1a. All the identified peaks correspond well with JCPDS 36-1451. These peaks may be ascribed to particular crystallographic planes and the peak at (101) plane shows the hexagonal wurtzite structure of NPs.16 The average crystallite size was determined by employing the Debye–Scherrer formula.17| |
 | (1) |
where D represents the average crystallite size, K the crystallite shape factor, β the FWHM, λ the X-ray wavelength, and θ the diffraction angle. The average crystallite size of ZnO was found to be 17.25 nm.
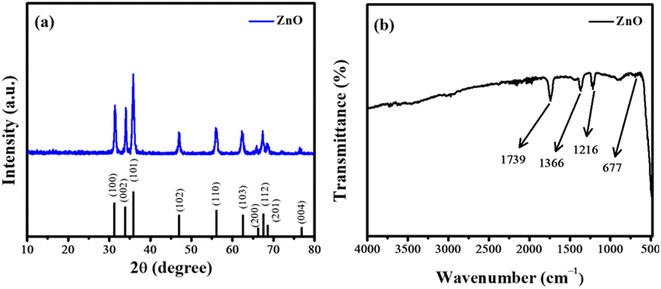 |
| | Fig. 1 (a) XRD pattern and (b) FTIR spectrum of ZnO NPs. | |
The presence of functional groups in synthesized nanoparticles was assessed by FTIR spectroscopy. FTIR spectrum of the ZnO is illustrated in Fig. 1b. FTIR spectroscopy was used to study the vibrational band of ZnO NPs. The transmittance peak at 677 cm−1 represents the stretching vibrational mode of the Zn–O bond of NPs.18 The peak at 1739 cm−1 corresponds to the stretching vibration of the C![[double bond, length as m-dash]](https://www.rsc.org/images/entities/char_e001.gif) O group while the peak originated at 1366 cm−1 can be related to the C–O stretching vibration.19
O group while the peak originated at 1366 cm−1 can be related to the C–O stretching vibration.19
3.2. Electrochemical characterization
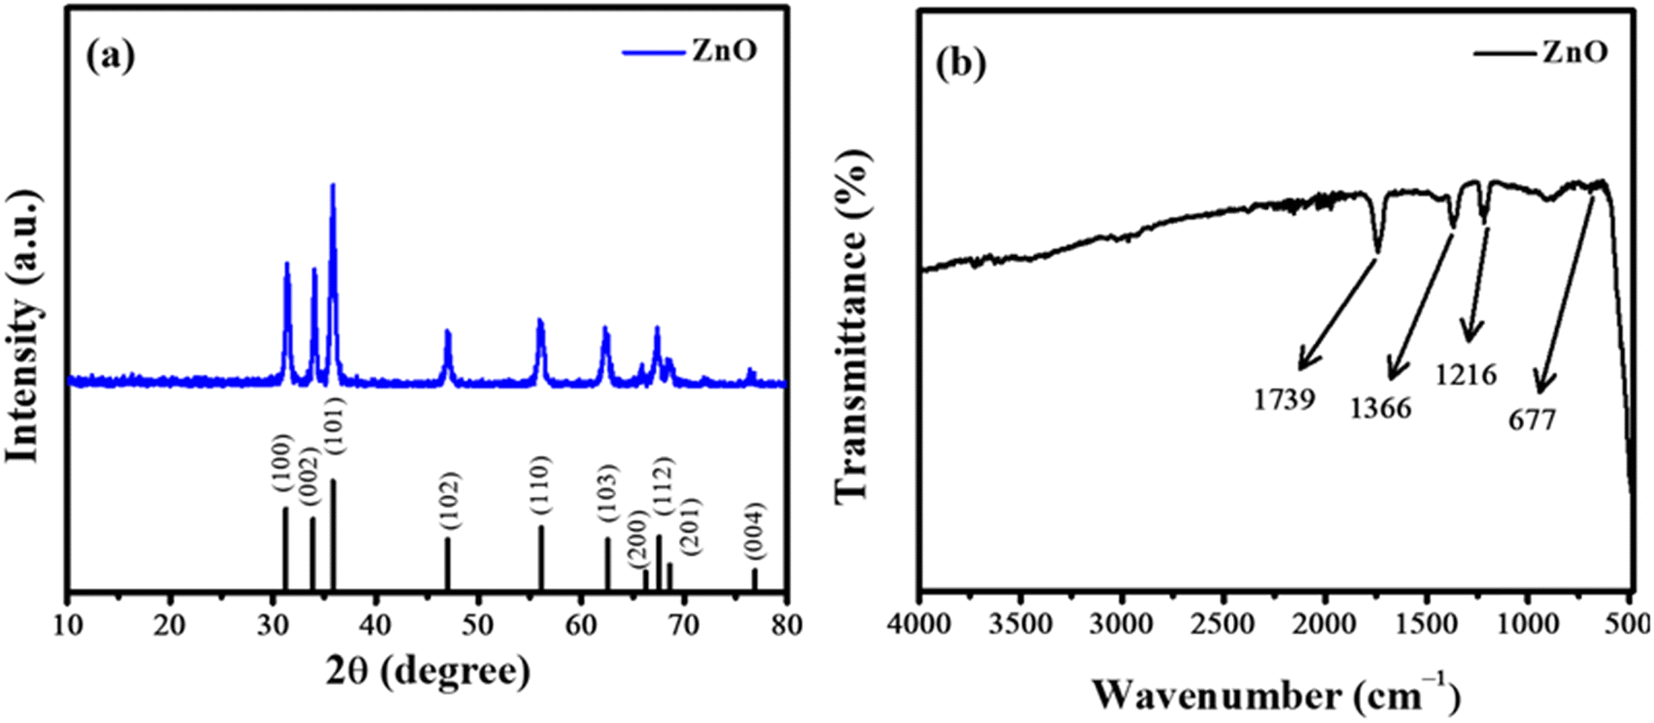
In voltammetric measurement, the surface area is a crucial factor in deciding the performance of an electrochemical sensor. Therefore, for surface area determination of the electrode cyclic voltammograms of the 5 mM solution of the redox probe K3[Fe(CN)6] were recorded at the bare and NH2-fMWCNTs modified GCE at a scan rate of 100 mV s−1. Cyclic voltammograms shown in Fig. 2a reveal that the signals of the redox probe at NH2-fMWCNTs/GCE shift to lower potentials as compared to the response at bare GCE, accompanied by a substantial rise in peak current. The active surface area of GCE and NH2-fMWCNTs/GCE with values of 0.02 and 0.08 cm2 were evaluated from anodic peak current according to the method reported in the literature.20,21 Thus, CV data reveal that NH2-fMWCNTs/GCE has a 4 times higher surface area than the bare GCE. Moreover, the amplified electrocatalytic efficiency of NH2-fMWCNTs/GCE is evident from the intense peak current and lower peak-to-peak separation of the redox probe in comparison to the response at the bare GCE.
 |
| | Fig. 2 (a) Cyclic voltammograms of 5 mM K3[Fe(CN)6] at the bare and NH2-fMWCNTs/GCE recorded in 0.1 M KCl solution; (b) Nyquist plots using EIS data obtained at the bare and NH2-fMWCNTs modified GCEs using 5 mM K3[Fe(CN)6] solution with 0.1 M KCl as supporting electrolyte. | |
Electrochemical impedance spectroscopy (EIS) was employed to probe the interfacial behavior of the modified and bare GCEs. The EIS spectrum shown in Fig. 2b has a semicircular part at a high-frequency region due to the kinetics of the redox reaction and a linear part at a low frequency due to mass transfer impedance. The diameter of the semicircular segment represents the charge transfer resistance (Rct), and the length of the linear segment inclined at 45 degree is due to the diffusion-controlled Warburg impedance (Zw). Rct represents resistance to the transfer of electrons at the electrolyte–electrode interface while Zw corresponds to diffusion processes in the electrolyte. The EIS measurements were performed using 5 mM K3[Fe(CN)6] in 0.1 M KCl as a supporting electrolyte, whereas the variation in frequency ranged from 1 MHz to 0.1 Hz by maintaining an amplitude of 10 mV. Fig. 2b demonstrates the Nyquist plots using data obtained at the bare and NH2-fMWCNTs/GCE. The Rct for bare GCE indicates 5250 Ω interfacial resistance between bare GCE and the corresponding electrolyte. A significantly lower Rct value (683 Ω) after modification of GCE with NH2-fMWCNTs indicates facile charge transfer at the modified electrode surface. Randles' equivalent circuit comprising resistors, constant phase element, and Warburg impedance (Rs, Rct, CPE, and Zw) fitted to the experimental data. The significant decrease in the Rct and CPE values from 5250 Ω and 1.40 μF to 683 Ω and 0.12 μF indicate lower impedance to the charge transport through the weaker electrical double layer, thus satisfying the requirements for efficient charge transfer as required for quickly responding sensing device.
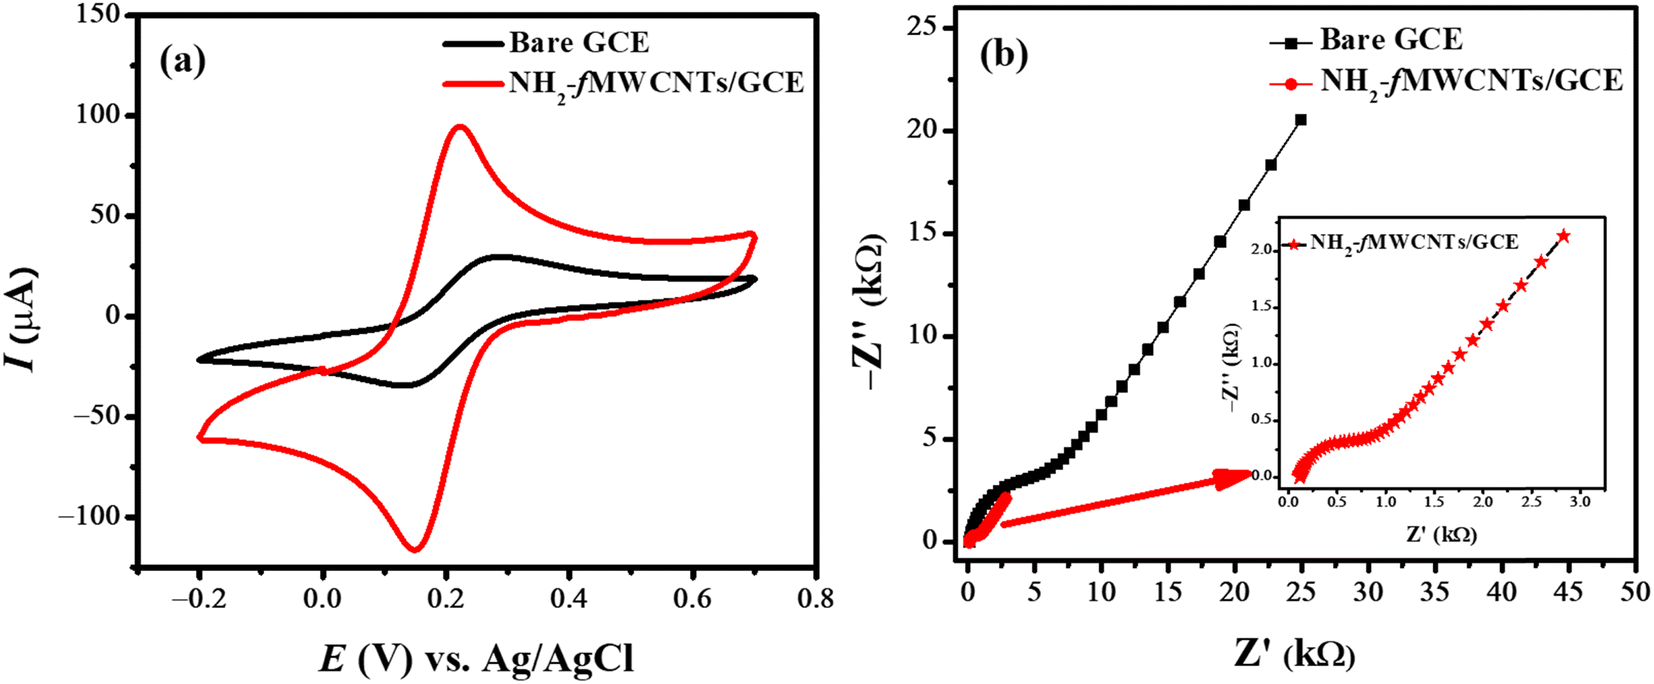
Cyclic voltammetry is a highly promising electrochemical technique that gives information about the nature of electrochemical reactions, whether they are controlled by adsorption or diffusion. To assess the nature of the reaction, it is essential to record cyclic voltammograms at different scan rates. The nature of the reaction can be identified by plotting log values of scan rate and peak current. The influence of various scan rates on the current signal of rifaximin was studied by varying the potential scan rate from 25 mV s−1 to 125 mV s−1. Fig. 3a shows that the peak current intensity of oxidation of rifaximin increases steadily with an increase in scan rate. Moreover, the shifting of peak potential to a higher value is suggestive of the irreversible nature of the electrooxidation of rifaximin.22 The slope value (0.91) of the plot between log![[thin space (1/6-em)]](https://www.rsc.org/images/entities/char_2009.gif) Ip vs. logν (Fig. 3c) indicates that the oxidation process of rifaximin at NH2-fMWCNTs/GCE is mainly controlled by adsorption.23 This argument is further supported by the greater regression coefficient (R2) value of the plot between peak current and scan rate (Fig. 3b) as compared to the plot between peak current and square root of scan rate (Fig. 3d).
Ip vs. logν (Fig. 3c) indicates that the oxidation process of rifaximin at NH2-fMWCNTs/GCE is mainly controlled by adsorption.23 This argument is further supported by the greater regression coefficient (R2) value of the plot between peak current and scan rate (Fig. 3b) as compared to the plot between peak current and square root of scan rate (Fig. 3d).
 |
| | Fig. 3 (a) Cyclic voltammograms of rifaximin at different scan rates; (b) plot between peak current vs. scan rates; (c) plot of logIp as a function of logν; (d) plot between peak current vs. square root of scan rate. | |
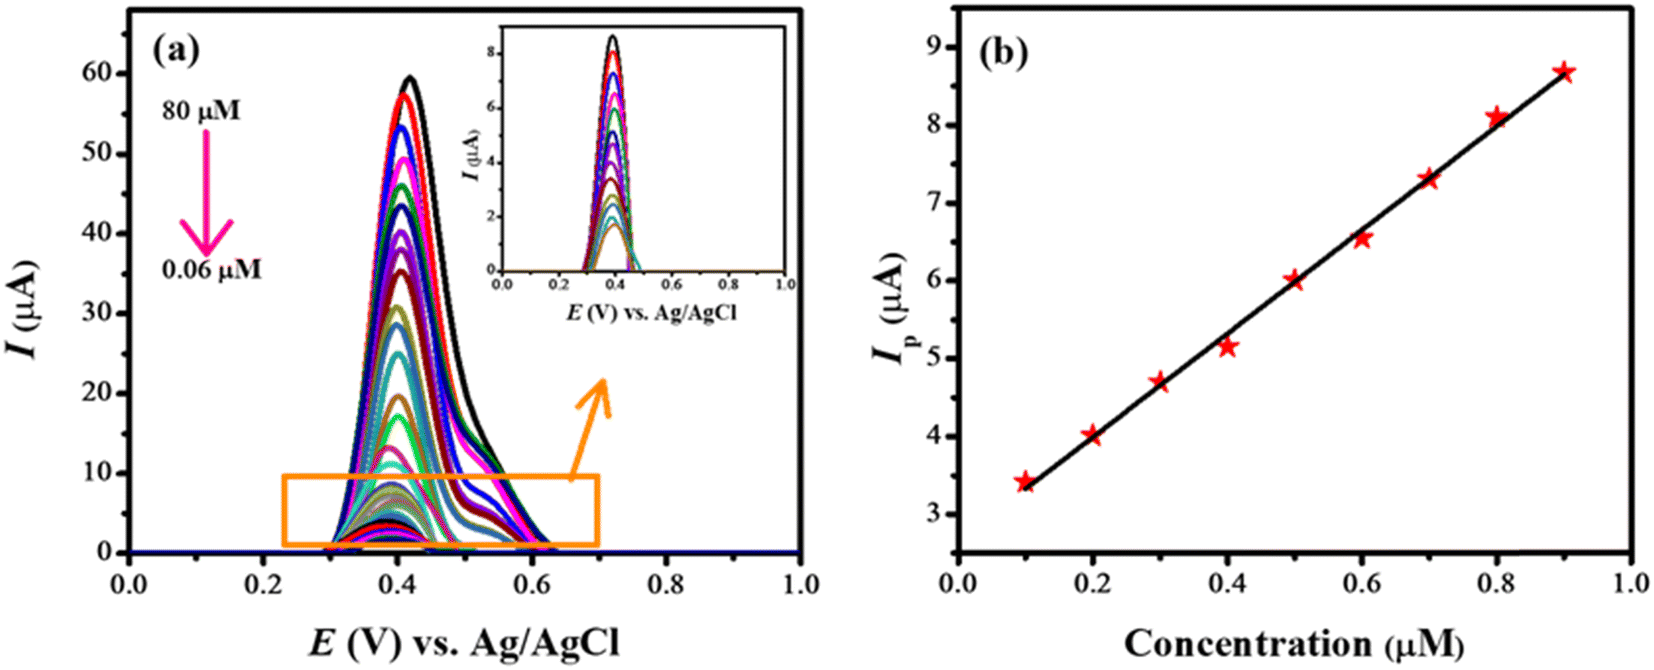
3.3. Analytical application of the designed sensing platform
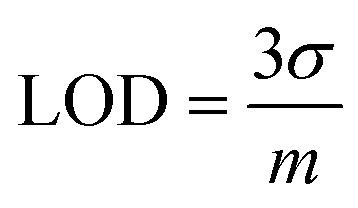
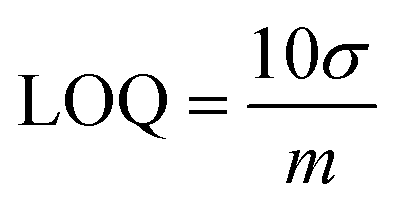
Square wave voltammograms (SWVs) of various concentrations of rifaximin (0.06–80 μM) were obtained at NH2-fMWCNTs/GCE in the medium of pH 7. The recorded SWVs are shown in Fig. 4a. The shoulder appearing at higher concentrations may be due to the oxidation of dimers or oligomers. The calibration plot for the lower concentration of rifaximin is depicted in Fig. 4b. The limit of detection (LOD) and limit of quantification (LOQ) were calculated by using eqn (2) and (3).24| |
 | (2) |
| |
 | (3) |
Here, m represents the slope value estimated from the calibration plot and σ the standard deviation calculated from the peak current value of the blank (eighteen runs). The LOD and LOQ for the rifaximin at the designed sensor were found to be 1.47 nM and 4.90 nM respectively.
 |
| | Fig. 4 (a) Square wave voltammograms obtained at NH2-fMWCNTs/GCE for various concentrations of rifaximin; (b) linear calibration curve in the concentration range of 0.1–0.9 μM. | |
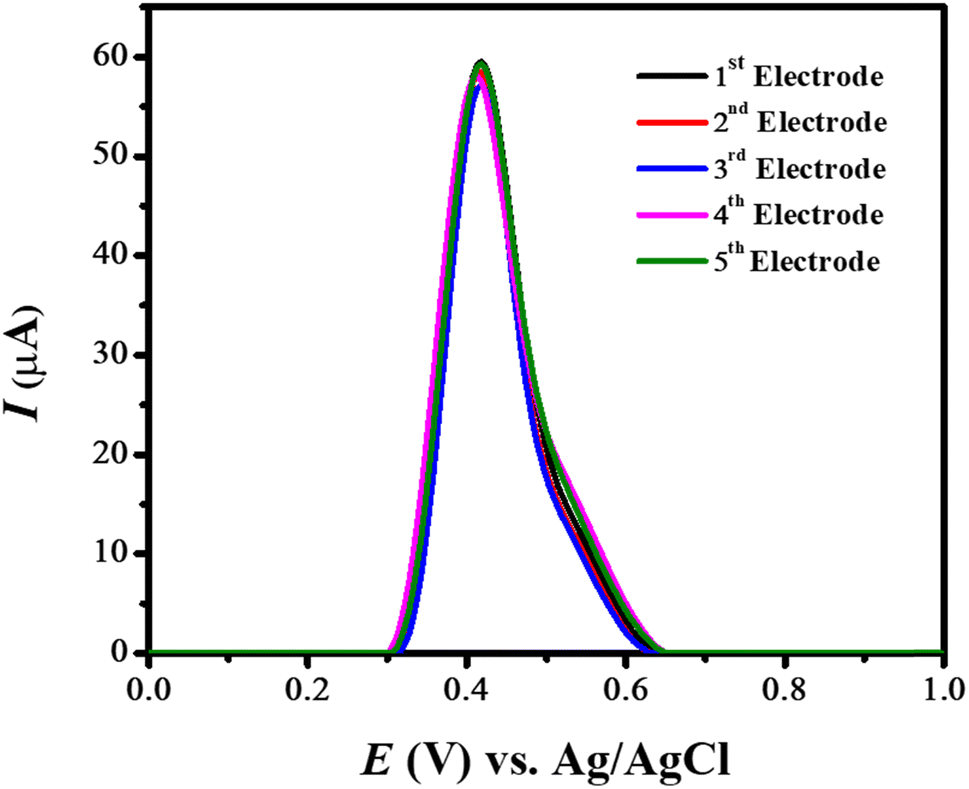
3.4. Reproducibility and repeatability of NH2-fMWCNTs/GCE
The stability of the designed sensing scaffold was tested in terms of repeatability and reproducibility by square wave voltammetric analysis. The SWVs of rifaximin under optimal conditions were recorded to evaluate the stability of the designed sensor. For this purpose, different GCEs of the same size were modified with the same amount of NH2-fMWCNTs, and the as-prepared sensors were employed for recording voltammetric signals of a fixed concentration of rifaximin. No prominent change in the oxidation signal of rifaximin ensured the reproducibility of the designed sensing scaffold as depicted in Fig. 5. To test the repeatability of the sensing platform, NH2-fMWCNTs/GCE was submerged in rifaximin solution for different time intervals, and then square wave voltammetric measurements were run to assess its stability. No obvious variation in the intensity of the peak current up to 36 hours demonstrated the stability of the electrode modifier. This can be attributed to its low solubility in an aqueous medium that prevents its leaching from the surface of the transducer and thus maintains the signal intensity of rifaximin over time.
 |
| | Fig. 5 SWVs of rifaximin showing the reproducibility of the designed sensing platform (NH2-fMWCNTs/GCE). | |
The selectivity of NH2-fMWCNTs for antibiotics depends upon various factors such as chemical functionalities present in specific drugs, nature of antibiotics, presence of the competing group, and electrochemical parameters such as nature of supporting electrolytes (concentration or pH of solution), deposition time as well as deposition potential. The chemical structures of antibiotics vary either in functional groups or in chemical moieties attached to the core structure. Therefore, due to variations in the nature of chemical makeup, every antibiotic has its own specific oxidation/reduction potential. Hence NH2-fMWCNTs are selective for a specific antibiotic. Similarly, the nature of supporting electrolytes significantly influences the oxidation/reduction behavior of antibiotics, thus variation of electrolyte leads to modification in the intensity and shape of the redox signal of drugs. Moreover, the choice of a suitable supporting electrolyte for getting the best redox response for specific antibiotics also leads to the selectivity of NH2-fMWCNTs for antibiotics in a specific electrolyte.
Literature reveals that various analytical techniques such as high-performance liquid chromatography or mass spectrometry,24–26 capillary electrophoresis,27 spectrophotometric method,28 and infrared spectroscopy29 have been used for the determination of rifaximin in tablets, as a pharmaceutical product in serum, human plasma, and urine samples.30 However, the consumption of organic solvents, costly equipment, long time taking protocols, and complicated procedures prompt researchers for alternate methods. Therefore, researchers try to develop easy, simple, rapid, and selective methods for the detection of rifaximin. With this consideration electrochemical techniques hold great promise as an alternate analytical tool because of their easy fabrication, efficient responsiveness, selectivity, and sensitivity.
3.5. Adsorptive removal of rifaximin from wastewater
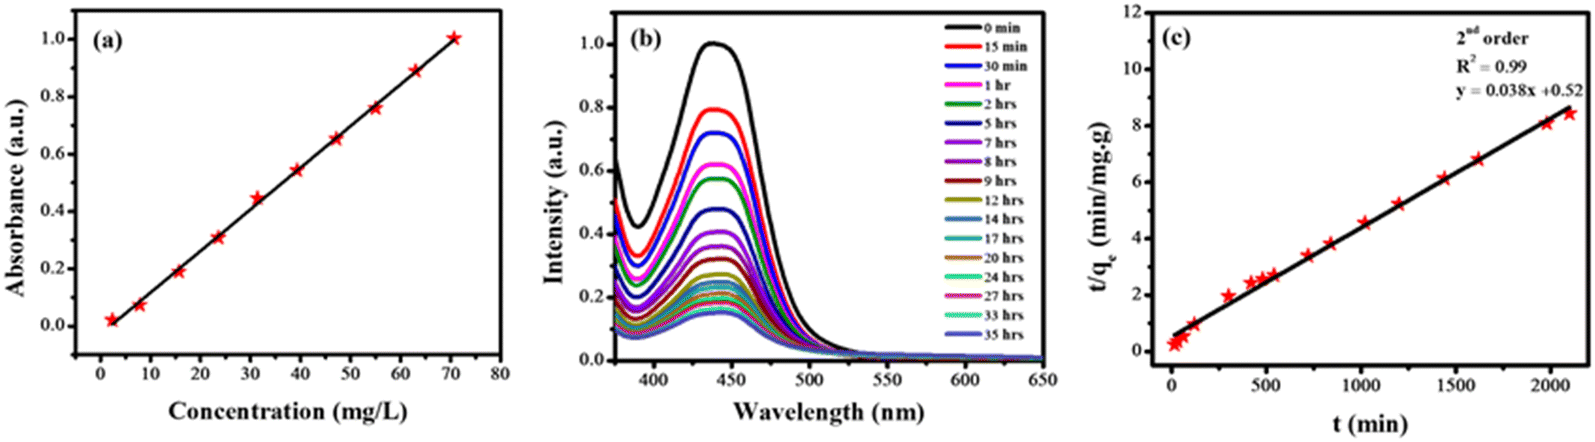
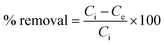
ZnO nanoparticles were used for the adsorptive removal of rifaximin. The time-based adsorption of rifaximin over ZnO NPs and the corresponding decrease of the drug molecules in wastewater were monitored by using UV-Vis spectroscopy. First, a calibration curve was made for the known concentrations of the rifaximin solution versus its absorbance using UV-Vis spectroscopy as depicted in Fig. 6a. Adsorption of rifaximin was monitored by using UV-Vis spectroscopy by taking readings after specific time intervals. Subsequently, by using a calibration plot the drug's absorbance was transformed into its concentration (ppm). To investigate the maximum drug removal efficiency of ZnO NPs the following equation was used.| |
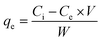 | (4) |
where qe is the maximum adsorption capacity (mg g−1), Ci and Ce correspond to the initial and equilibrium concentrations of the drug (mg L−1) respectively, W represents the dose of NPs (g), and V denotes the volume of solution (L).
 |
| | Fig. 6 (a) Calibration plot between absorbance and concentration of rifaximin; (b) monitoring time-based adsorptive decrease in rifaximin concentration using UV-Vis spectroscopy; (c) kinetic analysis of the adsorption of rifaximin following pseudo 2nd order kinetic model. | |
Various kinetics models were used to investigate the phenomena of transfer of mass between solid and liquid phases. Likewise, adsorption isotherms were used to acquire an understanding of the mechanism of adsorption. ZnO NPs were added to the solution of the drug to facilitate the adsorption of rifaximin. Then the solution was carefully covered to ensure the prevention of any reaction that may occur due to light. The experiment was conducted under specific conditions, including an adsorbent concentration of 6 mg, a drug volume of 25 mL, a pH of 7, and a contact time of 35 hours. At regular intervals, samples were withdrawn for recording their UV-Vis spectra as shown in Fig. 6b that helped to monitor the adsorption process.
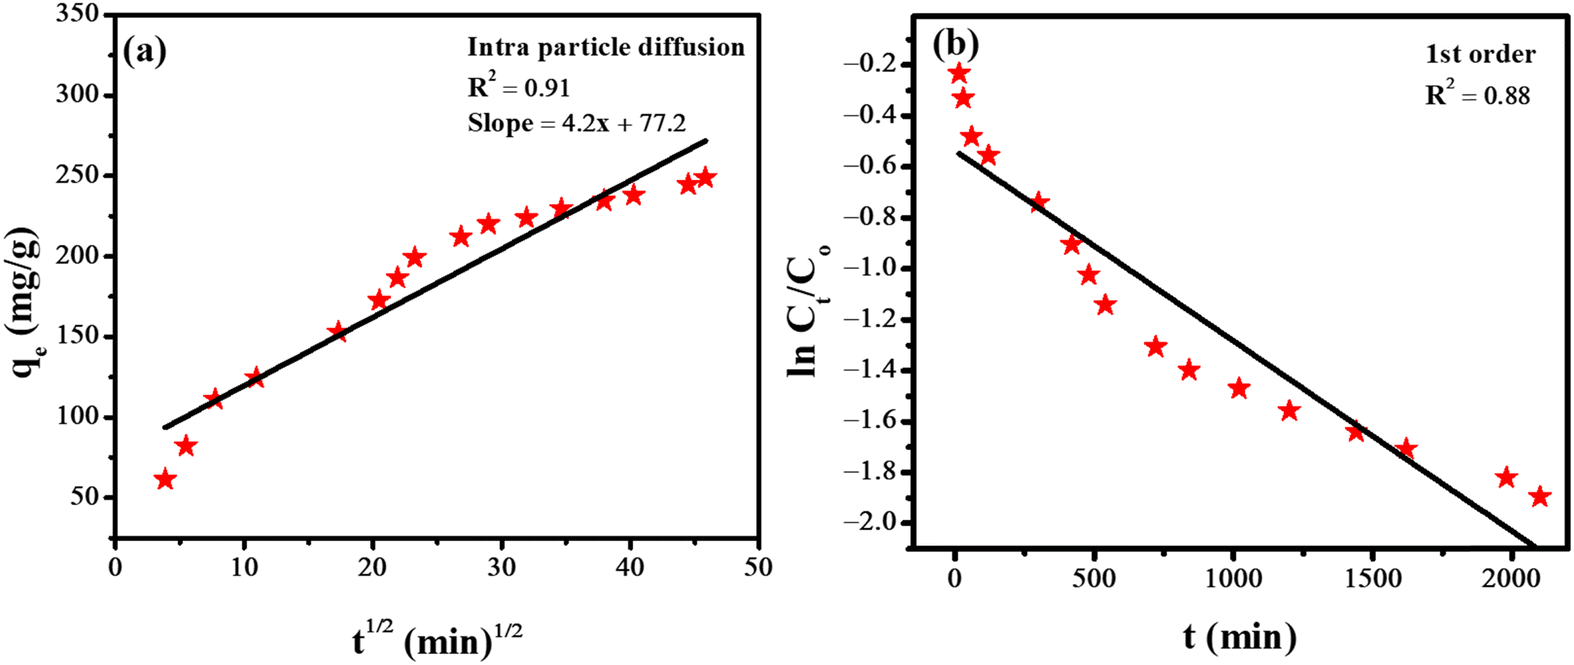
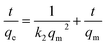
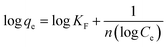
For the analysis of the adsorption rate constant, various kinetic models such as the pseudo-second-order kinetics (Fig. 6c), intraparticle diffusion model (Fig. 7a), and first-order kinetics model (Fig. 7b) were employed. Among the three kinetic models, the data fitted well in the pseudo-second-order kinetics model with a rate constant k2 of 0.00284 g mg−1 min−1.
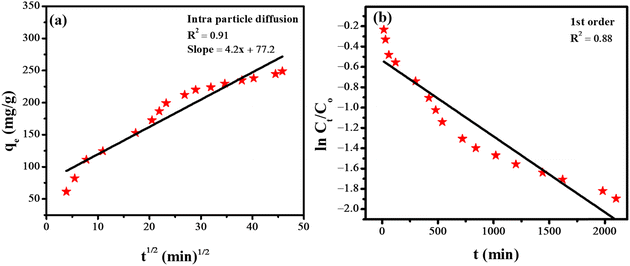 |
| | Fig. 7 (a) Intra-particle diffusion model (b) first order model. | |
The equation for pseudo-second-order kinetics in the linear form is presented below.
| |
 | (5) |
The equation for the intra-particle diffusion model is given below.
The equation for first-order kinetics is given below.
| |
 | (7) |
where
Co represents the initial concentration of the drug and
Ct shows the concentration of the drug at different time intervals.
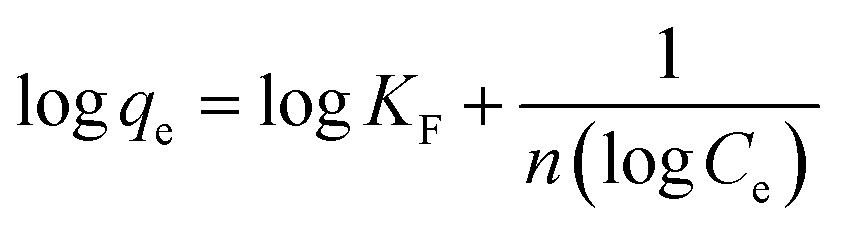
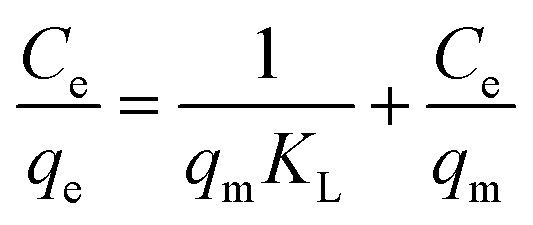
To understand the nature of the adsorbent's surface (whether homogeneous or heterogeneous) and the potential interaction between the adsorbate and adsorbent molecules the spectroscopic adsorption of the drug was fitted into different isotherm models, i.e., Langmuir, Freundlich, and Temkin. Their corresponding expressions are given below.31,32
| |
 | (8) |
| |
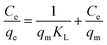 | (9) |
where
qe represents the adsorption capacity at a specific time,
qm denotes the maximum adsorption capacity.
Ce corresponds to the concentration of rifaximin at time
t,
KF and
KL represent the Freundlich and Langmuir constants respectively,
B =
RT/
b, and
A is the equilibrium binding constant.
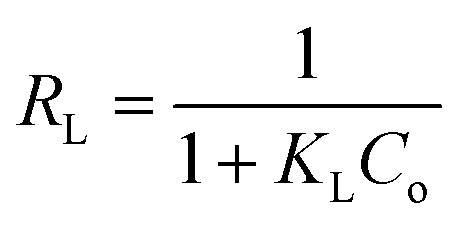
Essential features of adsorption can be explained by using a dimensionless parameter which is derived from the Langmuir constant known as the separation factor RL as given in eqn (11).33
| |
 | (11) |
where “
Co” is the analyte's initial concentration (mg L
−1). The process of adsorption is favorable if the value of
RL is between 0 to 1, if the value is greater than 1 it means adsorption is unfavorable, and if the value is 0 it corresponds to irreversible adsorption.
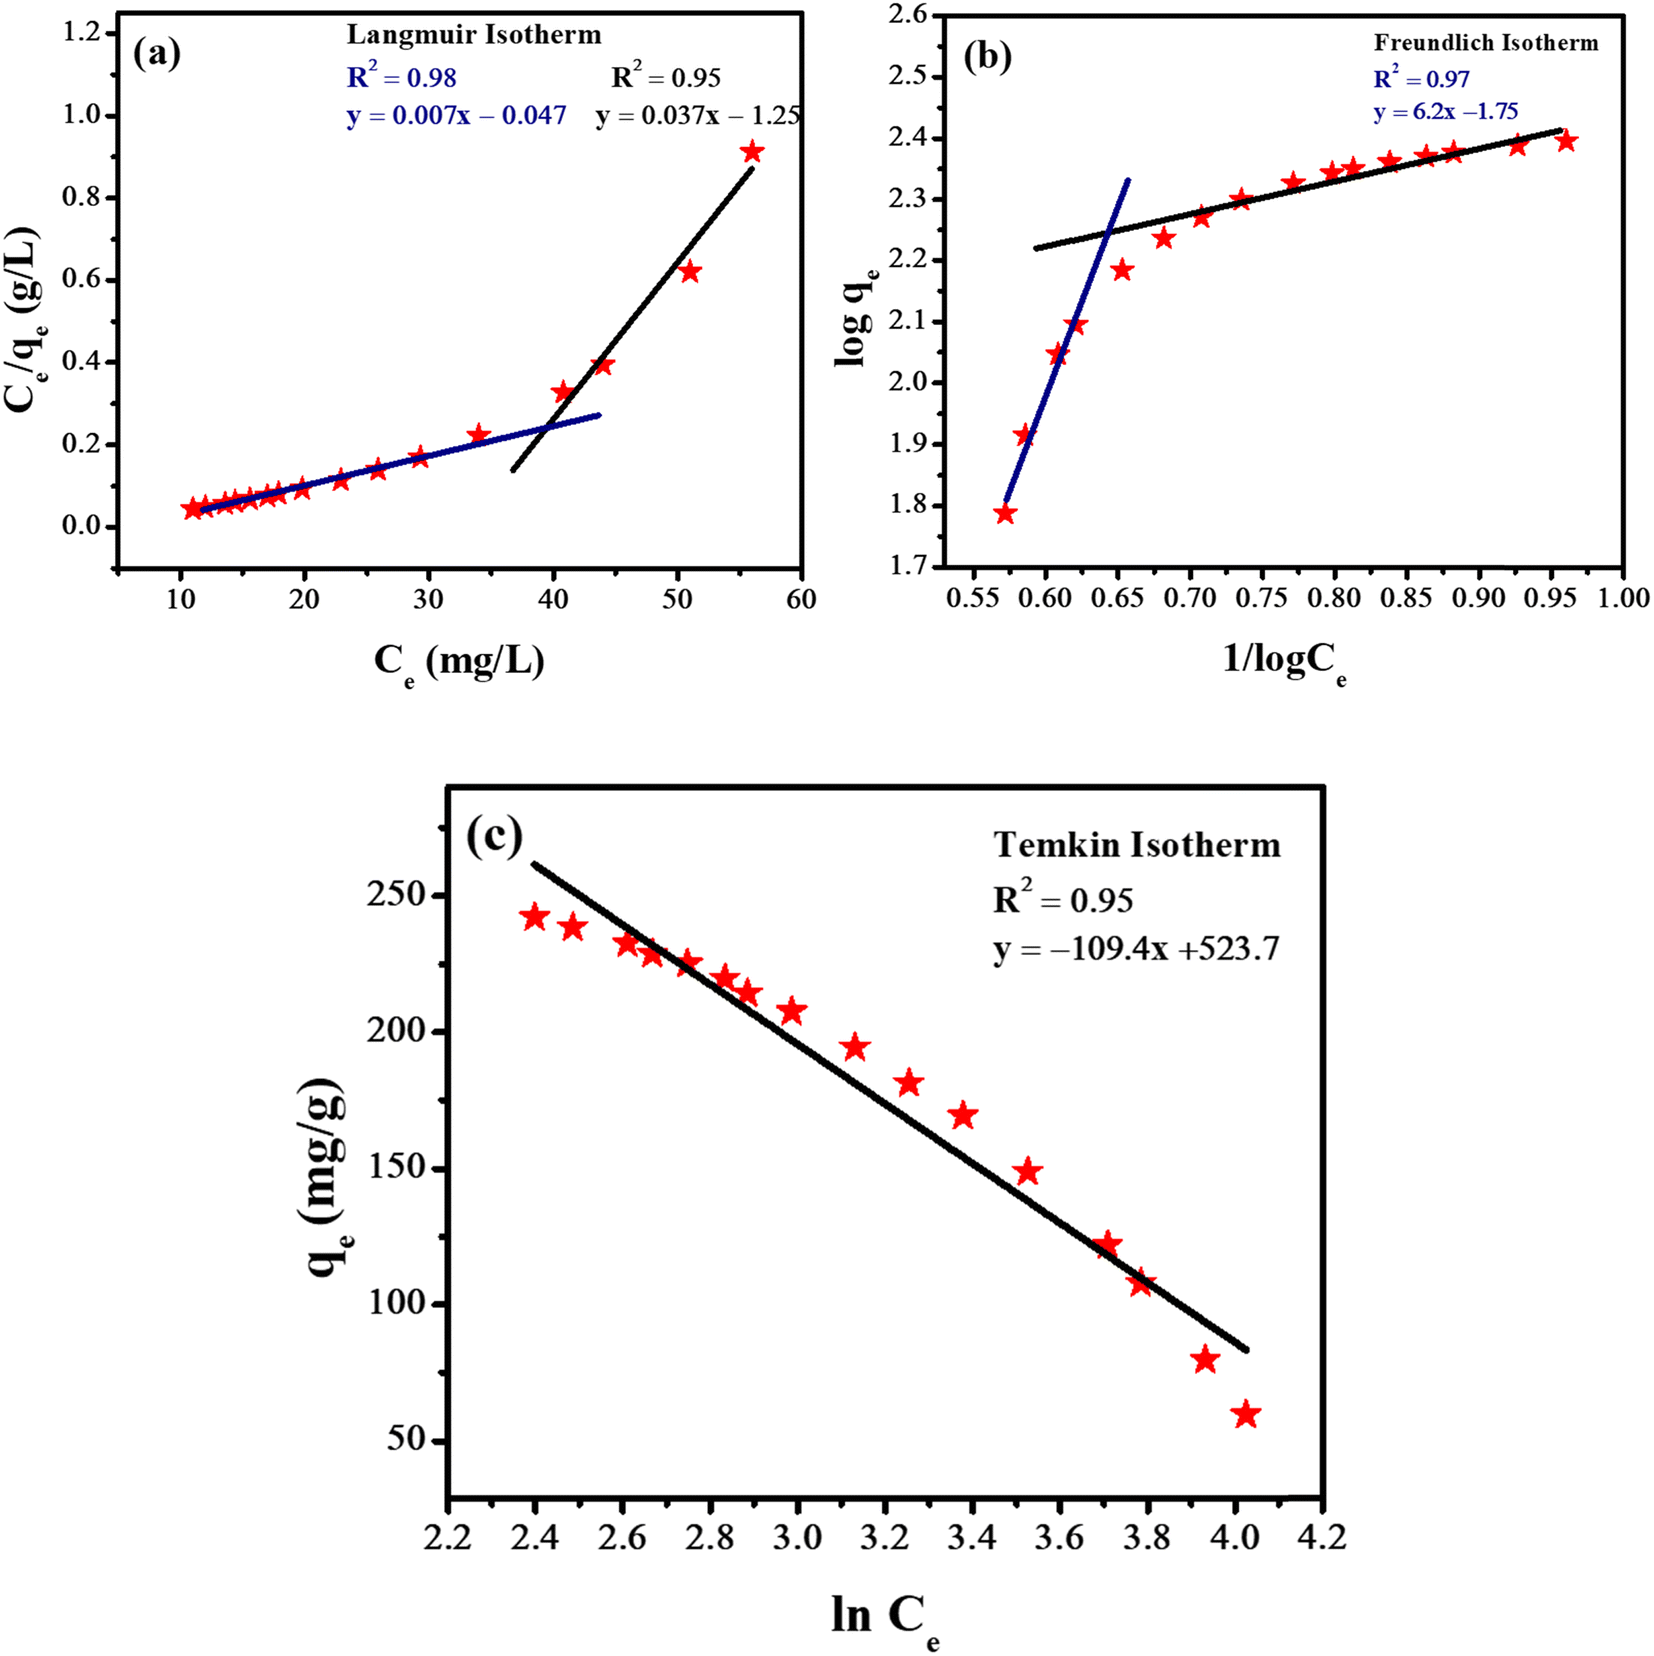
Fig. 8 depicts the different isotherms that were utilized for the analysis of the adsorption of rifaximin. It was noticed that Langmuir adsorption isotherm provided the most accurate fit for the data when the concentration of adsorbate is low and Freundlich adsorption isotherm was best fitted at the higher concentration of adsorbate. While the Temkin isotherm was fitted for the entire concentration range. The existence of many adsorption sites and dynamic interactions on the surface might be the cause of this unusual adsorption behavior. At the higher concentration of adsorbate, the Freundlich isotherm was followed, indicating that there is multilayer adsorption because of the occupancy of sites. On the other hand, lower concentration leads to monolayer adsorption which depicts that Langmuir isotherm was followed. This occurred because of the changing nature of interactions between adsorbate and adsorbent at different concentrations. Temkin isotherm was consistently fitted on the whole concentration range, and it accounts for the changes in heat of adsorption. The values of various parameters which were obtained from different adsorption isotherms have been given in Table 1.
 |
| | Fig. 8 Different isotherms for adsorption of drugs (a) Langmuir adsorption isotherm; (b) Freundlich adsorption isotherm; (c) Temkin adsorption isotherm. | |
Table 1 Parameters evaluated from different adsorption isotherms
| Adsorption isotherms |
Parameters |
Values |
| Langmuir |
qm |
134 (mg g−1) |
| KL |
0.15 (L mg−1) |
| RL |
0.087 |
| Freundlich |
KF |
56.23 (mg g−1) |
| N |
0.16 |
| Temkin |
A |
98.2 (L g−1) |
| B |
109 (J mol−1) |
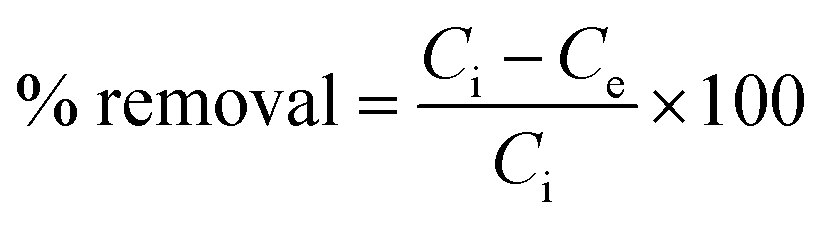
The removal efficiency was calculated by using the following formula.
| |
 | (12) |
where
Ci is the initial concentration of the drug and
Ce is the concentration of the drug at different time intervals.
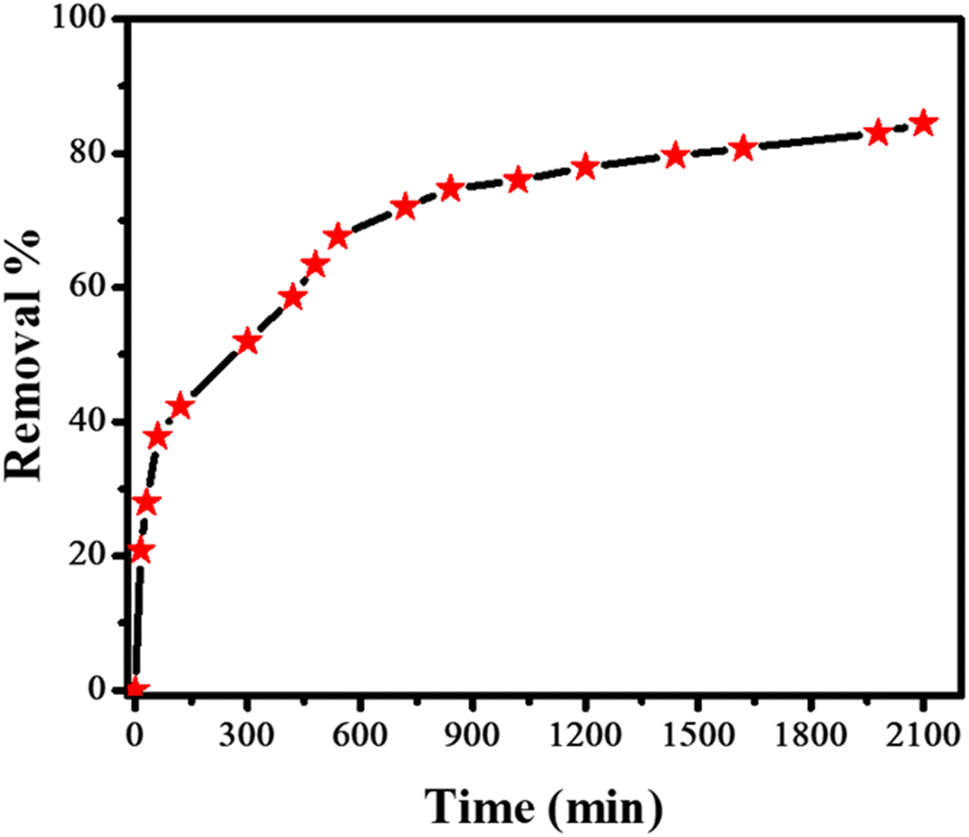
Fig. 9 shows the % removal of rifaximin with time.
 |
| | Fig. 9 The % removal of rifaximin with time using UV-Vis spectroscopic data. | |
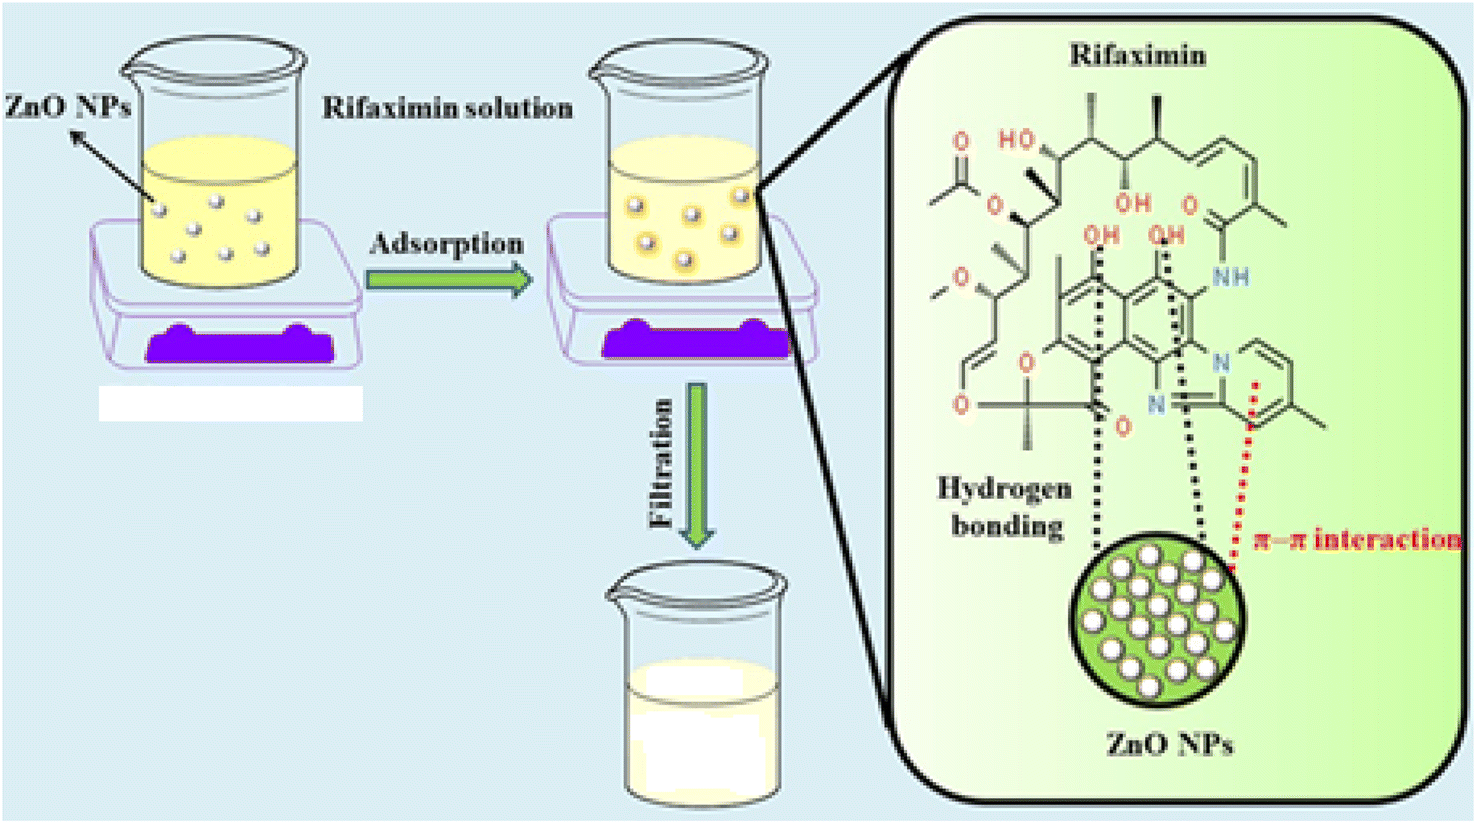
3.5.1. Proposed mechanism of adsorption of rifaximin. Adsorption is a surface phenomenon that entails molecules only on the surface of the adsorbent by various interactions such as electrostatic interactions, van der Waals forces, H-bonding, and π–π interactions between the adsorbate and the adsorbent.32 The possible interactions between rifaximin and ZnO NPs are H-bonding or π–π interactions as evident from their structure. The small size of NPs provides a large number of active sites for the adsorption of rifaximin at the surface of the adsorbent thus reducing the concentration of adsorbate. A proposed adsorption mechanism of rifaximin by ZnO NPs is depicted in Fig. 10.
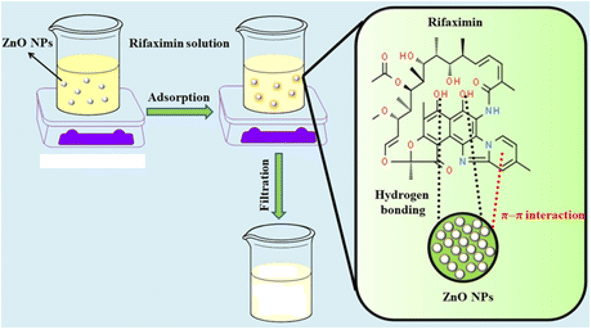 |
| | Fig. 10 Schematics of rifaximin adsorption by the adsorbent ZnO NPs. | |
ZnO NPs are widely used due to their environmental benign characteristics and effectiveness for adsorbing a wide range of drugs from water bodies. The remarkable adsorption capabilities of ZnO NPs can be attributed to their high stability and large number of adsorptive sites owing to their boosted surface area, which makes them excellent candidate for adsorption. ZnO causes no secondary pollution owing to its environmentally benign nature and it is preferred because of its cost-effectiveness, abundant availability of its precursor and easy synthesis route. Literature survey reveals only one report for the removal of rifaximin from wastewater by adsorption technique.34 Our adsorbent shows a maximum adsorption capacity of 134 mg g−1 in neutral medium. While the reported adsorbent is effective in acidic medium with an adsorption capacity of only 30.12 mg g−1.34
4. Conclusions
A selective and stable voltammetric sensor was prepared by modifying GCE with NH2-fMWCNTs for the sensitive detection of rifaximin. The electrode modifier resulted in fast charge transport through the modified electrode leading to improved sensitivity for rifaximin detection as evidenced by an LOD value of 1.47 nM. The repeatability and reproducibility experiments ensured the stability of the sensing layer over the transducer surface. An adsorptive method for the removal of rifaximin was developed using ZnO NPs. Adsorption of rifaximin followed Langmuir isotherm at a lower concentration of adsorbate and Freundlich isotherm at a higher concentration of adsorbate. The current wastewater treatment technology can be extended for the monitoring and treatment of other pharmaceutical waste-based emerging contaminants.
Data availability
The authors confirm that the data supporting the findings of this study are available within the article. These data were derived from the following resources: Multi-Channel Metrohm Autolab (Galvanostat/Potentiostat) (Utrecht, The Netherlands), X-ray diffractometer Phillips X'Pert Pro 3040/60, Shimadzu 1700 UV-Vis spectrophotometer and BRUKER Platinum ATR Fourier transform infrared (FTIR) spectrometer.
Conflicts of interest
Authors declare that there is no conflict of interest.
Acknowledgements
Authors gratefully acknowledge Quaid-i-Azam University Islamabad, and Higher Education Commission of Pakistan for supporting this work.
References
- M. Patel, R. Kumar, K. Kishor, T. Mlsna, C. U. Pittman Jr and D. Mohan, Chem. Rev., 2019, 119, 3510–3673 CrossRef CAS.
- R. Krakowiak, J. Musial, P. Bakun, M. Spychała, B. Czarczynska-Goslinska, D. T. Mlynarczyk, T. Koczorowski, L. Sobotta, B. Stanisz and T. Goslinski, Appl. Sci., 2021, 11, 8674 CrossRef CAS.
- D. O'Flynn, J. Lawler, A. Yusuf, A. Parle-McDermott, D. Harold, T. Mc Cloughlin, L. Holland, F. Regan and B. White, Anal. Methods, 2021, 13, 575–594 RSC.
- K. Samal, S. Mahapatra and M. H. Ali, Energy Nexus, 2022, 6, 100076 CrossRef CAS.
- K. Liguori, I. Keenum, B. C. Davis, J. Calarco, E. Milligan, V. J. Harwood and A. Pruden, Environ. Sci. Technol., 2022, 56, 9149–9160 CrossRef CAS PubMed.
- J. Iqbal, N. S. Shah, Z. U. H. Khan, M. Rizwan, B. Murtaza, F. Jamil, A. Shah, A. Ullah, Y. Nazzal and F. Howari, J. Water Process Eng., 2022, 49, 103130 CrossRef.
- R. Abdellatef, E. Khaled, H. A. Hendawy and R. Y. Hassan, J. Anal. Test., 2021, 5, 341–349 CrossRef.
- H. A. Barzani, H. S. Ali and Y. Yardım, Diamond Relat. Mater., 2023, 132, 109647 CrossRef CAS.
- E. Khezerloo and F. Hekmat, Diamond Relat. Mater., 2023, 139, 110280 CrossRef CAS.
- S. T. R. Naqvi, T. Rasheed, D. Hussain, M. N. ul Haq, S. Majeed, N. Ahmed and R. Nawaz, J. Mol. Liq., 2020, 297, 111919 CrossRef CAS.
- T. Kokab, A. Shah, M. A. Khan, M. Arshad, J. Nisar, M. N. Ashiq and M. A. Zia, ACS Appl. Nano Mater., 2021, 4, 4699–4712 CrossRef CAS.
- A. Yaghoubi and A. Ramazani, Curr. Org. Chem., 2018, 22, 1505–1522 CrossRef CAS.
- R. R. Kalantary, A. Jamshidi, M. M. G. Mofrad, A. J. Jafari, N. Heidari, S. Fallahizadeh, M. Hesami Arani and J. Torkashvand, J. Environ. Health Sci. Eng., 2021, 19, 831–836 Search PubMed.
- M. Ahmed and B. Hameed, Ecotoxicol. Environ. Saf., 2018, 149, 257–266 Search PubMed.
- F. Islam, S. Shohag, M. J. Uddin, M. R. Islam, M. H. Nafady, A. Akter, S. Mitra, A. Roy, T. B. Emran and S. Cavalu, Materials, 2022, 15, 2160 Search PubMed.
- S. Aftab, T. Shabir, A. Shah, J. Nisar, I. Shah, H. Muhammad and N. S. Shah, Nanomaterials, 2022, 12, 486 Search PubMed.
- Z. Zhang, L. Gong, X. Zhan, B. Hong, X. Wang, Y. Xia and Y. Zeng, J. Environ. Chem. Eng., 2024, 12, 112583 CrossRef CAS.
- F. Aslam, A. Shah, N. Ullah and S. Munir, ACS Appl. Nano Mater., 2023, 6, 6172–6185 CrossRef CAS.
- S. Alias, A. Ismail and A. Mohamad, J. Alloys Compd., 2010, 499, 231–237 CrossRef CAS.
- M. U. Sadiq, A. Shah, J. Nisar and I. Shah, Nanomaterials, 2023, 13, 2218 CrossRef CAS.
- A. Shah, ACS Omega, 2020, 5, 6187–6193 CrossRef CAS.
- T. Kokab, A. Shah, M. A. Khan, J. Nisar and M. N. Ashiq, RSC Adv., 2021, 11, 27135–27151 RSC.
- E. C. Okpara, O. E. Fayemi, E.-S. M. Sherif, P. S. Ganesh, B. K. Swamy and E. E. Ebenso, Sens. Bio-Sens. Res., 2022, 35, 100476 CrossRef.
- H. Hrichi, L. Monser and N. Adhoum, J. Electroanal. Chem., 2017, 805, 133–145 Search PubMed.
- X. Zhang, J. Duan, K. Li, L. Zhou and S. Zhai, J. Chromatogr. B, 2007, 850, 348–355 CrossRef CAS.
- R. Nageswara Rao, R. Mastan Vali and A. Vara Prasada Rao, J. Sep. Sci., 2012, 35, 1945–1952 CrossRef.
- V. R. Karla, B. Palakeeti, M. Raghasudha and R. Chitta, Future J. Pharm. Sci., 2022, 8, 14 CrossRef.
- A. C. Kogawa, A. Van Schepdael and H. R. N. Salgado, J. Chromatogr. Sci., 2019, 57, 476–483 CAS.
- A. C. Kogawa and H. R. N. Salgado, Scientifica, 2016, 2016, 3463405 CrossRef.
- A. C. Kogawa and H. R. Nunes Salgado, Curr. Pharm. Anal., 2018, 14, 108–115 CAS.
- K. A. Khan, A. Shah and J. Nisar, RSC Adv., 2024, 14, 2504–2517 RSC.
- N. Sheraz, A. Shah, A. Haleem and F. J. Iftikhar, RSC Adv., 2024, 14, 11284–11310 RSC.
- M. de la Luz-Asunción, E. E. Pérez-Ramírez, A. L. Martínez-Hernández, V. M. Castano, V. Sánchez-Mendieta and C. Velasco-Santos, Chin. J. Chem. Eng., 2019, 27, 912–919 CrossRef.
- M. Malmir and F. Shemirani, Russ. J. Gen. Chem., 2023, 93, S934–S945 CrossRef CAS.
|
| This journal is © The Royal Society of Chemistry 2024 |
Click here to see how this site uses Cookies. View our privacy policy here. 
 Open Access Article
 This Open Access Article is licensed under a Creative Commons Attribution-Non Commercial 3.0 Unported Licence
 *
*