
 Open Access Article
 This Open Access Article is licensed under a Creative Commons Attribution-Non Commercial 3.0 Unported Licence
CTAB-induced synthesis of two-dimensional copper oxalate particles: using L-ascorbic acid as the source of oxalate ligand†
Bo Shena,
Zhengqiu Chena,
Huaming Maob,
Jungang Yinb,
Yu Renb,
Wei Daib,
Shuanglong Zhaob and
Hongwei Yang *ab
*ab
aKunming Institute of Precious Metals, Kunming 650106, People's Republic of China
bYunnan Precious Metals Laboratory Co., Ltd., Kunming 650106, People's Republic of China. E-mail: nanolab@ipm.com.cn
First published on 23rd July 2024
Abstract
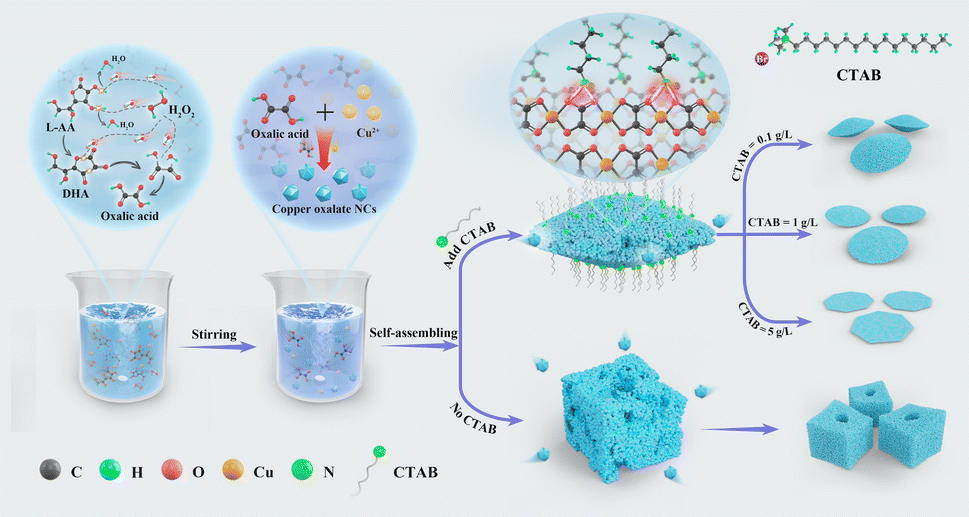
Copper oxalate is typically synthesized through a precipitation reaction involving copper salts mixed with oxalic acid or oxalate solutions. However, in this study, we were successful in synthesizing well-formed square-like copper oxalate particles under liquid-phase conditions at ambient temperature and pressure using ascorbic acid as the source of the oxalic acid ligand. The addition of cationic surfactant cetyltrimethylammonium bromide (CTAB) caused the morphology of copper oxalate particles to undergo a transition from three-dimensional to two-dimensional. And the inhibition of the assembly of primary copper oxalate nanocrystals along the [001] direction became stronger with the increase of CTAB concentration. The impact of CTAB on the crystallization, growth, and self-assembly processes of primary copper oxalate nanocrystals was analysed using various testing methods. Based on these analyses, the possible mechanism of CTAB-induced synthesis of two-dimensional copper oxalate particles was finally proposed.
Introduction
Transition metal oxalates (TMOxs) are a class of metal–organic compounds in which the transition metal cation and the dicarboxylic acid oxalate anion are linked to form a coordination polymer chain via a Me–O bond, resulting in a structure of different dimensions.1,2 TMOxs can be found naturally in mineral deposits or in plant, fungal, and animal tissues.3–5 Synthetic TMOxs are typically produced by mixing soluble transition metal salts with a source of oxalate anions in a precipitation reaction. TMOxs can be converted to their corresponding metal or oxide without losing their ordered structure through thermal decomposition at temperatures well below the metal's melting point.6 As a result, they are frequently used as precursors for metals or oxides.7–10 In addition, some of the TMOxs have superior electrochemical properties compared to their oxide counterparts, and thus have been explored and applied in various energy storage device fields.1,11,12Copper oxalate is a simple, inexpensive TMOx that maintains good crystalline phase and regular shape during synthesis.13 Previous studies have shown that the current mainstream method for the preparation of copper oxalate particles is to prepare the copper salt with an aqueous solution of oxalic acid or soluble oxalate by mixing through vigorous stirring and then through a direct precipitation reaction.7–9,14 During the precipitation process, it is often necessary to adjust the pH of the solution with strong acids or bases in order to prevent the possible formation of copper hydroxide.15,16 In addition, the copper oxalate powder obtained by the precipitation-stripping method tends to agglomerate.17 Other methods, such as solvothermal10 (hydrothermal),18 ether–water bilayer refluxing system19 and ionic liquid-assisted synthesis,20 can also be used to obtain copper oxalate particles. However, these methods are either energy-intensive with long heating times, require complex processes or use large amounts of toxic reagents in the synthesis. All these factors hinder the industrialization of large-scale applications. Finally, due to the strong acidity of oxalic acid, the use of oxalic acid directly as the source of oxalic acid ligand in the reaction system will inevitably increase the solubility of copper oxalate, which limits the increase of the yield of copper oxalate particles to a certain extent.21
The self-assembly mechanism of copper oxalate nanocrystals has been extensively studied. The mechanism has been modified from simple nucleation, growth and “block-by-block” self-assembly15 to the “core–shell” mechanism: the initial rapid nucleation followed by aggregation to form randomly oriented primary particles or crystal cores, and then the crystals form well-aligned nanocrystalline inner shells by orderly attachment, and finally the high-energy surface is eliminated during solution equilibrium, and the larger cemented well-glued crystal shells wrapped around the inner shells.22 In addition, changes in the reaction conditions and the addition of additives with different properties can affect the self-assembly process of copper oxalate primary nanocrystals. When no additives are added during the reaction, the copper oxalate crystals observed are usually in the typical mat form;15 in the presence of polyethylene glycol (PEG), a PEG-mediated etching process can be observed on copper oxalate crystals;14 and glycerol accelerates the radial self-assembly of the copper oxalate crystals, which leads to the formation of lens morphology without a plane.23 Cellulose derivatives of different molecular weights and functional groups (methyl and propyl) affect the precipitation of copper oxalate to different degrees. In the presence of hydroxypropyl methyl cellulose (HPMC), a shift in the shape of copper oxalate particles of micrometeor size from soft cushion, cube, square rod and finally to thin cylindrical rods can be observed as the concentration of HPMC increases.15 The formation of short square rods was observed when methyl-only containing cellulose derivatives were used, and blood platelet-like particles were observed when only propyl-substituted cellulose was used.24
L-Ascorbic acid (L-AA) is a water-soluble vitamin that can be metabolically converted to oxalic acid in animals25 or plants.26 Inspired by this, in the absence of fine biological processes, Zhou et al. reported the decomposition of L-AA to oxalic acid under hydrothermal conditions and its capture in the form of copper oxalate deposition.27 Compared with the traditional synthesis method, the in situ generation of oxalic acid by L-AA not only effectively slows down the rate of precipitation and prevents the agglomeration of copper oxalate particles, but also benefits from the presence of L-AA, the experimental process does not need to additionally add a strong acid or a strong base to adjust the pH of the solution, and the copper oxalate particles with a high purity and high yield can be obtained. The L-ascorbic acid-mediated green synthesis of copper oxalate particles is an effective, non-toxic and environmentally friendly method.
In our work, L-AA was used as a source of oxalic acid ligand for the rapid synthesis of square-like copper oxalate particles under ambient temperature and atmospheric pressure, which, to the best of our knowledge, has not been reported in previous studies. On this basis, high yields of two-dimensional copper oxalate particles were obtained using cetyltrimethylammonium bromide (CTAB) as an additive and the possible formation mechanism was proposed. The synthesis method was transitioned from the use of excessive chemicals to natural compounds, which may be a more environmentally friendly and efficient method for the preparation of copper oxalate nanoparticles with good properties and fewer limitations.
Experimental section
Chemicals and materials
Copper sulfate pentahydrate (CuSO4·5H2O, AR) and hydrogen peroxide (H2O2, 30%, AR) were purchased from Sinopharm Chemical Reagent Co., Ltd. L-ascorbic acid (L-AA, C6H8O6, 99%) was purchased from Shanghai McLean Biochemistry Science & Technology Co., Ltd and cetyltrimethylammonium bromide (CTAB, 99%) was purchased from Beijing InnoChem Science & Technology Co., Ltd. All chemicals used in the experiment were used as received and were not further purified. The deionized water used in the experiment was prepared by an ultrapure water machine, with a resistivity greater than 18.2 MΩ cm.Preparation of copper oxalate
In a typical synthesis procedure, three aqueous solutions were first prepared at room temperature: 40 mM CuSO4 (a); 110 mM L-AA (b); and 5.5 mM CTAB (c). In a water bath at 25 °C, 50 ml of solution (a) was poured into 50 ml of solution (b) to form a mixed solution and stirred for 5 min, and then 1 ml of 30% mass concentration H2O2 solution and 20 ml of solution (c) were added into the mixed solution at the same time and stirred for a certain period of time, and the stirring speed was kept at 10 rpm throughout the whole process. After stirring, the mixture was taken out and aged for 30 min, and an appropriate amount of deionized water was washed several times by sonication and centrifugation, and the product was dispersed in deionized water for subsequent characterization. In the experiments where CTAB was not added, an equal amount of deionized water was used instead of CTAB solution.Characterization
Copper oxalate particles of different morphologies and sizes were characterized by cold field emission scanning electron microscopy (Hitachi SU8010), and the powder samples were sputtered with gold prior to testing. Transmission electron microscopy analysis of the samples was carried out using a Japanese JEOL JEM-2100Plus microscope with an operating voltage of 200 kV. Crystal structure and phase identification of the samples were carried out using an XRD system (Rigaku X-ray Diffractometer SmartLab TM 9 kW) under a Cu target and Kα radiation (λ = 1.54056 Å), with a scanning range (2θ) of 10–80° with a step size of 0.02°. The samples were thermally analysed using a NETZSCH STA-409PC in an argon atmosphere with a temperature increase rate of 10 °C min−1. The surface chemical state of the samples was characterized by an XPS system (Thermo Fisher K-Alpha). The structure and surface chemistry of the samples were analysed by infrared spectroscopy (NICOLET-iS50FT-IR) and Raman spectroscopy (Horiba LabRAM HR Evolution, laser wavelength 514.5 nm). Oxalic acid quantification via ascorbic acid oxidized by H2O2 was performed using a U3000 high performance liquid chromatograph (Thermo Fisher). The zeta potential of the samples was determined using a Malvern Zetasizer Nano ZS90.Results and discussion
According to published studies, for copper oxalate crystals prepared without additives during the reaction process, they often show a typical mat morphology (Fig. 1a).15,22,23,28 Of the six faces exposed by the crystals, two relatively rough and raised faces are defined as the α face, perpendicular to the [001] direction; four relatively smooth and flat faces were defined as the ε face, perpendicular to the [110] and [1![[1 with combining macron]](https://www.rsc.org/images/entities/char_0031_0304.gif) 0] directions.15,24 In this work, most of the copper oxalate crystals in the reaction mixture without the addition of CTAB were square-like particles, and a small portion maintained the typical mat-like morphology of copper oxalate, but both of them had a distinctive pit on the face (Fig. 1b). Performing a careful observation, it can be found that these pits are always positioned in the central region of the raised surface of the copper oxalate nanostructures, which may be due to the smaller size of the nanocrystals located in the central part of the polycrystalline particles. The solubility increases exponentially as the crystal size decreases. When the synthesized copper oxalate particles are exposed to the H2O2 solution environment, the raised surface centres with higher solubility will be etched first, resulting in the formation of surface pit structures.14 Fig. 1c shows the statistical distribution of the lateral dimensions of the 200 exposed surfaces in the scanning electron microscopy image of the sample in Fig. 1b, showing that the average diameter of the sample is ∼2.0 μm.
0] directions.15,24 In this work, most of the copper oxalate crystals in the reaction mixture without the addition of CTAB were square-like particles, and a small portion maintained the typical mat-like morphology of copper oxalate, but both of them had a distinctive pit on the face (Fig. 1b). Performing a careful observation, it can be found that these pits are always positioned in the central region of the raised surface of the copper oxalate nanostructures, which may be due to the smaller size of the nanocrystals located in the central part of the polycrystalline particles. The solubility increases exponentially as the crystal size decreases. When the synthesized copper oxalate particles are exposed to the H2O2 solution environment, the raised surface centres with higher solubility will be etched first, resulting in the formation of surface pit structures.14 Fig. 1c shows the statistical distribution of the lateral dimensions of the 200 exposed surfaces in the scanning electron microscopy image of the sample in Fig. 1b, showing that the average diameter of the sample is ∼2.0 μm.
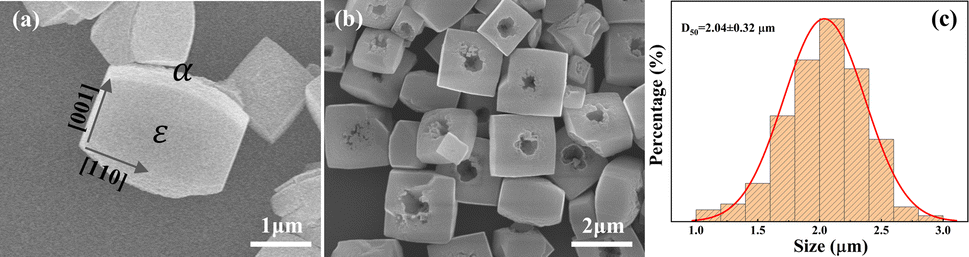 | ||
| Fig. 1 (a) Typical SEM morphology of copper oxalate crystals obtained based upon the conventional synthesis method; (b) SEM image of copper oxalate crystals prepared using L-ascorbic acid acting as a source of oxalate ligand without the addition of CTAB; (c) histogram of lateral dimensions of copper oxalate crystals in (b). | ||
When CTAB was added to the reaction mixture, the morphology of the copper oxalate samples changed dramatically, and even very dilute concentrations of CTAB had a considerable effect. For example, when adding a low concentration of CTAB of 0.1 g L−1, the copper oxalate samples have been transformed from three-dimensional square-like particles to two-dimensional lenticular particles, and the pits present in the centre of the particles have been transformed to shallow pits, and even in the centre of some of the samples, only a rough and loose surface can be observed (Fig. 2a). This transformation indicates that in the presence of CTAB, the native nanocrystals along the α–α direction is inhibited and the growth process is preferentially assembled along the ε–ε facets. This behaviour results in α–α radial expansion of the face area, while the ε-face area decreases.28 However, it may be due to the fact that the content of CTAB is too low at this time, which leads to the inhibition degree difference of the particle α–α direction growth, some particles α faces thus had more defects. When the CTAB concentration was further increased up to 1 g L−1, the particle morphology was clearer, and the α face extension process ended with the ε-face being confined to the edge of the material particles, and copper oxalate particles with a two-dimensional morphology were obtained (Fig. 2b), and α–α face defects disappeared and particle became thinner and wider. And when the CTAB concentration came to 5 g L−1, the α face of copper oxalate particles became smoother, and the radial average diameter of the particles further increased to about 4 μm, but the corresponding morphology was damaged, and some of the particles of the α face became smoother, and some of the particles α–α direction appeared right angles, some particles formed rectangular slices, and the dispersion of the particles became worse. The above results indicate that the addition of CTAB during the reaction process significantly affected the morphology and size of the copper oxalate products, and to a certain extent was able to inhibit the centre dissolution on the surface of copper oxalate crystals.
 | ||
| Fig. 2 SEM images of copper oxalate crystals with different CTAB additions: (a) CTAB = 0.1 g L; (b) CTAB = 1 g L; (c) CTAB = 5 g L−1. | ||
The powder samples without CTAB addition and with CTAB addition of 1 g L−1 were then analysed by XRD and the results are shown in Fig. 3a. Both samples had orthorhombic crystal structures with Pmnn space groups and the measured cell parameters were a = 5.403 Å, b = 5.571 Å and c = 2.546 Å, which were in agreement with the literature values of copper oxalate crystals (JCPDS: 21-0297).29 Since the copper oxalate hydrates synthesized by different methods contain different water contents, the sample d-spacing and peak intensities will deviate slightly from the standard card as the scanning angle increases.27 The average grain size of the samples was estimated from the half-height width of the (110) peak using Scherrer's equation, with values of 48 nm and 40 nm, respectively. The crystal size is very small compared to the micrometeor-sized particles obtained, indicating that all the samples are polycrystalline. This is in agreement with the results of a previous study.24 In addition, the grain sizes of the precipitated phases with and without additives were very similar, indicating that CTAB had no effect on the grain size, but the morphology changed significantly.24 Also, the yields of both precipitated powders were about 80–85% of the theoretical predictions, indicating that the presence and absence of CTAB had no effect on the size and number of crystals, and that CTAB did not affect the nucleation and growth of crystals, but rather the self-assembly and aggregation processes. Further XRD tests were performed on samples at 5 min intervals during copper oxalate synthesis (without added CTAB) as shown in Fig. S1.† During the first 10 min, the intensity of the diffraction peaks of copper oxalate crystals gradually increased with time, indicating that the nucleation, growth, and assembly processes of copper oxalate crystals mainly occurred at this stage. In the second 20 min of the reaction, the intensity of the diffraction peaks of copper oxalate crystals did not change much, which mainly involved some minor changes in the morphology of copper oxalate crystals. The amount of water of crystallization in the copper oxalate particles was estimated by TG measurements (Fig. 3b). The TG results showed that the total weight loss of copper oxalate and CTAB were 58.86% and 61.14%, respectively, corresponding to x-values of 0.197 and 0.704, respectively.12,18
 | ||
| Fig. 3 (a) XRD pattern of copper oxalate crystals. (b) TG curves of copper oxalate crystals. | ||
The morphology and microstructure of the samples with CTAB addition of 1 g L−1 were further characterized by TEM. The copper oxalate particles showed a small gradual increase in thickness from the edge to the centre, displaying a typical two-dimensional morphology (Fig. 4a). Fig. 4b shows the electron diffraction pattern of the red-marked portion of the a-plot. The diffraction rings indicate a random orientation between the crystals. The calibration of the diffraction rings indicates that the direction of electron beam incidence is in the [001] direction and the surface perpendicular to the electron beam is the (001) face, confirming that the two-dimensional copper oxalate particles are exposed on the α face. A further TEM image captures the randomly arranged primary nanocrystals at the edges of the copper oxalate particles (Fig. 4c). The random lattice striations of neighboring subcrystals in Fig. 4d indicate that the subcrystals are randomly attached. These results invariably indicate a random self-assembly process occurring at the edges of copper oxalate, which is slightly different from previous studies. In addition, such polycrystalline particles assembled by subcrystalline random attachment contain more defects than those assembled by subcrystalline directional attachment. Therefore, when the amount of CTAB is not enough to completely coat the α face of copper oxalate (CTAB = 0.1 g L−1), the uncoated edges will be more easily etched by H2O2 in the solution system, resulting in the formation of defects as shown in Fig. 2a.
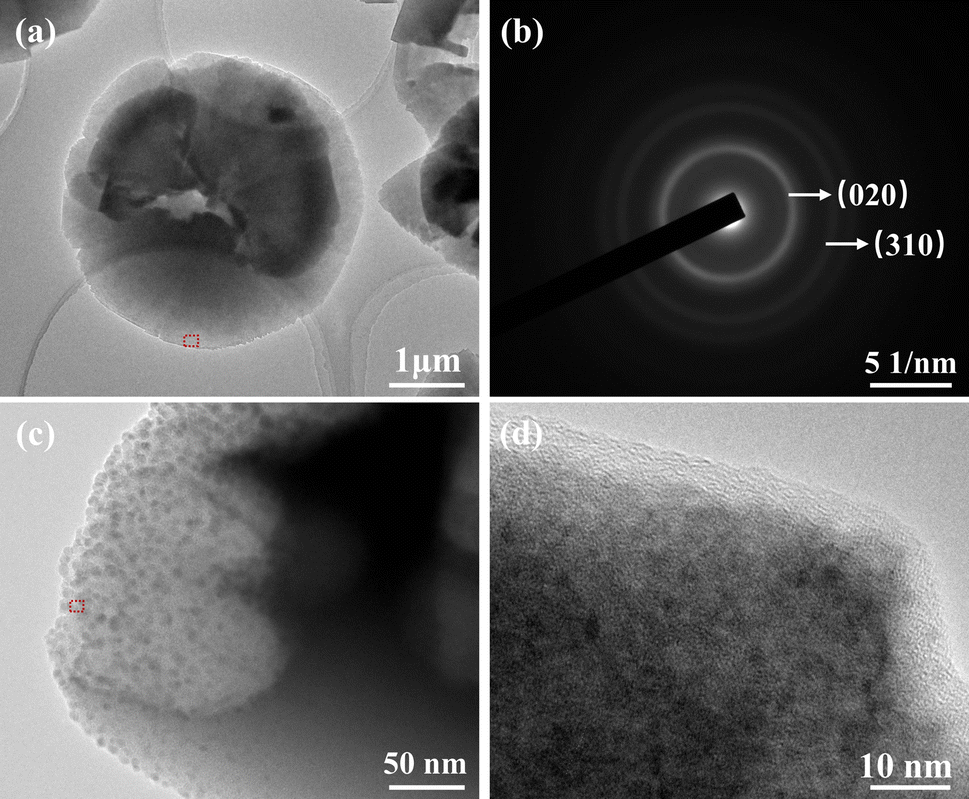 | ||
| Fig. 4 Typical TEM morphology of (a) copper oxalate crystals at CTAB addition of 1 g L−1; (b) selected electron diffraction pattern of the red-marked part in (a); (c) localized TEM image of copper oxalate crystals; (d) HRTEM image of the red-marked part in (c). | ||
In order to understand the effect of CTAB on the functional groups and chemical bonds in the structure of copper oxalate, FTIR analysis of copper oxalate powder without CTAB and with CTAB addition of 1 g L−1 was performed and the results are shown in Fig. 5a. The characteristic peak at 3582 cm−1 of the sample was attributed to the stretching vibration of the –OH bond,21 which was significantly broadened after the addition of CTAB, probably due to the increase in the water content of the copper oxalate particles prepared in the presence of CTAB, and the hydroxyl group binding effect formed the broad peak. The characteristic peak near 2970 cm−1 was attributed to the stretching vibration of the C–H bond,30 and the broad peaks at 1360 cm−1, 1317 cm−1, 819 cm−1 and 485 cm−1 correspond to the asymmetric stretching vibration of the C–O bond, symmetric stretching vibration of the C–O bond, bending vibration of the O–C![[double bond, length as m-dash]](https://www.rsc.org/images/entities/char_e001.gif) O bond and stretching vibration of the Cu–O bond, respectively.30–32 The strong band appearing near 1610 cm−1 is attributed to the characteristic absorption of the asymmetric stretching vibration of the CO bond of CuC2O4 particles,33 and the relative intensity of this characteristic peak is significantly reduced by the addition of CTAB. The main vibrational modes of pure CTAB (2916 and 2848 cm−1) are not visible in the figure. This feature suggests that either no additive was present in the copper oxalate additive samples due to the post-synthesis washing step, or the amount of additive was too low to be observed here. For this reason, another Raman analysis was performed on the same sample as shown in Fig. 5b. The characteristic peak at 210 cm−1 is attributed to the lattice vibration of copper oxalate, the characteristic peaks near 560 cm−1 are attributed to the stretching of Cu–O and C–C bonds, the characteristic peaks at 832 and 923 cm−1 are attributed to the stretching and deformation vibration of the CO bond, and the characteristic peaks at 1488 cm−1 and 1516 cm−1 correspond to the symmetric and antisymmetric stretching vibrations of C–O bonds, respectively.23,32 The addition of CTAB did not significantly change the vibrational properties of copper oxalate, which suggests that the additive only alters the self-assembly of copper oxalate nanocrystals without altering its internal structure. However, it is interesting to note that the bands observed at 1488 and 1516 cm−1 belonging to the C–O stretching vibrations are closer to those of natural copper oxalate (1489 and 1514 cm−1, respectively).22
O bond and stretching vibration of the Cu–O bond, respectively.30–32 The strong band appearing near 1610 cm−1 is attributed to the characteristic absorption of the asymmetric stretching vibration of the CO bond of CuC2O4 particles,33 and the relative intensity of this characteristic peak is significantly reduced by the addition of CTAB. The main vibrational modes of pure CTAB (2916 and 2848 cm−1) are not visible in the figure. This feature suggests that either no additive was present in the copper oxalate additive samples due to the post-synthesis washing step, or the amount of additive was too low to be observed here. For this reason, another Raman analysis was performed on the same sample as shown in Fig. 5b. The characteristic peak at 210 cm−1 is attributed to the lattice vibration of copper oxalate, the characteristic peaks near 560 cm−1 are attributed to the stretching of Cu–O and C–C bonds, the characteristic peaks at 832 and 923 cm−1 are attributed to the stretching and deformation vibration of the CO bond, and the characteristic peaks at 1488 cm−1 and 1516 cm−1 correspond to the symmetric and antisymmetric stretching vibrations of C–O bonds, respectively.23,32 The addition of CTAB did not significantly change the vibrational properties of copper oxalate, which suggests that the additive only alters the self-assembly of copper oxalate nanocrystals without altering its internal structure. However, it is interesting to note that the bands observed at 1488 and 1516 cm−1 belonging to the C–O stretching vibrations are closer to those of natural copper oxalate (1489 and 1514 cm−1, respectively).22
 | ||
| Fig. 5 (a) Infrared spectrum of copper oxalate crystals; (b) Raman spectrum of copper oxalate crystals. | ||
The chemical state of the surface of copper oxalate crystals was further investigated using XPS (Fig. 6). For the sample with a CTAB addition of 1 g L−1, only three elements, C, O and Cu, were detected on the sample surface, and the element N, which belongs to CTAB alone, was not detected, which once again indicated that the added CTAB had been removed during the washing process (Fig. 6a). The C 1s spectrum of copper oxalate showed a typical bimodal structure (Fig. 6b). In the fitting of the C 1s spectra, the peak with the lowest binding energy (BE) was attributed to the C–C bond of the non-fixed carbon and served as a reference for the BE charge correction of the other peaks (set to 284.8 eV). The peak at 286.3 eV is attributed to a C–O bond, which simultaneously indicates that copper oxalate is contaminated with organic matter.34 The peak with the highest intensity at 289.2 eV corresponds to C2O42− in the coordination polymer. The O 1s spectral line of copper oxalate can be back-convoluted into three peaks (Fig. 6c). The largest spectral peak located at 532.6 eV corresponds to C2O42−, a small peak at 531.3 eV indicates the presence of Cu–O bonds, and another small peak at 533.9 eV is often corresponded to adsorbed water.35 On the high BE side of the Cu 2p main line, the two spectral peaks located at 945.28 and 941.7 eV are satellite peaks of Cu2+, which is typical of high-spin Me2+ compounds [27]. Whereas, the spectral peaks located at 935.90 eV and 955.06 eV correspond to Cu 2p3/2 and Cu 2p1/2, respectively [50], which indicates that the valence state of Cu is +2 (Fig. 6d).2,30,36
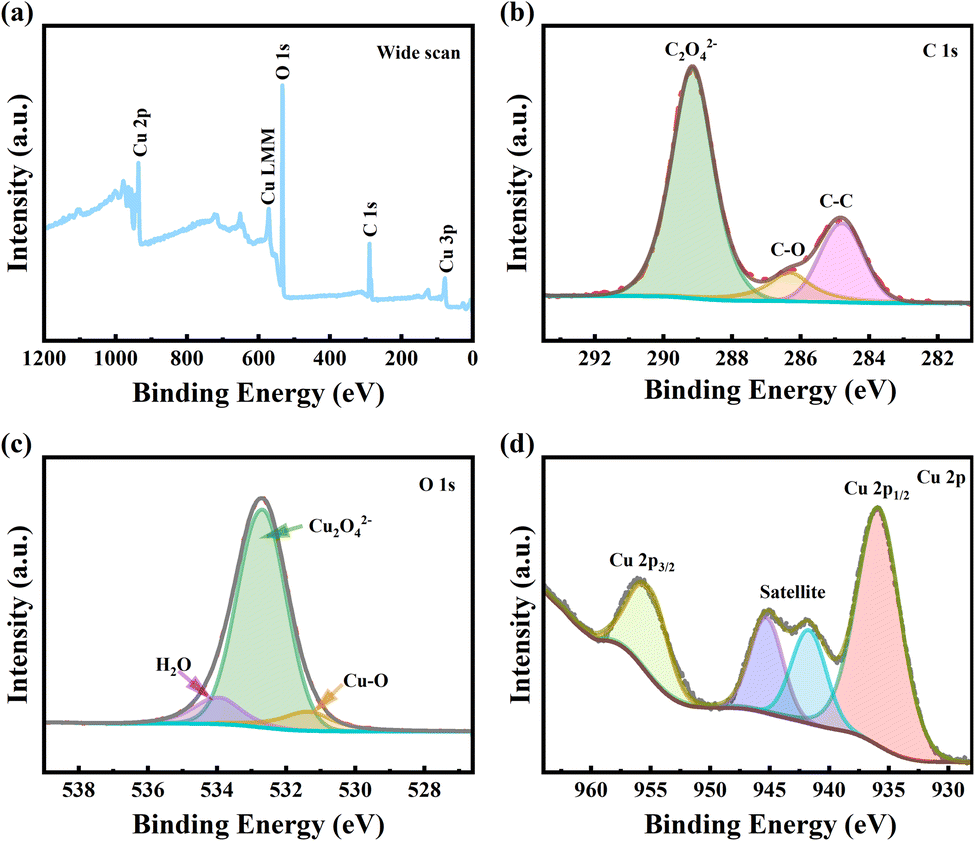 | ||
| Fig. 6 XPS spectra of copper oxalate crystals at CTAB addition of 1 g L−1. (a) Full spectrum scan (b) C 1s (c) O 1s (d) Cu 2p. | ||
In order to confirm that oxalic acid comes from the oxidative decomposition of L-AA and there is no Cu2+ involved in the process,37 we tested the oxidized L-AA solution by H2O2 using high performance liquid chromatography (HPLC). The elution profiles of different concentrations of oxalic acid standards using Acclaim Organic Acid LC liquid column and HPLC are shown in Fig. 7. Under the method of this experiment (see ESI S8† for details), the elution time of standard oxalic acid was within 3.6–3.7 min. The linear regression equation of the standard curve was y = 0.1491x with a correlation coefficient (R) value of 0.9991. According to Coelho et al., the R value of the calibration curve must be greater than 0.99,38 which verifies that the linearity of the response to the external standard obtained in this study is sufficient for the intended purpose. Plot of the sample in Fig. 7 shows the chromatogram of the experimental sample after 50-fold dilution. Oxalic acid was identified at a retention time of 3.87 min, which was confirmed by comparison with the peak of the oxalic acid standard.39–41
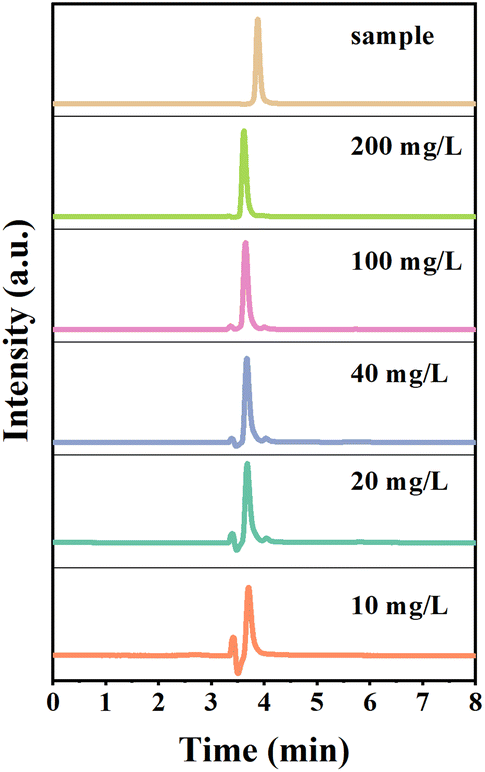 | ||
| Fig. 7 Elution profile of oxalic acid standard on Acclaim Organic Acid LC liquid phase column and elution profile of L-ascorbic acid oxidation product on Acclaim Organic Acid LC liquid phase column. | ||
The anisotropy of the copper oxalate crystal structure in the presence of CTAB is one of the key factors affecting the self-assembly of the crystals. The copper oxalate crystals are orthorhombic structures formed by the band stacking of Cu(C2O4)Cu(C2O4), which is characterized by the fact that the four oxygen atoms on the same band are simultaneously coordinated to the centrally located copper ions, and the two oxygen atoms on the upper and lower bands are also coordinated to the copper ions. In addition, the band axes of the copper oxalate crystals are aligned with the [001] direction.15 From the structure of copper oxalate, it can be predicted that of the two types of crystal surfaces induced by copper oxalate singlets, the termination groups on the α face are likely to be oxalate groups from the charged complex ([CuC2O4]2−), and thus the α face has more polar termini and a higher interfacial energy. The ε face, on the other hand, does not contain free O–CC–O bonds and is less polar due to the small electronegativity difference between C and O.15,24 The ε face has more polar ends and a higher interfacial energy. In the absence of CTAB addition, the prepared copper oxalate particles showed a square-like shape. The particles got more growth in the α–α direction compared to the typical mat-like morphology. The extremely negative zeta potential (−38 eV) of the sample at this point coincides with this analysis (Fig. S7a†). We conclude that copper oxalate nanocrystals tend to assemble in the a-face without the addition of CTAB. This reduces the interfacial energy of the system to minimize the total energy of the system. When the cationic surfactant CTAB was added, the zeta potential of the copper oxalate samples was observed to decrease to −16.1 mV (Fig. S7b†). And the TEM results indicated that the surface of copper oxalate was dominated by the α-face at this time (Fig. 4b). This indicates that after the addition of CTAB, during the assembly of copper oxalate nanocrystals, the polar head group (ammonium ion) of the CTAB molecule interacts with the oxalic acid groups on the α face of the copper oxalate particles, inhibiting the growth of the nanocrystals along the α–α direction, which makes the growth in the ε–ε direction the most energetically favourable pathway, resulting in the formation of two-dimensional cake-like copper oxalate particles (Fig. 8).
 | ||
| Fig. 8 Schematic diagram of copper oxalate precipitation. Effect of CTAB on the assembly process of copper oxalate nanocrystals. | ||
Conclusions
The rapid green synthesis of square-like copper oxalate particles in liquid phase at room temperature and pressure using ascorbic acid as a source of oxalic acid ligand was investigated. When cetyltrimethylammonium bromide (CTAB) was used as an additive, the copper oxalate particles showed morphological changes from three-dimensional square-like to two-dimensional disk-like. The test results showed that Cu2+ did not participate in the oxidative decomposition of ascorbic acid, but directly precipitated with oxalate ions generated by oxidation to form copper oxalate nanocrystals, and during the subsequent self-assembly process, CTAB inhibited the self-assembly of the crystals along the [001] direction by interacting with the crystal surfaces, resulting in a high degree of control over the morphology of the copper oxalate particles.Data availability
Data will be made available on request.Author contributions
Bo Shen: conceptualization; investigation; methods; data organization and analysis, writing-original draft; writing-review and editing. Zhengqiu Chen: data organization and analysis; writing-original draft. Huaming Mao: survey; data organization. Jungang Yin: data analysis. Yu Ren: survey. Wei Dai: data organization. Shuanglong Zhao: data analysis. Hongwei Yang: project management; writing-review and editing.Conflicts of interest
The corresponding author on behalf of all the authors declares no potential conflict of interest.Acknowledgements
This work was supported by Major R&D Project of Yunnan Province (grant no. 202002AB080001-1-10, 202102AB080008-5), Ten Thousand Talents Plan-Young Top Talent Program of Yunnan Province (2019020001), and Yunnan Precious Metals Laboratory Science and Technology Planning Project (YPML-2022050201).Notes and references
- Q. He, H. Wang, X. Zhao and L. Chen, Mater. Today Chem., 2021, 22, 100564 CrossRef CAS.
- S. Chenakin and N. Kruse, Appl. Surf. Sci., 2020, 515, 146041 CAS.
- G. M. Gadd, J. Bahri-Esfahani, Q. Li, Y. J. Rhee, Z. Wei, M. Fomina and X. Liang, Fungal Biol. Rev., 2014, 28, 36–55 CrossRef.
- E. J. Baran, Geochemistry, 2016, 76, 449–460 CrossRef CAS.
- J. S. Yeoh, C. F. Armer and A. Lowe, Mater. Today Energy, 2018, 9, 198–222 CrossRef.
- G. Singh, I. P. S. Kapoor, R. Dubey and P. Srivastava, J. Alloys Compd., 2012, 513, 499–505 CrossRef CAS.
- Z. Jia, L. Yue, Y. Zheng and Z. Xu, Mater. Res. Bull., 2008, 43, 2434–2440 CrossRef CAS.
- A. Aimable, A. Torres Puentes and P. Bowen, Powder Technol., 2011, 208, 467–471 CrossRef CAS.
- M. Rahimi-Nasrabadi, S. M. Pourmortazavi, A. A. Davoudi-Dehaghani, S. S. Hajimirsadeghi and M. M. Zahedi, CrystEngComm, 2013, 15, 4077–4086 RSC.
- F. Behnoudnia and H. Dehghani, Polyhedron, 2013, 56, 102–108 CrossRef CAS.
- M. J. Aragón, B. León, C. Pérez Vicente and J. L. Tirado, J. Power Sources, 2009, 189, 823–827 CrossRef.
- Z. Qi, Y. Wu, X. Li, Y. Qu, Y. Yang and D. Mei, Ionics, 2019, 26, 33–42 CrossRef.
- X. Liu, X. Chen and K. Huang, Int. J. Miner. Metall. Mater., 2019, 26, 460–466 CrossRef CAS.
- X. Zhao and J. Yu, J. Cryst. Growth, 2007, 306, 366–372 CrossRef CAS.
- N. Jongen, P. Bowen, J. Lemaître, J.-C. Valmalette and H. Hofmann, J. Colloid Interface Sci., 2000, 226, 189–198 CrossRef CAS.
- Y.-Q. Fan, C.-F. Zhang, J.-H. Wu, J. Zhan and P. Yang, Trans. Nonferrous Met. Soc. China, 2010, 20, 165–170 CrossRef CAS.
- K. Shah, K. Gupta and B. Sengupta, Powder Technol., 2020, 366, 230–238 CrossRef CAS.
- W. Kang and Q. Shen, J. Power Sources, 2013, 238, 203–209 CrossRef CAS.
- N. Liang, W. Lei, S. Bing, W. Yinjue, Z. Wenli, W. Chao and J. Yong, Mater. Lett., 2009, 63, 2560–2563 CrossRef.
- M.-Y. Li, W.-S. Dong, C.-L. Liu, Z. Liu and F.-Q. Lin, J. Cryst. Growth, 2008, 310, 4628–4634 CrossRef CAS.
- X. Chen, K. Huang and C.-y. Wang, Int. J. Miner. Metall. Mater., 2018, 25, 762–769 CrossRef CAS.
- J. Romann, V. Chevallier, A. Merlen and J.-C. Valmalette, J. Phys. Chem. C, 2009, 5068–5074 CrossRef CAS.
- J. Romann, J.-C. Valmalette, V. Chevallier and A. Merlen, J. Phys. Chem. C, 2010, 114, 10677–10682 CrossRef CAS.
- P. Bowen, O. Pujol, N. Jongen, J. Lemaître, A. Fink, P. Stadleman and H. Hofmann, Nanoscale, 2010, 2, 2470–2477 CAS.
- N. Oberg, T. W. Precord, D. A. Mitchell and J. A. Gerlt, ACS Bio Med Chem Au, 2021, 2, 22–35 Search PubMed.
- Y. Guo, K. Shen, X. Zhang and H. Huang, Biochem. Biophys. Res. Commun., 2024, 695, 149440 CrossRef CAS PubMed.
- X.-L. Zhou, Z.-G. Yan and X.-D. Han, Mater. Lett., 2014, 118, 39–42 CrossRef CAS.
- L. Cristina Soare, P. Bowen, J. Lemaitre and a. H. Hofmann, J. Phys. Chem. B, 2006, 110, 17763–17771 CrossRef PubMed.
- C. Zhou, A. Zhao, J. Cheng, K. Hou, P. Pi, X. Wen and S. Xu, Mater. Lett., 2016, 185, 403–406 CrossRef CAS.
- Y. Liu, H. He, T.-J. Zhang, T. C. Zhang, Y. Wang and S. Yuan, J. Hazard. Mater., 2023, 451, 131142 CrossRef CAS PubMed.
- G. Wu, J. Xiao, M. Yılmaz, T. C. Zhang and S. Yuan, J. Environ. Chem. Eng., 2023, 11, 109466 CrossRef CAS.
- R. L. Frost, Y. A. N. G. Jing and Z. Ding, Chin. Sci. Bull., 2003, 48, 1844–1852 CrossRef CAS.
- I. u. Haq and F. Haider, Mater. Lett., 2009, 63, 2355–2357 CrossRef.
- J. Pu, Z. Huang, C. Wu, S. Liu, S. Liu, X. Liu, L. You, Q. Wang, Y. Zheng, R. Zeng and J. Liu, Energy Storage Mater., 2024, 67, 103304 CrossRef.
- X. Liu, R. Wang, S. Liu, J. Pu, H. Xie, M. Wu, D. Liu, Y. Li and J. Liu, Adv. Energy Mater., 2023, 13, 2302987 CrossRef CAS.
- H. He, T. C. Zhang, Z. Li, Y. Liang and S. Yuan, Colloids Surf., A, 2021, 627, 127133 CrossRef CAS.
- F. Khamespanah, M. Marx, D. B. Crochet, U. R. Pokharel, F. R. Fronczek, A. W. Maverick and M. Beller, Nat. Commun., 2021, 12, 6883 CrossRef.
- E. M. Coelho, C. V. da Silva Padilha, G. A. Miskinis, A. G. B. de Sá, G. E. Pereira, L. C. de Azevêdo and M. dos Santos Lima, J. Food Compos. Anal., 2018, 66, 160–167 CrossRef CAS.
- E. E. Moros, D. Darnoko, M. Cheryan, E. G. Perkins and A. J. Jerrell, J. Agric. Food Chem., 2002, 50, 5787–5790 CrossRef CAS PubMed.
- R. J. Bushway, J. L. Bureau and A. D. F. Mcgann, J. Food Sci., 1984, 49, 75–77 CAS.
- I. C. W. Wilson, P. E. Shaw and J. R. J. Knight, J. Agric. Food Chem., 1982, 30, 1106–1108 CrossRef.
Footnote |
| † Electronic supplementary information (ESI) available. See DOI: https://doi.org/10.1039/d4ra04181j |
| This journal is © The Royal Society of Chemistry 2024 |