 Open Access Article
Creative Commons Attribution 3.0 Unported Licence
The effects of oxygen flow ratio on the properties of AgxO thin films grown by radio frequency magnetron sputtering †
Xiaojiao Liu *a,
Tatsuya Yasuokaa,
Giang T. Dangbc,
Li Liubc and
Toshiyuki Kawaharamura*abc
aEngineering Course, Graduate School of Engineering, Kochi University of Technology, 185 Miyanokuchi, Tosayamada, Kami, Kochi, 782-8502, Japan. E-mail: 248009y@gs.kochi-tech.ac.jp; kawaharamura.toshiyuki@kochi-tech.ac.jp; Tel: +81-887-57-2703
bSchool of Systems Engineering, Kochi University of Technology, 185 Miyanokuchi, Tosayamada, Kami, Kochi, 782-8502, Japan
cCenter for Nanotechnology, Research Institute, Kochi University of Technology, 185 Miyanokuchi, Tosayamada, Kami, Kochi, 782-8502, Japan
First published on 23rd July 2024
Abstract
The AgxO thin film with various oxygen flow ratios (R[O2]%) deposited by radio frequency magnetron sputtering (RFM-SPT) has been studied. While adjusting R[O2]% from 0% to 30%, the AgxO thin film transitioned from metal to semiconductor and/or insulator with different transparent appearances on the surface observed using X-ray diffraction (XRD) and transmittance measurement. At high oxygen flow ratios, the AgxO film is multi-phased as a mixture of Ag(II)O and Ag2(III)O3. In addition, the work function (ϕ) of those samples changes from 4.7 eV to 5.6 eV as measured by photoelectron yield spectroscopy (PYS). The compositional and chemical state changes that occur at the AgxO surface during the increments of R[O2]% are evaluated by the relative peak intensities and binding energy shifts in X-ray photoelectron spectroscopy (XPS). With the incorporation of more electrons in chemical bonding, the oxygen-induced band forms. And combining all the results from transmittance (band gap confirmation), PYS (work function confirmation), and XPS (valence band position confirmation), the estimated band diagrams are given for the oxidation state of AgxO with various oxygen flow ratios.
1. Introduction
Oxide-based thin film properties are highly beneficial in various technological applications including transparent conductive films, gas sensors, LEDs, transparent electronic devices, and solar cells, among others. Thus, to obtain the adjustable properties of semiconductor materials, precise control of the extent of oxidation of thin film during the synthesis process is important for the electronics industry.1–3According to previous investigations, silver oxide (AgxO) is a transparent material in wavelengths ranging from the infrared region to the visible region with an optical band gap in the range of 1.2–3.1 eV. Whereas, silver (Ag) is a good reflective coating for applications in the optoelectrical field,4 AgxO is preferable for use in battery electrodes as it performs better in voltage regulation and enhances storage life.5,6 The work function can reach roughly 5.3 eV with O2 plasma or UV-ozone treatment of Ag anodes.7,8 In particular, Ag2O films in general are reported to show p-type semiconducting properties.9–11 AgxO has attracted attention as an air electrode in fuel cells and metal–air batteries because of its relatively low Ag–O bonding energy (221 kJ mol−1)12–17 enabling it to interact with oxygen reactants and their intermediates without excessively covering the catalyst surface. However, previous studies7,18 have revealed that the instability of AgxO resulting from heating is in the transition of its composition, crystallinity, refractive index, and other properties. Furthermore, silver oxides (AgO, Ag2O) desorb oxygen at low temperatures (∼200 °C),18 in consequence, a low-temperature film fabrication process is required to form AgxO thin films.
Sophisticated growth methods for Ag or AgxO thin film depositions are well developed, including chemical bath deposition (CBD),10 dry chemical route at room temperature,11 electron beam (EB) evaporation,18,19 microwave sputtering,20 and DC magnetron sputtering.21–24 In addition, partially oxidized AgxO films grown via reactive sputtering were applied for the fabrication of AgxO/ZnO Schottky diodes (SBDs),25 AgxO/α-Ga2O3 metal semiconductor field effect transistor (MESFET),26 AgxO/IGZO SBDs,27 and AgxO/ZnMgO Heterojunction diodes (HJDs).28 Those applications of AgxO thin films were proven to improve the barrier height in the interface region of the heterojunction. Indeed, the reactive oxygen might have the capacity to provide O-rich ambient healing of the interface defects or states, for during the sputtering deposition process Ag ion/plasma would combine with reactive oxygen (oxygen plasma, oxygen radicals). Hence, the purpose of this work is to investigate different oxygen flow ratios of R[O2]% = [O2/(O2 + Ar)]% effects on the AgxO film properties grown by the radio frequency magnetron sputtering (RFM-SPT) deposition method.
2. Experimental methods
Ag and AgxO films were deposited at room temperature (RT) on quartz substrates which were placed vertically above the Ag target (99.99% purity, 3 inches in diameter) at an appropriate distance of 20 cm by introducing the excited gas mixture of Ar without/with O2 via a radio frequency magnetron sputtering (RFM-SPT) deposition system. Prior to the film deposition, the reaction chamber was evacuated to a base pressure below 1 × 10⁻⁴ Pa. During film deposition, working pressure was maintained at 0.3 Pa. The total flow rate ([O2 + Ar]) was set at 10 sccm, and the oxygen flow ratio (R[O2]% = [O2/(O2 + Ar)]%) was changed from 0% to 30% while the power supply was fixed at 40 W, and the reflected power was controlled in the range of 0.5–1 W during the deposition process. Each quartz substrate was ultrasonically precleaned for 2 min in acetone, isopropyl alcohol, and deionized (D. I.) water, respectively, and was then dried using an N2 gas gun. Before checking the growth rate, the pretest sample preparation was operated for maintaining the chamber ambient and also for removing the top oxidized layer of the Ag target, after which the thin film with target thickness was prepared accordingly. Details of the deposition conditions are summarized in Table 1.| Target | R[O2] (%) | Pressure (Pa) | Power (W) | Thickness (nm) | Growth time (min) |
|---|---|---|---|---|---|
| Ag | 0–30 | ∼0.3 | 40 | 50 | ≅5 |
| 150 | ≅20 |
The crystal structure was analyzed by grazing incident X-ray diffraction (GIXD) spectra using CuKα radiation (Rigaku Corp., Smart Lab, X-ray wavelength λ = 1.5418 Å, incident angle 0.35°). When specifying the material, information on each crystal was obtained from the works of literature,29–34 the angle at which the specific X-ray diffraction of Cu was determined, and the measurement results were compared with the theoretical diffraction angle, identifying the material. The thickness of the obtained coatings was measured by a step profiler in advance of the growth rate checking, and after that, the formal deposition with target thickness was operated. The surface morphology was characterized by scanning electron microscopy (SEM) (Hitachi SU8020) with an acceleration voltage of 5 to 15 keV. The optical transmittance of Ag and AgxO films was measured in the range from 200 nm to 2500 nm using a UV-visible spectrometer (Hitachi UV-vis U-4100). Afterward, the band gaps were calculated and confirmed by the Tauc plot. The Tauc plot was built on the data extracted from the transformation of transmittance spectra into absorption spectra. The resistances were measured by the resistivity measuring system (MITSUBISHI Chemical Corp., Hiresta-Up MCP-HT450). The work function of 150 nm thick Ag and AgxO films on the quartz substrate was determined by photoelectron yield spectroscopy (PYS) (BUNKOUKEIKI Corp., BIP-KV202GD/UVT) in a vacuum at room temperature. X-ray photoelectron spectroscopy (XPS) (Ulvac-Phi ESCA 5500 A) was used to investigate the chemical states of Ag and AgxO films, and a monochromic Al Kα (1486.6 eV) X-ray source was operated at 96 W and 12 kV at room temperature below 3.0 × 10⁻⁸ Pa. The binding energies in the XPS spectra were calibrated by the peak position of C 1s spectra appearing at 284.8 eV for adventitious carbon surface contamination.35
3. Results and discussion
Under vacuum ambient, AgxO films were deposited on quartz in various oxygen flow ratios (R[O2]%). Photos showing the appearance of AgxO, which had lengthy exposure to the atmosphere and was put on top of the illuminated screen, are shown in Fig. 1 (a) 150 nm and (b) 50 nm. At the same light illumination, AgxO samples present different transparency colors, for the increment of R[O2]%. The color-changing tendency is the same for 150 nm and 50 nm films. More remarkable changes could be seen in (a) 150 nm samples; as AgxO film with R[O2]% = 0% presented a silvery metallic color and 10% showed a brown dark color blocking light from passing through. But after increasing R[O2]% from 16% to 30%, all the AgxO films showed lighter brown-grey colors except for R[O2]% = 17% which presented a yellow color. It can be seen that the appearance changes significantly in relation to the flow ratio of oxygen (the change of x value), and the color-changing tendency follows in 4 categories of oxygen flow ratio: 0%, 10%, below 17%, and above 17%.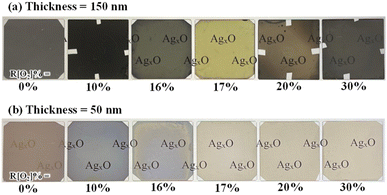 | ||
| Fig. 1 AgxO samples appearance photos comparison with various R[O2]% (a) thickness is 150 nm (b) thickness is 50 nm. | ||
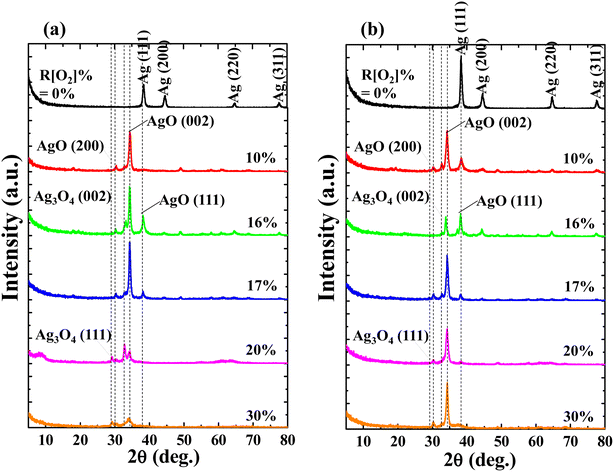
The influences of R[O2]% on crystal structure were investigated via GIXD spectra with the thickness of (a) 150 nm and (b) 50 nm as shown in Fig. 2. Focusing on the samples of R[O2]% = 0%, the Ag-related diffraction peaks are detected as: (111), (200), (220), and (311), respectively in both 150 nm and 50 nm thickness samples. The relative intensity of the Ag (111) diffraction peak is significantly higher than others. After introducing oxygen into the depositions, all the diffraction peaks of Ag were diminished. Ag cations started to bond with oxygen ions forming transparent AgxO films. For the low oxygen flow ratios of R[O2]% = 10% to 17%, the dominated diffraction peak at 2θ = 34.52° was confirmed as the representation of AgO (002) peak,36,37 and its intensity is properly proportional to the increment of R[O2]%. However, when R[O2]% exceeded 20%, the intensities of AgO (002) were reduced. On the other hand, the other two related AgO peaks of (200) and (111) were detected at 2θ = 30.2° and 38.3° from these measured samples. AgO (200) had a relatively weak signal with constant intensity, and the AgO (111) only presented as R[O2]% = 16% and 17% with decreased intensity. No Ag2O peaks were detected in these depositions.38–40 At the same time, another small shoulder-shaped diffraction peak adjacent to AgO (002) diffraction peak was determined as the Ag3O4 (002) diffraction peak41,42 without regular tendency of intensities of increment of R[O2]%. After R[O2]% increased to 20% and 30%, another related to the Ag3O4 diffraction peak (111) was presented at 2θ = 29° with weak constant intensity. Other studies43–45 have reported that the dissociation of Ag3O4 (2Ag3O4(s) → 6AgO(s) + O2(g)) readily happen even at room temperature, and Ag3O4 crystal grains end up as randomly distributed between the Ag(II)O and Ag2(III)O3. Thus at high R[O2]%, the AgxO grains are considered as a mixture of two or more individual oxides of Ag(II)O and Ag2(III)O3.37,46–48
In addition, comparing the samples with different thicknesses prepared at the same R[O2]%, it was found that the confirmed diffraction peaks appeared at the same 2θ position with slightly different intensities, but Ag3O4 (111) peak is not mainly presented in the 50 nm sample, and AgO (002) peak appeared as the dominant peak at any oxygen flow ratios.
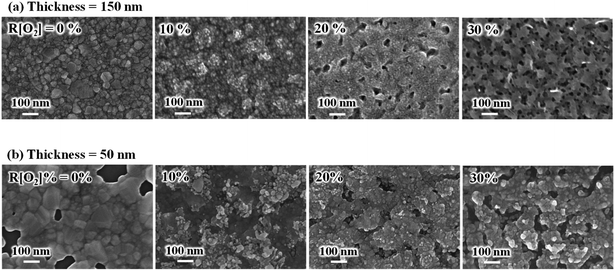
The surface morphology images of AgxO (a) 150 nm and (b) 50 nm are shown in Fig. 3. Without oxygen, the Ag films of both the 150 nm and 50 nm thickness samples showed good smooth top surfaces. After introducing oxygen, the grain shape presented a spherical grain morphology and the grain size became smaller, and the white color particles were characterized by a spherical grain morphology on top of the surface. In the meantime, we can see that the AgxO films become much looser and polyporous as the increment of R[O2]% from 20% to 30%, indicating that the surface relocation of silver atoms had increased and the 3-dimensional crystal growth formed at high oxygen flow ratios.
The variations in transmittance with the wavelength of different R[O2]% of 150 nm AgxO films are shown in Fig. 4(a). It can be seen that the transmittances between the R[O2]% of 10% and 16% increased in the longer wavelengths. The absorption edges were narrowly blue-shifted between R[O2]% of 10–17%, but after R[O2]% increased to 20% and 30% the transmittances were decent and the absorption edges were red-shifted in a certain range. The relation between the optical absorption coefficient α of a direct band gap (EG) semiconductor near the band edge and the photon energy hv is given by the following eqn (1):49,50
| αhv = A(hv − EG)1/2 | (1) |
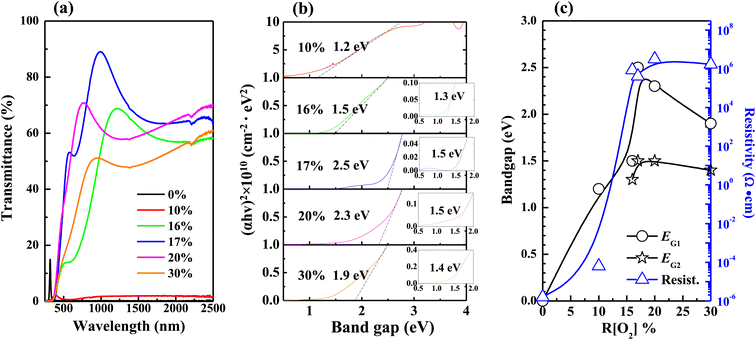 | ||
| Fig. 4 Variations in (a) transmittance (b) band gaps were extracted from the linear extrapolations of thickness 150 nm samples (c) band gaps and resistivity as a function of R[O2]%. | ||
Fig. 5 shows the optical properties of 50 nm AgxO films, which were more transparent from the observation of Fig. 1(b), thus they had higher transmittance with comparing 150 nm samples at the same R[O2]% as shown in Fig. 5(a). Band gaps of 50 nm samples could be precisely confirmed for its crystal structure tend to be dominated only by AgO (002) peak, and widened from 0.8 to 1.7 eV with increasing R[O2]% from 10% to 17%. Meanwhile, from Fig. 4(c) and 5(c) the observation is that the resistivity (ρ) reached the summit value as R[O2]% = 20% of 150 nm AgxO films: ρ = 3.2 × 10⁶ Ω·cm and as R[O2]% = 16% of 50 nm AgxO films: ρ = 2.2 × 10⁸ Ω·cm. The resistivity of 50 nm samples is 2 magnitudes higher than that of 150 nm samples. The band gap reached the summit value as R[O2]% = 17% of 150 nm AgxO films: EG = 2.5 eV and 1.5 eV, and as R[O2]% = 17% of 50 nm AgxO films: EG = 1.7 eV. These results might be interpreted as that after R[O2]% exceeded 17% provided O ions sufficiency ambient in terms of the formation of the higher chemical state of Ag cations, which in the case of 150 nm depositions of AgxO formed by sub-stabled Ag3O4 crystals.
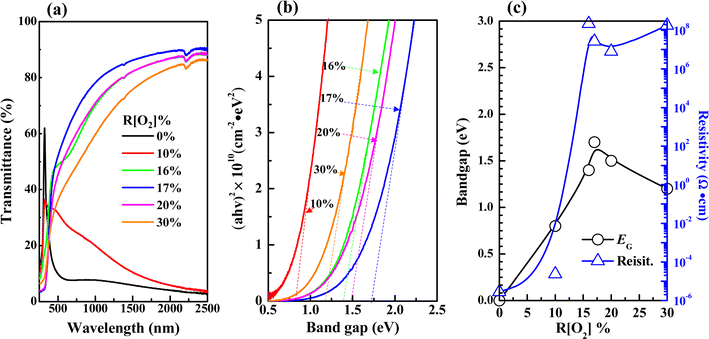 | ||
| Fig. 5 Variations in (a) transmittance (b) band gaps were extracted from the linear extrapolations of thickness 50 nm samples (c) band gaps and resistivity with different R[O2]%. | ||
Afterward, all the measurements and analyses were based on the 150 nm thickness AgxO sample. The variations in PYS spectra of AgxO films depending on the R[O2]% are presented in Fig. 6 (a) full scan range and (b) magnification of small range for determining the work function of Ag and the ionization energy of AgxO. The monochromatized photon from D2 (30 W) lamp is used as the excitation light. The density of yield photoelectrons (Y) of AgxO samples is detected by irradiated D2 light with incremental photon energy (hv) scan from 4 eV to 9.5 eV, which is thought to be proportional to the square root in the surface area of hv over the threshold ionization energy (Ith) which is equal to the energy difference E0 − EF for Ag, or E0 − Ev for AgxO, where E0 is vacuum level, EF is Fermi level, Ev is valence band energy. Ith was evaluated through the following equation Y ∝ (hv − Ith)1/2 (ref. 51 and 52) with plotting the hv versus Y1/2 spectra then by linear extrapolations of Y1/2.
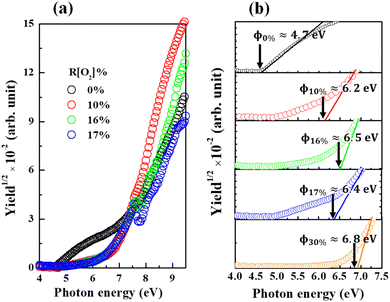 | ||
| Fig. 6 PYS spectra of AgxO films with various R[O2]% (a) full range (b) magnification of small range with linear extrapolation to determine work function. | ||
In the certain range of increasing R[O2]%, the ionization energy of AgxO tended to be high energy shifting of the spectra approaching R[O2]% = 10% obtained approximately 6.2 eV and by increasing R[O2]% to 16% shifted to 6.5 eV. However, when R[O2]% is 17%, the yield of photoelectrons was not monotonically increasing with increasing hv and the ionization energy seems to be shifted in the opposite direction reaching to 6.4 eV. This may be attributed to the highest resistivity of 17% AgxO sample with mere electrons so that the 0.1 seconds waiting time yielded a lower density of photoelectrons, and R[O2]% = 16% sample had similar abnormal data. And after R[O2]% increased to 30%, its ionization energy continued shifting to high energy at 6.8 eV and there was no abnormal behavior of the yield of photoelectron as R[O2]% = 30%.
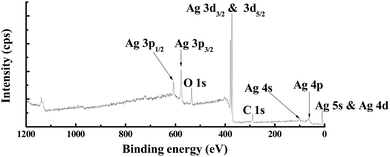
The XPS survey spectrum obtained from the R[O2]% = 17% of AgxO film is shown in Fig. 7. The major elements and the minor elements represent peaks in this survey spectrum including the Ag 2p, Ag 3d3/2, Ag 3d5/2, Ag 4s, and Ag 4p peaks, the O 1s peak and the C 1s peak, and the Ag 5s & Ag 4d peak. The specific information of C 1s, Ag 3d5/2 and O 1s spectra about the peak assignments and chemical species correspond to different Ag–O compounds with the comparison of the increment of R[O2]% from 0% to 30% obtained by examining the high-resolution XPS spectra are shown in Fig. 8(a–c), respectively. And on the right side of Fig. 8 is the normalized value.
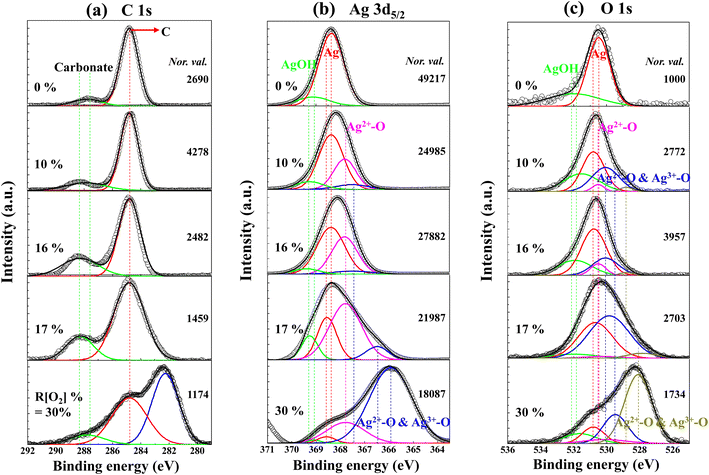 | ||
| Fig. 8 Measured HXPS data for (a) C 1s (b) Ag 3d5/2 (c) O 1s spectra of AgxO films with various R[O2]%. | ||
The binding energies are calibrated to the C 1s peak at 284.8 eV using charging correction and XPS analyzer techniques. Afterwards, the Ag 3d5/2, O 1s, and C 1s spectra were fitted with Gaussian curves. Referring to several previous published XPS studies for AgxO,53–58 the binding energies of C 1s, Ag 3d5/2 and O 1s photoelectrons associated with different silver compounds and their chemical shifting values of various R[O2]% are given in Tables 2 and 3.
| Peak assignment | C 1s |
|---|---|
| C-metal | 282.2 |
| C | 284.8 |
| Carbonate | 288.4 |
| Peak assignment | Ag 3d5/2 | O 1s |
|---|---|---|
| Ag3O4 | 366.2 | 528.5 |
| Ag3O4 | 367.5 | 530.2 |
| AgO | 367.7 | 530.5 |
| Ag | 368.4 | 530.5 |
| AgOH | 369.3 | 532 |
The C 1s spectra of AgxO films with various R[O2]% are shown in Fig. 8(a). There are two distinct peaks shown in these spectra of the assignments at 284.8 eV because of adsorbed hydrocarbons and at 288.4 ± 0.02 eV attributed to the surface carbonate.59–61 With increments of the R[O2]% from 0% to 30%, the peak positions were shifted by 1 eV towards the high energy direction from 287.4 eV to 288.4 eV, in the peaks of surface carbonate their intensities also increased with increasing R[O2]%. From the GIXD data, we determined that with the increments of R[O2]%, the dominant compositions of AgxO were presumably changed from Ag2+ to the mixture of randomly distributed Ag2+ and Ag3+. This may be caused by the surface Ag3+-adhered carbonate having higher binding energy than the surface Ag2+-adhered carbonate. However, for R[O2]% increment of 30%, the extraordinary peak appears as the third peak at 282.2 eV with significant intensity, which can be expected to be C–Ag bonds from previous studies.62,63
The Ag 3d5/2 and O 1s spectra of AgxO with various R[O2]% are shown in Fig. 8(b and c). While the R[O2]% = 0%, the binding energies of Ag thin film can be observed at 368.4 eV of Ag peak in Ag 3d5/2 and at 530.5 ± 0.02 eV of AgxO-related peak in the O 1s spectra. It is postulated that the AgxO-related peak obtained from the Ag metal sample may be caused by the influence of the oxidized layer on the surface during atmospheric exposure. As evidence, the intensity of the O 1s peaks of the metallic Ag thin film is less than that of the corresponding peaks in Ag 3d5/2. And there are small peaks present at the higher binding energy side of both Ag 3d5/2 and O 1s spectra corresponding to 368.9 eV and 532 eV, respectively. This might indicate the presence of hydroxy groups of AgOH and they are most likely formed by the absorption of H2O during exposure to air. However, AgOH is not stable above 228 K,53,57 so it may be impossible for AgOH to exist in this case but here we only focus on the surface area. Meanwhile, as the R[O2]% increased to 10% and 16%, in the Ag 3d5/2 spectra of Ag peaks intensities were reduced and the proportional increments of AgxO compound peaks appeared in comparison to R[O2]% = 0%. The binding energies of Ag 3d5/2 and O 1s were shifted to the lower binding energies within the increase in the oxidation state of Ag. Furthermore, we found that by intentionally increasing the R[O2]% from 16% to 17%, even increasing the R[O2]% by just one percent, the splitting peaks of the AgxO compound shifted further to the lower binding energies. From the observation of the Ag 3d5/2 spectrum of R[O2]% = 17% deposition, AgO dominates the fitting fragments of the Ag oxidation state. Whereas in the increase of R[O2]% = 30%, the assignment of the peaks occurred further transitions toward lower binding energies at 366.2 eV of Ag 3d5/2 spectrum and 528.5 eV of O 1s spectrum, and incorporation of higher oxidation states formed as the mixture of AgO and Ag2O3. This suggests that at the higher oxygen flow ratio, the oxidation states of Ag are increased with the incorporation of more electrons into the chemical bonds64 to form the dominant oxidation states of Ag3O4, which is the mixture of two or more individual oxides of Ag(II)O and Ag2(III)O3.
The high resolution in the −1–10 eV scan of the valence band (VB) spectra obtained by XPS measurement of AgxO films with various R[O2]% is shown in Fig. 9(a). The R[O2]% = 0% VB spectrum presents two peaks at the binding energy of 7.2 eV and 5.5 eV, which may be the result of the Ag 5s and 4d orbital atoms exerting repel forces on each other. This is consistent with the metal–metal interactions for the electric dipole transitions from 5s to 4d orbitals.65,66 Increasing the oxygen flow ratio of R[O2]% from 10% to 17% and 30%, only one peak can be observed with the binding energy changing from 5.8 eV to 4 eV. In the case of R[O2]% = 17% and 30%, the peak wing on the lower binding energy side was lifted to a higher intensity compared to R[O2]% = 10% and 16%. This may indicate that with increasing R[O2]%, the atomic interaction preference for metal (Ag) and metal (Ag) transition to metal (Ag) and nonmetal (O)8 is interpreted as the attractive forces between the charge of Ag 4d orbital and the charge of O 2p orbital bonding to form a hybrid orbital around the valence band.18,61 The feature of the lower binding energy shifting would be to the extent of hybridization of Ag 5s and/or 4p orbital with O 2p orbital.67–69 Meanwhile, Fig. 9(b) of magnifying the valence band region provides good evidence for the interaction of the metal (Ag) and nonmetal (O) bonding system. As R[O2]% = 0%, the density of states at the Fermi level can be properly observed. This is in agreement with the metallic behavior characterized as pure Ag. After supplying oxygen R[O2]%, we can observe the oxygen-induced band is forming. In addition to that, these results closely match the ionization energy or work function data from PYS measurements, which shows that high oxygen flow ratios tend to have more oxygen incorporated into the deposited film, especially the top surface range. Up to now, we can summarize all the information together to define the main species of AgxO films; that is, the samples of AgxO grown under the R[O2]% = 17% and 30% are the mixture of Ag(II)O and Ag2(III)O3 randomly distributed as Ag3O4, while those grown under R[O2]% = 10% and 16% are mainly Ag(II)O.
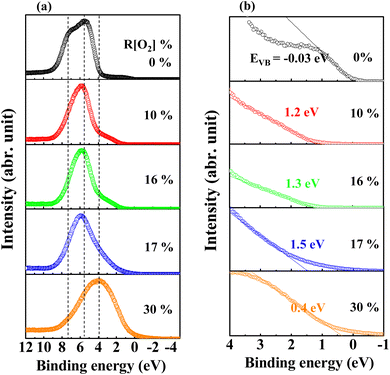 | ||
| Fig. 9 Measured XPS data for (a) the peaks of the valence-band region and (b) magnifying the valence-band region around EF region of AgxO films deposited at various R[O2]%. | ||
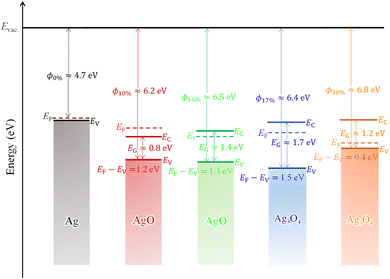
Lastly, combining all the causation and correlation, we established a pilot energy level diagram of AgxO films with various R[O2]% to illustrate the mechanism between the material character and R[O2]% as shown in Fig. 10. And the comparisons of different R[O2]% influence on the physical parameters are summarized in Table 4. Note that the evaluation of the valence band level and the Fermi level difference from the vacuum level is employed using 150 nm AgxO thin films, whereas the band gaps were employed using 50 nm AgxO thin films because it was hard to obtain the data of band gaps using 150 nm AgxO thin films. In polycrystalline materials, the changes in properties with thickness are generally not significant,70,71 and this is also confirmed by XRD, SEM, and transmittance measurements for the samples used in this study. For R[O2]% = 0%, the metallic Ag film was deposited with a conductivity of 106 S·cm−1, work function of 4.7 eV, and valence band and conduction band overlapping at the 0 eV (measured data showed −0.03 eV and we thought this is due to air explosion) with respect to Fermi level. For R[O2]% = 10%, the semiconductor and/or insulator of AgO was deposited with the resistivity of 6.3 × 10⁻⁵ Ω·cm, the work function (ϕ) of 6.2 eV, and the band gap (EG) of 0.8 eV (estimated value), in which the bottom of the conduction band located at −0.4 eV and the top of the valence band located at −1.2 eV concerning the Fermi level. In general, the resistivity of the AgO thin film is around 1 Ω·cm.72 So, it can be seen that the conductivity of a transparent AgO film grown under R[O2]% = 10% is as high as that of a metal. However, from the transmittance results the characteristics of R[O2]% = 10% at the transparent region are different from those of other samples, and the reflection, not absorption, is dominant. In this case, it may not be possible to calculate the absorption edge well from the equation of Tauc.
| R[O2]% | O-state | ϕ (eV) | EG (eV) | EV (eV) | |EF − EV| (eV) |
|---|---|---|---|---|---|
| 0% | Ag | 4.7 | 0 | −0.03 | 0.03 |
| 10% | AgO | 6.2 | 0.8 | 1.2 | 1.2 |
| 16% | AgO | 6.5 | 1.4 | 1.3 | 1.3 |
| 17% | Ag3O4 | 6.4 | 1.7 | 1.5 | 1.5 |
| 30% | Ag3O4 | 6.8 | 1.2 | 0.4 | 0.4 |
For R[O2]% = 16%, the semiconductor and/or insulator of AgO was deposited with a resistivity of 8.6 × 10⁵ Ω·cm, the work function (ϕ) of 6.5 eV, and the band gap (EG) of 1.4 eV. The bottom of the conduction band located at 0.1 eV and the top of the valence band located at −1.3 eV with respect to the Fermi level. For R[O2]% = 17% & 30%, the deposition sample is semiconductor and/or insulator of a mixture of Ag(II)O and Ag2(III)O3 randomly distributed as Ag3O4 with a resistivity of 4.1 × 10⁵ Ω·cm (R[O2]% = 17%) and 1.7 × 10⁶ Ω·cm (R[O2]% = 30%), the work function (ϕ) of 6.4 eV (R[O2]% = 17%) and 6.8 eV (R[O2]% = 30%), and the band gap (EG) that of 1.7 eV (R[O2]% = 17%) and 1.2 eV (R[O2]% = 30%). The bottom of the conduction band located at 0.2 eV (R[O2]% = 17%) and 0.8 eV (R[O2]% = 30%) and the top of the valence band located at −1.5 eV (R[O2]% = 17%) and −0.4 eV (R[O2]% = 30%) with respect to the Fermi level. However, the valence band energy level and the work function data of 16% and 17% may be unreliable because the high resistance leading to the photoelectron cannot be obtained clearly.
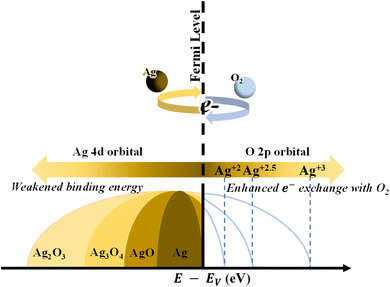
The transition mechanisms between the metallic, semiconductor, and insulator states of AgxO with increasing R[O2]% are shown in Fig. 11. When we checked the literature on silver oxide, we found that N. Qin et al. had investigated the valence band state in detail.73 According to this literature, the results obtained in this study can be understood more clearly. In short, a higher proportion of d-band holes and more electrons closer to the Fermi level under the higher valence Ag species were revealed in the literature from the computational studies, and our experimental results showed the same results.
4. Conclusions
The properties of AgxO thin films with various R[O2]% have been investigated and analyzed using different types of measurements. GIXD spectra and SEM images were used for the crystal structure characterization, and UV-vis spectra and the resistance meter were used for the band gap and resistivity investigations. From GIXD data, it was found that AgxO films tended to be a mixture of Ag(II)O and Ag2(III)O3. To precisely confirm the band gaps of AgxO, two different thicknesses of 150 nm and 50 nm were deposited. The PYS spectra were used for work function confirmation. XPS was used to characterize the chemical states of AgxO. With an increase in R[O2]% from 0% to 30%, AgxO has a variational orientation for AgO (111) to Ag3O4 (002) grains, and the band gaps have extended to 1.7 eV but narrowed to 1.2 eV. The chemical states of AgxO have been confirmed as AgO (R[O2]% = 10% and 16%) and Ag3O4 (R[O2]% = 17% and 30%). Therefore, AgxO has the potential to be used as a transparent electrode in the infrared light range for heterojunctions and Schottky junctions. The energy level band has been given but the details of the physical phenomena need further confirmations.Data availability
The data supporting this article have been included as part of the ESI.†Conflicts of interest
There are no conflicts to declare.References
- H. Yanagi, S. Inoue, K. Ueda, H. Kawazoe, H. Hosono and N. Hamada, J. Appl. Phys., 2000, 88, 4159, DOI:10.1063/1.1308103.
- F. X. Bock, T. M. Christensenb, S. B. Riversc, L. D. Doucettea and R. J. Lad, Thin Solid Films, 2004, 468, 57–64, DOI:10.1063/5.0000210.
- S. B. Rivers, G. Bernhardt, M. W. Wright, D. J. Frankel, M. M. Steeves and R. J. Lad, Thin Solid Films, 2007, 515, 8684, DOI:10.1016/j.tsf.2007.03.139.
- W. M. Haynes, D. R. Lide and T. J. Bruno, CRC Handbook of Chemistry and Physics, Internet Version 2005, Boca Raton, FL, 2005, http://www.hbcpnetbase.comCRCPress Search PubMed.
- D. Linden and T. B. Reddy, Handbook of Batteries, McGraw-Hill, New York, 3rd edn, 1995 Search PubMed.
- D. F. Smith, G. R. Graybill, R. K. Grubbs and J. A. Gucinski, J. Power Sources, 1997, 65, 47–52, DOI:10.1016/S0378-7753(97)02467-1.
- E. Fortin and F. L. Weichman, Phys. Status Solidi, 1964, 5, 515–519, DOI:10.1002/pssb.19640050308.
- J. B. Kim, C. S. Kim and Y. S. Kim, et al., Appl. Phys. Lett., 2009, 95, 183301, DOI:10.1063/1.3257361.
- T. Minami, K. Shimokawa and T. Miyata, J. Vac. Sci. Technol., A, 1998, 16, 1218, DOI:10.1116/1.581262.
- A. J. Varkey and A. F. Fort, Sol. Energy Mater. Sol. Cells, 1993, 29, 253, DOI:10.1016/0927-0248(93)90040-A.
- W. Jie, Y. Lei, H. Jia, M. Jia, H. Hou and Z. Zheng, et al., Dalton Trans., 2014, 43, 11333, 10.1039/C4DT00827H.
- Z. S. Wu, S. Yang, Y. Sun, K. Parvez, X. Feng and K. Müllen, 3D nitrogen-doped graphene aerogel-supported Fe3O4 nanoparticles as efficient electrocatalysts for the oxygen reduction reaction, J. Am. Chem. Soc., 2012, 134(22), 9082–9085, DOI:10.1021/ja3030565.
- Y.-R. Luo, Handbook of Bond Dissociation Energies in Organic Compounds, CRC Press, 1st edn, 2002, DOI:10.1201/9781420039863.
- A. Holewinski, J. C. Idrobo and S. Linic, High-performance Ag-Co alloy catalysts for electrochemical oxygen reduction, Nat. Chem., 2014, 6(9), 828–834, DOI:10.1038/nchem.2032.
- J. Xiao, L. Wan, X. Wang, Q. Kuang, S. Dong, F. Xiao and S. Wang, Mesoporous Mn3O4–CoO Core–Shell Spheres Wrapped by Carbon Nanotubes: A High Performance Catalyst for the Oxygen Reduction Reaction and CO Oxidation, J. Mater. Chem. A, 2014, 2, 3794–3800 RSC.
- J. Yin, Y. Li, F. Lv, Q. Fan, Y. Q. Zhao, Q. Zhang, W. Wang, F. Cheng, P. Xi and S. J. Guo, NiO/CoN Porous Nanowires as Efficient Bifunctional Catalysts for Zn–Air Batteries, ACS Nano, 2017, 11, 2275–2283 CrossRef CAS PubMed.
- Y. Cao, Z. Wei, J. He, J. Zang, Q. Zhang, M. Zheng and Q. Dong, α-MnO2 Nanorods Grown in situ on Graphene as Catalysts for Li–O2 Batteries with Excellent Electrochemical Performance, Energy Environ. Sci., 2012, 5, 9765–9768 RSC.
- J. Asbalter and A. Subrahmanyam, J. Vac. Sci. Technol., A, 2000, 18, 1672, DOI:10.1116/1.582405.
- T. Ishida, H. Kobayashi and Y. Nakato, J. Appl. Phys., 1993, 73, 4344, DOI:10.1063/1.352818.
- A. I. Boronin, S. V. Koscheev, K. T. Murzakhmetov, V. I. Avdeev and G. M. Zhidomirov, Appl. Surf. Sci., 2000, 165, 9, DOI:10.1016/S0169-4332(00)00146-X.
- X. Y. Gao, S. Y. Wang, J. Li, Y. X. Zheng, R. J. Zhang, P. Zhou, Y. M. Yang and L. Y. Chen, Thin Solid Films, 2004, 455–456, 438 CrossRef CAS.
- L. A. A. Pettersson and P. G. Snyder, Thin Solid Films, 1995, 270, 69, DOI:10.1016/0040-6090(96)80069-1.
- A. Subrahmanyam and U. K. Barik, Indium doped silver oxide thin films prepared by reactive electron beam evaporation technique: electrical properties, J. Mater. Sci., 2007, 42, 6041–6045, DOI:10.1007/s10853-006-1130-4.
- U. K. Barik, et al., Electrical and optical properties of reactive DC magnetron sputtered silver oxide thin films: role of oxygen, Thin Solid Films, 2003, 429(1–2), 129–134, DOI:10.1016/S0040-6090(03)00064-6.
- M. Allen and S. Durbin, Appl. Phys. Lett., 2008, 92, 122110, DOI:10.1063/1.2894568.
- G. T. Dang and T. Kawaharamura, et al., Appl. Phys. Lett., 2015, 107, 143504, DOI:10.1063/1.4931960.
- Y. Magari and M. Furuta, et al., Appl. Surf. Sci., 2020, 512, 144519, DOI:10.1016/j.apsusc.2019.144519.
- X. Liu, G. T. Dang, L. Liu and T. Kawaharamura, Appl. Surf. Sci., 2022, 596, 153465, DOI:10.1016/j.apsusc.2022.153465.
- R. P. Van Ingen, R. H. J. Fastenau and E. J. Mittemeijer, J. Appl. Phys., 1994, 76, 1871, DOI:10.1063/1.357711.
- A. Werner and H. D. Hochheimer, Phys. Rev. B: Condens. Matter, 1982, 25, 5929, DOI:10.1103/PhysRevB.25.5929.
- B. Stehlik, P. Weidenthaler and J. Vlach, Collect. Czech. Chem. Commun., 1959, 24, 1581, DOI:10.1135/cccc19591581.
- B. Standke and M. Jansen, J. Solid State Chem., 1987, 67, 278, DOI:10.1016/0022-4596(87)90364-1.
- N. E. Brese, M. O'Keeffe, B. L. Ramakrishna and R. B. Von Dreele, J. Solid State Chem., 1990, 89, 184, DOI:10.1016/0022-4596(90)90310-T.
- G. I. N. Waterhouse, G. A. Bowmaker and J. B. Metson, Oxidation of a polycrystalline silver foil by reaction with ozone, Appl. Surf. Sci., 2001, 183(3–4), 191–204 CrossRef CAS.
- M. A. Barteau and R. J. Madix, J. Electron Spectrosc. Relat. Phenom., 1983, 31, 101–108, DOI:10.1016/0368-2048(83)80013-9.
- G. B. Hoflund, Z. F. Hazos and G. N. Salaita, Phys. Rev. B: Condens. Matter Mater. Phys., 2000, 62, 11126–11133, DOI:10.1016/S0169-4332(01)00561-X.
- F. Bock, T. Christensen and S. Rivers, et al., Thin Solid Films, 2004, 468, 57–64, DOI:10.1016/j.tsf.2004.04.009.
- J. F. Pierson and T. C. Rousselot, Surf. Coat. Technol., 2005, 200, 276–279, DOI:10.1016/j.surfcoat.2005.02.005.
- C. C. Tseng, et al., Effects of deposition and annealing temperatures on the electrical and optical properties of Ag2O and Cu2O–Ag2O thin films, J. Vac. Sci. Technol., A, 2010, 28(4), 791–794, DOI:10.1116/1.3425638.
- A. A. Schmidt, J. Offermann and R. Anton, The role of neutral oxygen radicals in the oxidation of Ag films, Thin Solid Films, 1996, 281, 105–107, DOI:10.1016/0040-6090(96)08586-0.
- E. Fortin and F. L. Weichman, photoconductivity in Ag2O, Phys. Status Solidi B, 1964, 5(3), 515–519, DOI:10.1002/pssb.19640050308.
- R. O. Suzuki, T. Ogawa and O. Katsutoshi, Use of ozone to prepare silver oxides, J. Am. Ceram. Soc., 1999, 82(8), 2033–2038, DOI:10.1111/j.1151-2916.1999.tb02036.x.
- M. Usategui, Higher Oxidation States of Silver, LSU Historical Dissertations and Theses, Louisiana State University and Agricultural & Mechanical College, 1961, vol. 658, DOI:10.31390/gradschool_disstheses.658.
- S. Burkhard and M. Jansen, J. Solid State Chem., 1987, 67, 278–284 CrossRef.
- P. Fischer and M. Jansen, Cyclovoltammetrische-und Röntgenbeugungsuntersuchungen zur anodischen abscheidung Höherer silberoxide, Solid State Ionics, 1990, 43, 61–67, DOI:10.1016/0167-2738(90)90471-3.
- A. N. Mansour, Evidence for an Ag4O3 phase of silver oxide, J. Phys. Chem., 1990, 94(2), 1006–1010 CrossRef CAS.
- J. A. McMillan, Magnetic properties and crystalline structure of AgO, J. Inorg. Nucl. Chem., 1960, 13(1–2), 28–31, DOI:10.1016/0022-1902(60)80231-X.
- W. S. Graff and H. H. Stadelmaier, Higher oxides of silver, J. Electrochem. Soc., 1958, 105(8), 446, DOI:10.1149/1.2428887.
- I. Hamberg and C. G. Granqvist, Evaporated Sn-doped In2O3 films: Basic optical properties and applications to energy-efficient windows, J. Appl. Phys., 1986, 60(11), R123–R160, DOI:10.1063/1.337534.
- F. Urbach, The long-wavelength edge of photographic sensitivity and of the electronic absorption of solids, J. Electrochem. Soc., 1953, 92(5), 1324, DOI:10.1103/PhysRev.92.1324.
- Y. Nakayam and H. Ishii, et al., Appl. Phys. Lett., 2008, 93, 173305 CrossRef.
- I. Hisao, Photoelectron yield spectroscopy, Compendium of Surface and Interface Analysis, 2018, pp. 457–463, DOI:10.1007/978-981-10-6156-1_75.
- W.-X. Li, C. Stampfl and M. Scheffler, Insights into the function of silver as an oxidation catalyst by ab initio atomistic thermodynamics, Phys. Rev. B: Condens. Matter Mater. Phys., 2003, 68(16), 165412, DOI:10.1103/PhysRevB.68.165412.
- J. F. Weaver and G. B. Hoflund, Surface characterization study of the thermal decomposition of Ag2O, Chem. Mater., 1994, 6(10), 1693–1699 CrossRef CAS.
- S. W. Gaarenstroom and N. J. T. J. Winograd, Initial and final state effects in the ESCA spectra of cadmium and silver oxides, J. Chem. Phys., 1977, 67(8), 3500–3506, DOI:10.1063/1.435347.
- C. Rehren, et al., Surface and subsurface products of the interaction of O2 with Ag under catalytic conditions, Catal. Lett., 1991, 11, 253–265, DOI:10.1007/BF00764316.
- G. Schön, et al., ESCA studies of Ag, Ag2O and AgO, Acta Chem. Scand., 1973, 27(7), 2623 CrossRef.
- J. S. Hammond, S. W. Gaarenstroom and N. Winograd, X-ray photoelectron spectroscopic studies of cadmium-and silver-oxygen surfaces, Anal. Chem., 1975, 47(13), 2193–2199, DOI:10.1021/ac60363a019.
- A. Savitzky and M. J. E. Golay, Anal. Chem., 1964, 36, 1627 CrossRef CAS.
- V. I. Bukhtiyarov, et al., The state of oxygen on the surface of polycrystalline silver, React. Kinet. Catal. Lett., 1989, 39, 21–26 CrossRef CAS.
- T. C. Charles and T. Mark, Paffett, Surf. Sci., 1984, 143(2–3), 517–535 Search PubMed.
- G. Zhang, P. Yan, P. Wang, Y. Chen and J. Zhang, The preparation and mechanical properties of Al-containing a-C: H thin films, J. Phys. D Appl. Phys., 2007, 40, 6748–6752 CrossRef CAS.
- K. Baba and R. Hatada, Deposition and characterization of Ti- and W-containing diamond-like carbon films by plasma source ion implantation, Surf. Coat. Technol., 2003, 169–170, 287–290 CrossRef CAS.
- P. Behrens, Bonding in silver-oxygen compounds from Ag L3 XANES spectroscopy, Solid State Commun., 1992, 81(3), 235–239, DOI:10.1016/0038-1098(92)90506-5.
- R. W. Bigelow, An XPS study of air corona discharge-induced corrosion products at Cu, Ag and Au ground planes, Appl. Surf. Sci., 1988, 32(1–2), 122–140, DOI:10.1016/0169-4332(88)90077-3.
- M. Jansen, Homoatomic d10–d10 interactions: their effects on structure and chemical and physical properties, Angew Chem. Int. Ed. Engl., 1987, 26(11), 1098–1110, DOI:10.1002/anie.198710981.
- P. Behrens, Z. Anorg. Allg. Chem., 1999, 625, 1116 CrossRef.
- M. Romand, M. Roubin and J. P. Deloume, J. Electron Spectrosc. Relat. Phenom., 1978, 13, 229, DOI:10.1016/0368-2048(78)85029-4.
- L. H. Tjeng, M. B. J. Meinders, J. van Elp, J. Ghijsen, G. A. Savatsky and R. L. Johnson, Phys. Rev. B, 1990, 41, 3190, DOI:10.1103/PhysRevB.41.3190.
- H. Fan, Z. Li, M. Huang and X. Zhang, Thickness effects in polycrystalline thin films: Surface constraint versus interior constraint, Int. J. Solids Struct., 2011, 48, 1754–1766, DOI:10.1016/j.ijsolstr.2011.02.026.
- M. Alzaid, W. S. Mohamed, M. El-Hagary, E. R. Shaaban and N. M. A. Hadia, Opt. Mater., 2021, 118, 111228 CrossRef CAS.
- A. Tvarusko, J. Electrochem. Soc., 1968, 115, 1105 CrossRef CAS.
- N. Qin, S. Yu, Z. Ji, Y. Wang, Y. Li, S. Gu, Q. Gan, Z. Wang, Z. Li, G. Luo, K. Zhang and Z. Lu, CCS Chem., 2022, 4, 3587–3598 CrossRef CAS.
Footnote |
| † Electronic supplementary information (ESI) available. See DOI: https://doi.org/10.1039/d4ra02039a |
| This journal is © The Royal Society of Chemistry 2024 |

