 Open Access Article
Assessing rare earth elements in Indian coal ash using Westcott formalism in NAA and leaching studies
Manish Chand *a,
Subhrojit Bagchib and
Bilal Hassan Khanb
aMaterials Chemistry and Metal Fuel Cycle Group, IGCAR, Kalpakkam, 603102, India. E-mail: mchand@igcar.gov.in; manish.chand.bhu@gmail.com,; Tel: +91-44-27480500 Extn: 24164
bReactor Design Group, IGCAR, Kalpakkam, 603102, India
First published on 16th August 2024
Abstract
This study employs Westcott formalism coupled with the internal monostandard approach in k0-NAA to assess Rare Earth Elements (REEs) in Indian coal ash samples. This method mitigates neutron flux perturbations during irradiation and enables in situ detector efficiency calibration for quantitative analysis. Deviations in thermal capture cross-sections for non-1/v nuclides in REEs were addressed using the Westcott g(Tn)-factor obtained from the ENDF/B-VIII.0 data. REEs content in Indian coal ash was found to be 350–500 mg kg−1, aligning with global standards. Leaching feasibility for medium-lived REEs with hydrochloric acid was demonstrated, supporting effective recovery. These findings suggest Indian coal ash as a potential secondary resource for REEs amid global supply challenges.
1 Introduction
Rare Earth Elements (REEs) are incredibly versatile due to their unique chemical, magnetic, and luminescent properties, making them indispensable for the development of environmentally friendly and sustainable technologies. These elements are crucial for a wide range of applications, including defence systems, renewable energy technologies, rechargeable batteries, lighting products, catalytic converters, and electric vehicles. Nevertheless, the uncertainty surrounding the supply of rare earths poses a growing obstacle to the progression and maturation of cutting-edge and futuristic technologies. The interplay between disruptive potential and the essential requirement of REEs for defence, renewable energy sources and other applications like rechargeable batteries, lighting products, catalytic converters, electric vehicles etc. has elevated their critical importance and generated a substantial demand for REEs.1–3 The global REE market has been characterized by significant supply chain challenges. Historically, the USA led REE mining from 1965 to 1984, but China has since become the dominant producer, controlling 70% of global REE mining as of 2022. The 40% reduction in REE exports by China in 2010 led to a significant price increase and highlighted the vulnerability of global supply chains.4–8The absence of immediate substitutes of REEs and heavy dependence on imports hindered the global advancement of emerging technologies. As a result of this, multiple REEs such as yttrium (Y), neodymium (Nd), europium (Eu), terbium (Tb), dysprosium (Dy), and erbium (Er) have been identified as critical by the European Commission, National Environmental Research Council, and the U.S. Department of Energy due to their high potential in clean energy applications and significant supply risk. This has spurred global research initiatives aimed at indigenous production and sustainable recovery of these elements.9,10 Global Mine production of REEs saw a rise from 280![[thin space (1/6-em)]](https://www.rsc.org/images/entities/char_2009.gif) 000 tons of REO equivalent in 2021 to an estimated 300
000 tons of REO equivalent in 2021 to an estimated 300![[thin space (1/6-em)]](https://www.rsc.org/images/entities/char_2009.gif) 000 tons in 2022. China's Ministry of Industry and Information Technology raised 2022 quotas for rare-earth mining and separation to 210
000 tons in 2022. China's Ministry of Industry and Information Technology raised 2022 quotas for rare-earth mining and separation to 210![[thin space (1/6-em)]](https://www.rsc.org/images/entities/char_2009.gif) 000 tons and 202
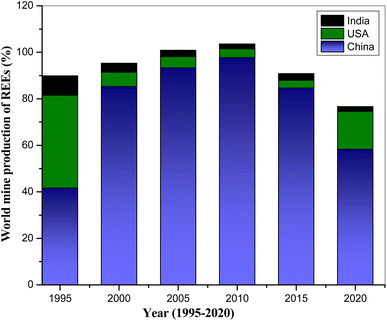
000 tons and 202![[thin space (1/6-em)]](https://www.rsc.org/images/entities/char_2009.gif) 000 tons of REO equivalents, respectively. Even though China shows dominance in the rare-earth but its global REEs mining decreased from 90% in 2010 to the 70% in 2022 (Fig. 1).11
000 tons of REO equivalents, respectively. Even though China shows dominance in the rare-earth but its global REEs mining decreased from 90% in 2010 to the 70% in 2022 (Fig. 1).11
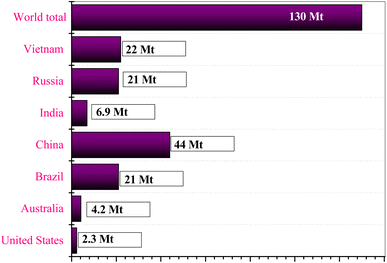
Global rare earth oxide (REO) reserves stand at an estimated 130 million tons, distributed globally as shown in Fig. 2. India stands at the fifth position, with the leading by China. If the annual demand growth rate remains at approximately 10%, global REO reserves could be depleted by the middle of the 21st century.11
The increasing demand for REEs has sparked a global search for new primary sources and alternative reserves. From the research, it was found that various REEs reserves like mud, end-use products, coal and its combustion residues are potential secondary sources for the REEs production.12–18 In India, thermal power generation reliant on coal represents the predominant source of power capacity expansion, accounting for over 69% of the overall electricity production. Indian coal, with its high ash content of 30–60%, presents a significant opportunity for REE recovery, especially given the contrast with imported coals (2–20% ash content). Various studies have demonstrated that REEs in coal ash are often uniformly dispersed within a glassy amorphous aluminosilicate matrix, necessitating strong acidic or alkaline solutions for their extraction. Recent research has focused on optimizing leaching conditions to maximize REE recovery from coal ash.14–21 Shanshan Cao et al.21 studied the about the various influencing factors towards the leaching of most abundant REEs (La, Ce and Nd) from coal fly ash in the HCl medium. Similar study has been performed for the leaching behaviour of medium-lived REEs from coal ash in the same HCl medium using their corresponding radioactive tracers produced via (n,γ) capture reaction.20–24 Radioactive tracer methodology for leaching study offers several advantages like sensitivity, selectivity, minimal spectral interference, dilution free etc. over conventional analysis techniques like ICPMS (Inductively Coupled Plasma Mass Spectrometry) and ICPOES (Inductively Coupled Plasma Optical Emission Spectroscopy). Extraction of REEs from the coal combustion residue may enhance its applicability and effective utilization of surplus amount of coal ash.18 The profiling of REEs in coal ash samples becomes mandatory towards their extraction with economical and efficient methods. The present research study focuses on the application of non-destructive k0-Neutron Activation Analysis (NAA) to ascertain the concentration of REEs in coal ash samples sourced from different thermal power plant in India due to its several advantages over ICPOES, ICPMS. In NAA, most of the nuclides exhibit a thermal neutron capture cross-section that follows the 1/v law, where the cross-section is inversely proportional to the neutron velocity. However, a few nuclides deviate from this 1/v behaviour, referred to as non-1/v nuclides. Despite the advantages of considering 1/v and non-1/v nuclides, there is a paucity of articles applying the Westcott formalism in k0-NAA. The present study employs the Westcott formalism in k0-NAA due to its ability to account for deviation from the 1/v law in certain REEs, such as 151Eu and 176Lu. This approach, coupled with the internal monostandard method, minimizes neutron flux perturbations during irradiation and self-attenuation of gamma radiation during counting, ensuring accurate and reliable quantification of REEs in coal ash. Towards elemental characterization, recently determined parameters including the neutron temperature, modified spectral index  , and epi-thermal flux shape factor (α) at the Pneumatic Fast Transfer System (PFTS) location of the KAMINI reactor were employed.25–33
This study aims to quantify the concentration of REEs in coal ash samples sourced from various thermal power plants in India using non-destructive k0-NAA with Westcott formalism. Additionally, the feasibility of leaching medium-lived REEs using hydrochloric acid is demonstrated, supporting the potential recovery of these critical elements from coal ash.
2 Experimental
2.1 Materials and methods
Four coal ash samples, sourced from thermal power plants in India were obtained for REEs analysis using NAA technique. The quantification of activated samples was executed using high-resolution gamma spectrometry by employing a 30% p-type co-axial High Purity Germanium (HPGe) detector acquired from M/s Canberra Eurisys. The detector offers energy resolution of 1.85 keV at the prominent 1332 keV gamma energy line of 60Co, complemented by an associated 8k multichannel analyser (MCA) system equipped with Aptec spectra software. To ensure precision in energy calibration, the detector was calibrated using standard radioactive sources, namely 241Am and 152Eu, procured from M/s Amersham, Inc.2.2 Sample irradiation and radioactive assay
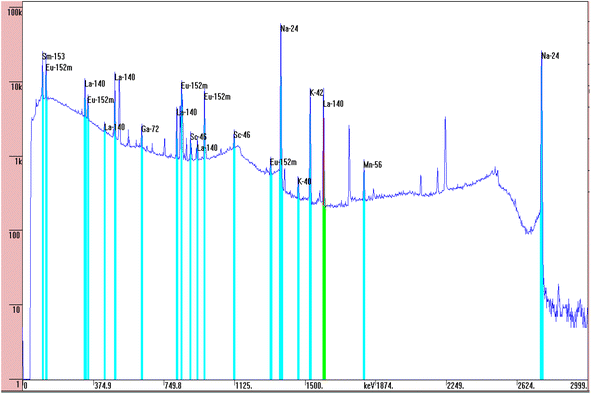
Four coal ash samples and NIST-SRM 1633b coal ash, each weighing approximately 50 mg were prepared in duplicate using clean polythene sheets. The first set of four sample were subjected to short-time irradiation (30 min) and the other set for long-time irradiation (6 h) at the Pneumatic Fast Transfer System (PFTS) position of the KAMINI reactor, operating at 20 kW reactor power. However, two sample of different coal ash, along with the NIST SRM, and a gold (Au) standard were taken in each irradiation. Short irradiated samples were counted for 15 min to 1 h after a 30 min cooling time; whereas the long irradiated samples were counted for 1 h to 14 h, after 1 day cooling time at a distance of 30 cm from 30% p-type co-axial High Purity Germanium (HPGe) detector. The recently characterized neutron spectrum parameters at PFTS and α value were 0.037 ± 0.001 and −0.0494 ± 0.0071 respectively. The average value of gLu(Tn) was found to be 1.8939 ± 0.0130 using 1/v nuclides (94Zr, 58Fe and 197Au). The maxwellian neutron temperature corresponding to the gLu(Tn) was found to be 47.2 °C.25 These characterized parameters were used in the quantification of REEs. Fig. 3 illustrates a representative gamma spectrum obtained from the HPGe detector for the 6 h neutron irradiated coal ash sample, which was counted for the 5000 s after 1 day cooling time. The gamma spectrum of the neutron-irradiated coal ash sample indicates the presence of REEs like Sm, Eu, La etc. along with other matrix elements, identified by characteristic gamma energies of their activated products. The activation product of sodium as matrix element i.e.24 Na emits 1368.6 keV and 2754 keV gamma rays, which causes high Compton background. To mitigate this, the same sample was again counted after the decay of short lived 24Na (t1/2 = 14.96 h).
2.3 Leaching of REEs using radioactive tracers
In addition to the above, present study also demonstrates the feasibility of leaching for medium-lived REEs from coal ash in HCl medium using their corresponding radioactive tracers produced via NAA. The NIST 1633b Standard Reference Material (SRM) bituminous coal fly ash, weighing approximately 100 mg, was subjected to neutron irradiation with a flux of 1 × 10¹¹ n cm−2 s−1 at the PFTS location of the KAMINI reactor, operated at 20 kW for a duration of 6 h. Subsequently, the irradiated sample was analysed using HPGe detector for estimation of activation products of various rare earths. The irradiated samples were subjected to leaching in a 100 mL of 8 M HCl solution at a temperature of 90 °C, with constant agitation at 200 revolutions per minute (RPM), for a period of 7 hours.21 At different time intervals during the leaching process, samples were collected from the leachate in 5 mL gamma vials and subsequently analysed using HPGe detector. The initial two samples were collected at 30 minutes intervals due to high activity and a higher leaching rate. As the leaching rate decreased, the time interval was increased to 1 hour to ensure sufficient activity in the diluted samples.2.4 Elemental quantification using Westcott formalism in k0-NAA
The concentration of the element i i.e. Ci (mg kg−1) using Westcott formalism in k0-NAA can be obtained using the following equation25
 | (1.0) |
 is modified spectral index.25–31 The ratio of the modified reduced resonance integral (for a 1/El+α epithermal spectrum) to the 2200 ms−1 cross-section is given by
 | (1.1) |
 | (1.2) |
The ratio of mass (m) of an element (x) to mass of the internal mono standard element (y) in the coal fly ash was calculated by the following equation in the internal monostandard using Westcott formalism in k0-NAA. For obtaining the absolute concentration, the internal mono standard concentration was determined using Energy Dispersive X-ray Fluorescence (EDXRF) as well as relative NAA with minimal sample.
 | (1.3) |
The following Table 1 nuclear data was used for the estimation REEs using above discussed standardization methods.
| Target isotope | Formed isotope | T1/2 | Eγ (keV) | k0,Au | Q0 | (eV) | s0 | s0 (α) |
|---|---|---|---|---|---|---|---|---|
| a so Values for non-1/v nuclides were taken from ref. 31. | ||||||||
| 139La | 140La | 1.678 day | 1596.2 | 1.34 × 10⁻¹ | 1.24 | 76 | 0.92 | 1.13 |
| 140Ce | 141Ce | 32.51 day | 145.4 | 3.66 × 10⁻³ | 0.83 | 7200 | 0.45 | 0.70 |
| 141Pr | 142Pr | 19.12 h | 1575.6 | 6.12 × 10⁻³ | 1.51 | 296 | 1.22 | 1.62 |
| 146Nd | 147Nd | 10.98 day | 91.1 | 1.02 × 10⁻³ | 2.00 | 874 | 1.77 | 2.48 |
| 146Nd | 147Nd | 10.98 day | 531 | 4.56 × 10⁻⁴ | 2.00 | 874 | 1.77 | 2.48 |
| 152Sm | 153Sm | 46.50 h | 69.7 | 3.52 × 10⁻² | 14.4 | 8.53 | 15.77 | 17.53 |
| 152Sm | 153Sm | 46.50 h | 103.2 | 2.31 × 10⁻¹ | 14.4 | 8.53 | 15.77 | 17.53 |
| 151Eua | 152mEu | 9.312 h | 121.8 | 1.48 | — | 0.448 | 1.20 | 1.15 |
| 151Eua | 152mEu | 9.312 h | 841.6 | 3.02 | — | 0.448 | 1.20 | 1.15 |
| 152Gd | 153Gd | 240.4 day | 97.4 | 5.86 × 10⁻³ | 0.77 | 16.7 | 0.38 | 0.44 |
| 158Gd | 159Gd | 18.56 h | 363.5 | 8.49 × 10⁻⁴ | 29.9 | 48.2 | 33.26 | 40.28 |
| 159Tb | 160Tb | 72.3 day | 298.6 | 8.25 × 10⁻² | 17.9 | 18.1 | 19.72 | 22.75 |
| 159Tb | 160Tb | 72.3 day | 879.4 | 9.42 × 10⁻² | 17.9 | 18.1 | 19.72 | 22.75 |
| 164Dy | 165Dy | 2.334 h | 94.7 | 3.57 × 10⁻¹ | 0.19 | 224 | −0.27 | −0.35 |
| 165Ho | 166Ho | 26.83 h | 80.6 | 4.94 × 10⁻² | 10.9 | 12.3 | 11.82 | 13.38 |
| 170Er | 171Er | 7.516 h | 308.3 | 1.04 × 10⁻² | 4.42 | 129 | 4.50 | 5.73 |
| 169Tm | 170Tm | 128.6 day | 84.3 | 3.26 × 10⁻² | 13.7 | 4.8 | 14.98 | 16.19 |
| 174Yb | 175Yb | 4.185 day | 282.5 | 1.46 × 10⁻² | 0.46 | 602 | 0.03 | 0.05 |
| 174Yb | 175Yb | 4.185 day | 396.3 | 3.12 × 10⁻² | 0.46 | 602 | 0.03 | 0.05 |
| 176Lua | 177Lu | 6.73 day | 112.9 | 4.15 × 10⁻² | — | 0.158 | 1.67 | 1.52 |
| 176Lua | 177Lu | 6.73 day | 208.4 | 7.14 × 10⁻² | — | 0.158 | 1.67 | 1.52 |
3 Results and discussion
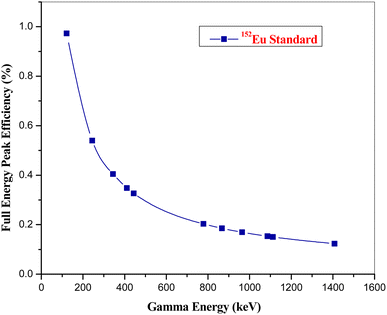
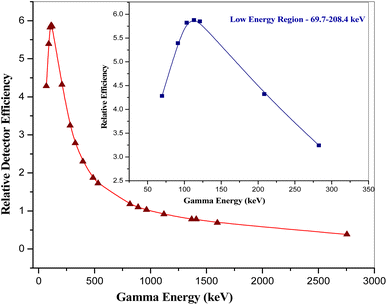
The REEs in the NIST SRM 1633b CFA were determined using k0-NAA as well as internal monostandard approach using Westcott formalism and presented in the Table 2. The uncertainty associated with the result is calculated using error propagation method from the replicate experiments. Iron (Fe), which possesses favourable nuclear properties like appropriate half-life (T1/2 of 59Fe 44.5 day), high gamma intensity (1099 keV, 56.5%; 1291 keV, 43.2%), and is abundant within the NIST SRM, was selected as the internal standard for this analytical procedure. This choice enabled for the normalization and accurate quantification of REEs within the coal fly ash sample. Calibration of the high-purity germanium (HPGe) detector for k0-NAA was accomplished using a standard point geometry source containing 152Eu. k0-NAA requires known activity of 152Eu with identical geometry to achieve the full energy peak efficiency calibration. The uncertainties associated in the efficiency calibration using 152Eu were found to be less than 2%. The calibration process covers the energy range of 121.8 to 1408 keV, as illustrated in Fig. 4. The gamma energies i.e. less than the 121.8 keV are not available in the case of 152Eu for the detector efficiency calibration in lower energy region. Nuclides emitting gamma radiation with energies lower than 121.8 keV, such as 153Sm (69.7 keV, 103.2 keV), 165Dy (94.7 keV), 166Ho (80.6 keV), and 170Tm (84.3 keV), posed a challenge for the quantification within the framework of k0-NAA.| Element | Conc. (mg kg−1) ± ulab | Conc. (mg kg−1) ± ucert | Deviation (%) | En number | |||
|---|---|---|---|---|---|---|---|
| k0-NAA | IM-NAA | Certificate value | k0-NAA | IM-NAA | k0-NAA | IM-NAA | |
| a GeoRem database (INAA). | |||||||
| La | 92.0 ± 3.2 | 91.0 ± 2.1 | 94 | 2.1 | 3.2 | — | — |
| Ce | 185 ± 5.8 | 196 ± 9.6 | 190 | 2.6 | −3.2 | — | — |
| Pr | 21.8 ± 1.1 | 20.0 ± 1.0 | 21 | −3.8 | 4.8 | — | — |
| Nd | 86.5 ± 4.1 | 86.0 ± 3.1 | 85 | −1.8 | −1.2 | — | — |
| Sm | — | 21.0 ± 0.9 | 20 | −5.0 | — | — | |
| Eu | 4.20 ± 0.20 | 4.00 ± 0.15 | 4.1 | −2.4 | 2.4 | — | — |
| Gd | 13.6 ± 0.6 | 12.6 ± 0.6 | 13 | −4.6 | 3.1 | — | — |
| Tb | 2.47 ± 0.11 | 2.64 ± 0.09 | 2.6 | 5.0 | −1.5 | — | — |
| Dy | — | 16.3 ± 0.9 | 17 | 4.1 | — | — | |
| Ho | — | 3.36 ± 0.10 | 3.5 | 4.0 | — | — | |
| Er | 8.30 ± 0.30 | 8.95 ± 0.40 | 8.7a | 4.6 | −2.9 | — | — |
| Tm | — | 2.00 ± 0.08 | 2.1 | 4.8 | — | — | |
| Yb | 7.27 ± 0.20 | 7.69 ± 0.30 | 7.6 | 4.3 | −1.2 | — | — |
| Lu | 1.15 ± 0.05 | 1.16 ± 0.06 | 1.2 | 4.2 | 3.3 | — | — |
| As | 134.3 ± 2.9 | 134.7 ± 2.4 | 136.2 ± 2.6 | 1.4 | 1.1 | −0.48 | −0.42 |
| Cr | 197.2 ± 3.8 | 196.3 ± 4.2 | 198.2 ± 4.7 | 0.5 | 1.0 | −0.16 | −0.30 |
| Th | 26.1 ± 1.2 | 25.1 ± 1.2 | 25.7 ± 1.3 | −1.6 | 2.3 | 0.23 | −0.34 |
| U | 8.90 ± 0.30 | 8.71 ± 0.20 | 8.79 ± 0.36 | −1.3 | 0.9 | 0.23 | −0.19 |
| K (%) | 1.97 ± 0.04 | 1.96 ± 0.05 | 1.95 ± 0.03 | −1.0 | −0.5 | 0.40 | 0.17 |
| Na (%) | 0.202 ± 0.005 | 0.203 ± 0.004 | 0.201 ± 0.003 | −0.5 | −1.0 | 0.17 | 0.40 |
These challenges were resolved in the case of internal monostandard approach i.e. the in-site relative detector efficiency calibration has been carried out in the range of 69.7 to 2754 keV using the gamma energy of activation products itself i.e. 24Na (1368 and 2754 keV), 46Sc (889.3, 1120.5 keV), 140La (328.8, 487.0, 815.8 and 1596.5 keV), 147Nd (91.1 and 531.0 keV), 152Eu (121.9, 963 and 1408 keV), 153Sm (69.7 and 103 keV), 175Yb (282.5 and 396.5 keV) and 177Lu (112.9 and 208.4 keV). The known activity of the activation products is not required for the in situ relative detector efficiency calibration, which makes the process geometrically independent. The nuclide emits minimum a pair of gamma energy was used for the efficiency calibration in the energy range of interest. The efficiency ratios for a nuclide were calculated using the ratios of peak area and intensity. The fitted ratios were obtained corresponding to the same energy as the measured ratios using the following equation.
 | (1.4) |
The coefficients A1, A2, A3, …, An were determined using the least square fitting method. The full energy peak efficiency calibration obtained by using the following equation.
 | (1.5) |
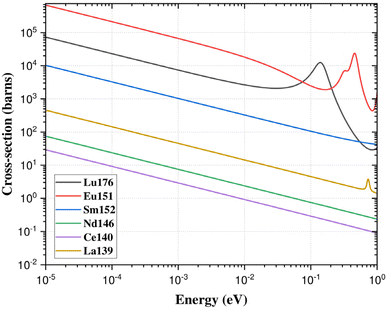
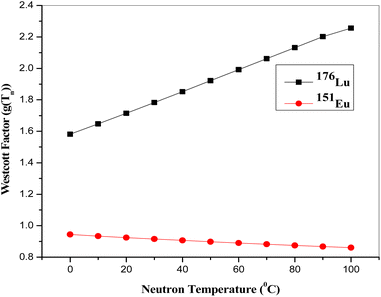
In the context of REEs estimation, it is observed that the majority of elements exhibit a thermal capture cross-section behaviour proportional to 1/v, where ‘v’ represents the neutron velocity. However, two specific nuclear reactions, namely 176Lu (n,γ) 177Lu and 151Eu (n,γ) 152m,152Eu, deviate from the 1/v behaviour, as depicted in Fig. 6. This deviation from the expected 1/v behaviour due to the resonance involved into the thermal energy region is quantified using a parameter known as the Westcott factor (g(Tn)). The Westcott factor serves as a quantitative measure of the departure from the 1/v behaviour and is known to linearly correlate with the neutron temperature. For the assessment and characterization of non-1/v behaviours, detailed calculations for the above nuclear reactions were performed using cross-section data of ENDF/B-VIII.0 data (USA, 2018) nuclear data library in the temperature range of 0 to 100 °C (Fig. 7). The g(Tn) values were particularly calculated from the linear equation, using the recently measured neutron temperature in the PFTS irradiation channel of the KAMINI reactor.25 For nuclides that adhere to the 1/v relationship, g(Tn) is equal to 1.
The spectral interferences were found in the low energy region due to emission of same gamma energy by other radioactive nuclide formed in the sample matrix. The gamma line 103.2 keV of 153Sm is interfered by the 153Gd (240.4d, Eγ = 103.2 keV) as well as 232Th (n,γ) → 233Th → 233Pa (t1/2 = 26.97 day and Eγ = 103.9 keV) and 238U (n,γ) → 239U → 239Np (t1/2 = 2.357 day and Eγ = 103.7 keV). Other similar cases are the following γ-line interferences of 239Np on the 80.6 keV of 166Ho and 153Gd on the 69 keV of 153Sm. To mitigate these interferences, samples were analysed at different time intervals. Correction factors for the interfering gamma emissions were applied, utilizing the measured activity corresponding to the non-interfering gamma ray. The magnitude of the interference depends upon the half-life and gamma intensity, in the case of 153Sm (103.2 keV) the impact of 239Np was found to be more pronounced than that of 233Pa and 153Gd.
The presence of uranium (U) and thorium (Th) in the coal ash samples could become a possible source of the error for the estimation of lower REEs like 140La, 141Ce, 143Ce and 147Nd due to high fission yield. The average concentration of U and Th in the coal ash was found to be 10 and 30 mg kg−1 respectively. However, due to the low concentration, small sample size and low flux at the PFTS location, their impact on determining the concentration of lower REEs was deemed to be negligible. The quality assurance of k0-NAA and IM-NAA with the Westcott formalism has been tested by calculating the % deviation and En number with that of the certificate values. The following equation was used to calculate the En number.34
 | (1.6) |
3.1 Rare earth in Indian coal ash sample
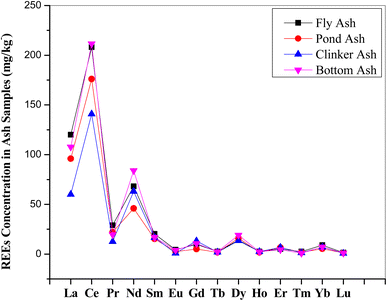
Rare earths are a group of 17 elements comprising of 15 “Lanthanides”, lanthanum (La) to lutetium (Lu) and two others, yttrium (Y) and scandium (Sc). The present study focused only on lanthanides, among them promethium (Pm) does not occur in the Earth's crust. Similar methodology as discussed above was adopted for the assay of REEs in fly ash samples and the results so obtained were presented in Table 3. The REEs concentration varies from 0.7 (Lu) to 210 (Ce) mg kg−1. The concentration of different REEs in the different ash samples are plotted in Fig. 8 and found identical patterns of REEs in all the samples. Total REEs concentration in the Indian coal ash varies in the range of 350–500 mg kg−1.| REEs | Coal ash samples conc. ((mg kg−1) ± ulab) | Worldwide conc. (mg kg−1) | |||
|---|---|---|---|---|---|
| Fly ash | Pond ash | Clinker ash | Bottom ash | ||
| La | 120 ± 4 | 96 ± 3 | 60 ± 3 | 108 ± 3 | 15.5–134.4 |
| Ce | 208 ± 4 | 176 ± 3 | 141 ± 4 | 212 ± 4 | 30.7–266.4 |
| Pr | 29.0 ± 0.9 | 22.0 ± 0.6 | 12.5 ± 0.2 | 19.5 ± 0.4 | 3.3–29.8 |
| Nd | 68.2 ± 1.2 | 46.0 ± 1.2 | 63.0 ± 1.0 | 84.0 ± 1.4 | 12.7–114.7 |
| Sm | 20.3 ± 0.4 | 15.3 ± 0.3 | 16.6 ± 0.2 | 16.9 ± 0.3 | 2.8–22.9 |
| Eu | 4.30 ± 0.12 | 2.47 ± 0.10 | 0.80 ± 0.02 | 3.80 ± 0.20 | 0.56–6.3 |
| Gd | 9.9 ± 0.3 | 5.1 ± 0.3 | 13.1 ± 0.4 | 10.6 ± 0.2 | 2.85–30.7 |
| Tb | 2.50 ± 0.10 | 1.80 ± 0.06 | 1.90 ± 0.09 | 2.40 ± 0.06 | 0.45–4.7 |
| Dy | 14.0 ± 0.3 | 16.0 ± 0.5 | 13.5 ± 0.4 | 19.0 ± 0.4 | 2.61–25.1 |
| Ho | 2.50 ± 0.10 | 1.80 ± 0.08 | 2.50 ± 0.20 | 2.30 ± 0.15 | 0.59–4.5 |
| Er | 5.10 ± 0.20 | 6.50 ± 0.25 | 6.70 ± 0.15 | 4.5 ± 0.10 | 1.79–14 |
| Tm | 2.50 ± 0.10 | 1.70 ± 0.09 | 1.30 ± 0.09 | 0.90 ± 0.03 | 0.27–1.5 |
| Yb | 8.90 ± 0.30 | 5.40 ± 0.20 | 7.00 ± 0.15 | 7.2 ± 0.25 | 1.8–11 |
| Lu | 1.40 ± 0.05 | 1.10 ± 0.03 | 0.77 ± 0.01 | 0.94 ± 0.03 | 0.3–1.6 |
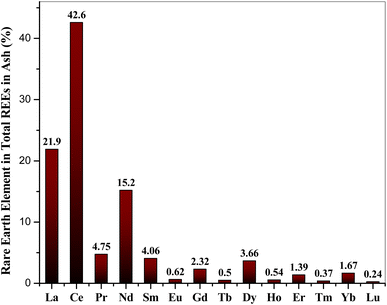
Lin et al., 2017 (ref. 34) suggested that the estimated cut-off grade for beneficial recovery of REEs in coal could be 115–130 mg kg−1 and 677–762 mg kg−1 on the ash basis. Coal combustion byproducts typically contain 200–500 mg kg−1 of REEs, with a global average of 445 mg kg−1 in coal fly ash. Based on this data, REEs in Indian fly ash is close to the beneficial recovery and falls in the world range.35 Among the REEs, the cerium (Ce) was found to be most abundant in all samples; its concentration varies from 41–44%, while lutetium (Lu) was found to be the least in the range of 0.19–0.28%. The abundance of individual REE with respect to the total REEs in the coal ash samples is shown in Fig. 9. The light REEEs (LREE) from La–Sm found dominance (86–90%) over the medium REEs (MREE) Eu–Dy (6.4–8.6%) and heavy REEs (HREE) Ho–Lu (3.2–5.4%).
3.2 Grouping of the coal ash samples by hierarchical clustering
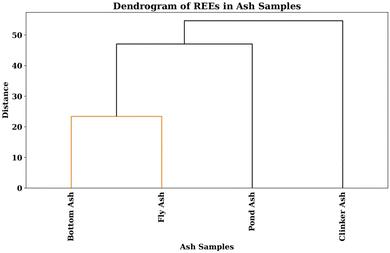
Hierarchical clustering, a powerful statistical technique, facilitates the systematic grouping of akin data points within a hierarchical framework. Within the Python code framework, this technique is realized through the utilization of a linkage matrix. A pivotal component of hierarchical clustering is the utilization of a distance metric, typically Euclidean distance, to quantify dissimilarity between data points. In the code, the Euclidean distances between every pair of data points are computed. In this specific implementation, the ‘single’ linkage method is employed. This linkage method computes the distance between clusters by assessing the minimum pairwise distance among the constituent data points within and between clusters. This approach encourages the emergence of elongated clusters, unveiling latent patterns within the data. The linkage matrix, a key outcome of the hierarchical clustering procedure, encodes the intricate hierarchy of formed clusters. At each iteration, this matrix delineates the clusters scheduled for amalgamation, detailing their inter-cluster distance and the count of data points encompassed within the resulting amalgamated cluster. The dendrogram, a graphical manifestation of the hierarchical clustering process, plays an integral role in conveying the clustering outcomes. It graphically represents the hierarchical relationships between ash samples based on their total content of REEs concentrations (Fig. 10). This dendrogram provides invaluable insights into the degree of similarity among ash samples, thereby enabling data-driven decision-making informed by the latent structure inherent in the dataset.In the specific dendrogram under consideration, a noteworthy observation is the complete isolation of the clinker ash sample from all other samples, signifying its distinctiveness. This distinction suggests that the distribution of REEs within the clinker ash sample significantly deviates from the distribution observed in the remaining samples. Within this dendrogram, an evident similarity emerges between the bottom ash and fly ash samples, as they are seen to unite at an early stage in the diagram. Progressing upward, the subsequent union links the clade containing the bottom and fly ash samples with the clade housing the pond ash sample. This structural arrangement conveys that all samples within this cluster exhibit greater similarity to each other compared to any samples connecting at higher dendrogram levels. Additionally, a notable inference arises from the positioning of the pond ash sample, which is found to be closer in similarity to the bottom and fly ash samples than to the clinker ash sample. A similar pattern has been observed with respect to the calculated total standard deviation also.
3.3 Leaching of REEs from coal ash using radioactive tracers
Leaching of REEs from coal ash has been carried out using radioactive isotopes formed by irradiating the sample into KAMINI reactor. Radiation detection methods are highly sensitive, rapid and assay could be carried out on direct solid samples unlike conventional analytical techniques. Thus, the irradiated coal ash samples were counted directly using HPGe detector to obtain the initial reference activities, which are normalized to the end of irradiation (EOI). The initial activity (AEOI) of the medium-lived REEs was determined, employing the efficiency of a point geometry source with 152Eu and by incorporating all the decay corrections.
 | (1.7) |
 | (1.8) |
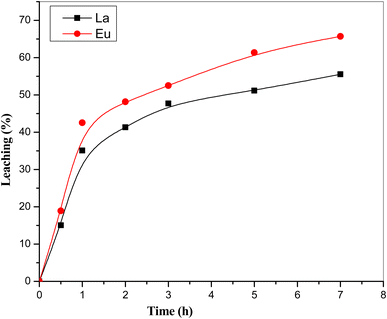
In the course of our investigation, it was observed that among the diverse medium-lived REEs, specifically La with 55–60% and Eu with 65–70%, were found to be present in the leached fraction of the sample in the detection range as shown in Fig. 11. Conversely, all other REEs were detected at levels lower than the detection limit of our analytical methodology due to lower counting time. Following the leaching process, the remaining sample was subjected to a thorough drying procedure and subsequently packed in a consistent geometric configuration and subjected to analyse by the same detector. The analysis of the remaining activity associated with the medium-lived REEs was performed and the results have been presented in Table 4.
| Element | Activity (Bq) | % Leaching | |
|---|---|---|---|
| Before leaching | After leaching | ||
| La | 1.443 | 0.589 | 59.2 |
| Ce | 0.007 | 0.004 | 51.3 |
| Pr | 0.799 | 0.356 | 55.4 |
| Nd | 0.012 | 0.004 | 64.0 |
| Sm | 1.383 | 0.578 | 58.2 |
| Eu | 33.26 | 12.46 | 62.6 |
| Yb | 0.185 | 0.073 | 60.6 |
| Lu | 0.036 | 0.019 | 48.4 |
It is worth noting that the data from Table 4 reveal a substantial leaching efficiency for the medium-lived REEs in the presence of 8 M HCl. Specifically, it was observed that the leaching process facilitated the removal of approximately 50–70% of the medium-lived REEs isotopes from the sample with the uncertainty ±5%, thereby indicating the efficacy of 8 M HCl as a leaching agent in this context. Similar study has been carried out with 4 M HCl also and found the almost same leaching pattern. These leaching parameters like leaching time and concentration of HCl were fixed as per the Shanshan Cao et al.21 The results on leaching behaviour using the radioactive tracer technique were in good agreement with the reported literature by Shanshan Cao et al.21 However, the study22 was limited to report the leaching behaviour of only three REEs i.e. La, Ce and Nd, whereas the present study could explore eight REEs including Pr, Sm, Eu, Yb and Lu. Thus, the present study established the strengths of radioactive tracer method, which is highly sensitive, rapid and independent of sample physical state (solid/liquid). These findings shed light on the behaviour of these REEs in the leaching process and contribute valuable insights to our understanding of their chemical interactions and separations.
4 Conclusions
The study involved the objective of quantifying the content of REEs in coal samples using NAA coupled with the Westcott formalism. Coal fly ash samples from different thermal power plants in India were utilized, and high-resolution gamma spectrometry was employed to quantify the REE content of the samples. By coupling the internal standard and in situ relative detector efficiency strategies, the analytical precision and accuracy in the assessment of REE concentrations in complex matrices are substantially enhanced, facilitating a more comprehensive and reliable characterization of these critical elements. Westcott factor play a crucial role in estimating the elemental concentrations of REEs, providing insights into the neutron capture characteristics of these nuclides. This scientific approach allows for a more accurate understanding of neutron interactions with REEs and their subsequent quantification. This scientific investigation highlights the challenges posed by spectral interferences in gamma-ray spectroscopy and provides insights into the correction methods employed to ensure accurate quantification. The study found that the individual REEs concentration varied from 0.7 mg kg−1 to 210 mg kg−1. The LREE found dominance over the MREE and heavy HREE. The results of this study could aid in the development of eco-friendly and sustainable technological advancements by providing a better understanding of the REE content in coal ash samples. This study provides valuable insights into the leaching behaviour using radioactive tracer of medium-lived REEs from coal ash, contributing to our understanding of REE recovery and utilization from this unconventional source.Data availability
The data that support the findings of this study are available at https://www.nndc.bnl.gov/endf and in the ref. 27–31.Conflicts of interest
All co-authors have gone through and agreed with the contents of the manuscript and there is no conflict of interest to declare.Acknowledgements
Authors sincerely thank to the reactor engineers of KAMINI reactor for their valuable support towards the irradiation experiments. We also acknowledge the support and help rendered by health physicists and reactor physicists of IGCAR with the radiation dose measurements of irradiated samples.References
- E. Alonso, A. M. Sherman, T. J. Wallington, M. P. Everson, F. R. Field, R. Roth and R. E. Kirchain, Evaluating rare earth element availability: A case with revolutionary demand from clean technologies, Environ. Sci. Technol., 2012, 46, 3406–3414 CrossRef CAS PubMed.
- T. Dutta, K.-H. Kim, M. Uchimiya, E. E. Kwon, B.-H. Jeon, A. Deep and S.-T. Yun, Global demand for rare earth resources and strategies for green mining, Environ. Res., 2016, 150, 182–190 CrossRef CAS PubMed.
- B. Zhou, Z. Li and C. Chen, Global potential of rare earth resources and rare earth demand from clean technologies, Minerals, 2017, 7, 203 CrossRef.
- J. C. K. Lee and Z. Wen, Pathways for Greening the Supply of Rare Earth Elements in China, Nat. Sustain., 2018, 1, 598–605 CrossRef.
- P. Klossek, J. Kullik and K. G. van den Boogaart, A systemic approach to the problems of the rare earth market, Resour. Policy, 2016, 50, 131–140 CrossRef.
- M. A. Alvin, Netl Rare Earth Elements from Coal & Coal by-Products Program Overview, 2017, https://www.netl.doe.gov/Sites/Default/Files/Netl-File/20170322_Plenary-2_Netl_Alvin.Pdf.
- B. E. Erickson, From Coal, a New Source of Rare Earths, Chem. Eng. News, 2018, 96, 28 Search PubMed.
- Y. H. Law, Radioactive Waste Standoff Could Slash High Tech's Supply of Rare Earth Elements, Science, 2019, 1, 2019 Search PubMed.
- K. R. Long, B. S. Van Gosen, N. K. Foley, and D. Cordier, The Principal Rare Earth Elements Deposits of the United States: A Summary of Domestic Deposits and A Global Perspective, in Non-Renewable Resource Issues, Springer, 2012, pp. 131−155 Search PubMed.
- R. S. Blissett, N. Smalley and N. A. Rowson, An investigation into six coal fly ashes from the United Kingdom and Poland to evaluate rare earth element content, Fuel, 2014, 119, 236–239 CrossRef CAS.
- https://www.usgs.gov/centers/national-minerals-information-center/rare-earths-statistics-and-information.
- J. F. King, R. K. Taggart, R. C. Smith, J. C. Hower and H. Hsu-Kim, Aqueous acid and alkaline extraction of rare earth elements from coal combustion ash, Int. J. Coal Geol., 2018, 195, 75–83 CrossRef CAS.
- R. Honaker, J. Hower, C. Eble, G. Weisenfluh, J. Groppo, M. Rezaee, A. Bhagavatula, G. H. Luttrell, R. C. Bratton, M. Kiser, and R. H. Yoon, Laboratory and Bench-Scale Testing for Rare Earth Lements, 2014, vol. 724, pp. 554–3652 Search PubMed.
- B. W. Stewart, R. C. Capo, B. C. Hedin and R. S. Hedin, Rare earth element resources in coal mine drainage and treatment precipitates in the Appalachian Basin, USA, Int. J. Coal Geol., 2017, 169, 28–39 CrossRef CAS.
- W. Zhang, M. Rezaee, A. Bhagavatula, Y. Li, J. Groppo and R. Honaker, A review of the occurrence and promising recovery methods of rare earth elements from coal and coal by-products, Int. J. Coal Prep. Util., 2015, 35, 295–330 CrossRef CAS.
- W. Zhang and R. Q. Honaker, Rare earth elements recovery using staged precipitation from a leachate generated from coarse coal refuse, Int. J. Coal Geol., 2018, 195, 189–199 CrossRef CAS.
- W. Zhang, R. Honaker and J. Groppo, Concentration of rare earth minerals from coal by froth flotation, Miner. Metall. Process., 2017, 34, 132–137 Search PubMed.
- M. Chand, R. Senthilvadivu and J. S. B. Rao, et al., Elemental characterization of coal fly ash using k0-based IM-NAA and EDXRF towards its potential utilization and environmental concern, J. Radioanal. Nucl. Chem., 2020, 324, 1089–1097 CrossRef CAS.
- R. Q. Honaker, W. Zhang and J. Werner, Acid Leaching of Rare Earth Elements from Coal and Coal Ash: Implications for Using Fluidized Bed Combustion To Assist in the Recovery of Critical Materials, Energy Fuels, 2019, 33, 5971–5980 CrossRef CAS.
- T. Praharaj, M. A. Powell, B. R. Hart and S. Tripathy, Leachability of elements from sub-bituminous coal fly ash from India, Environ. Int., 2002, 27, 609–615 CrossRef CAS PubMed.
- S. Cao, C. Zhou, J.-h Pan, C. Liu, M. Tang, W. Ji, T. Hu and N. Zhang, Study on influence factors of leaching of rare earth elements from coal fly ash, Energy Fuels, 2018, 32(7), 8000–8005 CrossRef CAS.
- C. R. Borra, et al., Leaching of rare earths from bauxite residue (red mud), Miner. Eng., 2015, 76, 20–27 CrossRef CAS.
- J. F. King, et al., Aqueous acid and alkaline extraction of rare earth elements from coal combustion ash, Int. J. Coal Geol., 2018, 195, 75–83 CrossRef CAS.
- X. Feng, et al., Kinetics of rare earth leaching from roasted ore of bastnaesite with sulfuric acid, Trans. Nonferrous Met. Soc. China, 2013, 23(3), 849–854 CrossRef CAS.
- M. Chand, S. Bagchi and J. S. B. Rao, et al., Characterization of neutron spectrum parameters in PFTS irradiation channel of KAMINI reactor and validation of Westcott formalism using k0 IM-NAA, J. Radioanal. Nucl. Chem., 2023, 332, 4325–4333 CrossRef CAS.
- Y. Yao, C. Xiao, P. Wang, C. Li and Q. Zhou, Instrumental Neutron Activation Analysis of Chang'E-5 Lunar Regolith Samples, J. Am. Chem. Soc., 2022, 144(12), 5478–5484 CrossRef CAS PubMed.
- F. D. Corte, A. Simonits, F. Bellemans, M. C. Freitas, S. Jovanovic, B. Smodis, G. Erdtmann, H. Petri and A. De Wispelaere, Recent advances in the k0-standardization of neutron activation analysis: extensions, applications, prospects, J. Radioanal. Nucl. Chem., 1993, 169, 125–158 CrossRef.
- F. De Corte, F. Bellemans, P. De Neve and A. Simonits, The use of a modified Westcott-formalism in the k0-standardization of NAA: The state of affairs, J. Radioanal. Nucl. Chem., 1994, 179, 93–103 CrossRef CAS.
- F. De Corte, The standardization of standardless NAA, J. Radioanal. Nucl. Chem., 2001, 248, 13–20 CrossRef CAS.
- F. De Corte and A. Simonits, k0-Measurements and related nuclear data compilation for (n, γ) reactor neutron activation analysis, J. Radioanal. Nucl. Chem., 1989, 133, 43–130 CrossRef CAS.
- F. De Corte and A. Simonits, Recommended nuclear data for use in the k0 standardization of neutron activation analysis, At. Data Nucl. Data Tables, 2003, 85, 47–67 CrossRef CAS.
- A. G. C. Nair, R. Acharya, K. Sudarshan, S. Gangotra, A. V. R. Reddy, S. B. Manohar and A. Goswami, Development of an Internal Monostandard Instrumental Neutron Activation Analysis Method Based on In Situ Detection Efficiency for Analysis of Large and Nonstandard Geometry Samples, Anal. Chem., 2003, 75, 4868–4874 CrossRef CAS PubMed.
- H. Bounouira, K. Embarch, H. Amsil, M. Bounakhla and M. Blaauw, Neutron flux characterization of the Moroccan Triga Mark II research reactor and validation of the k0 standardization method of NAA using k0-IAEA program, J. Radioanal. Nucl. Chem., 2014, 300, 465–471 CrossRef CAS.
- R. Lin, B. H. Howard, E. A. Roth, T. L. Bank, E. J. Granite and Y. Soong, Enrichment of rare earth elements from coal and coal by-products by physical separations, Fuel, 2017, 200, 506–520 CrossRef CAS.
- P. Sandeep, S. Maity, S. Mishra, D. K. Chaudhary, C. B. Dusane, A. kumar S. Pillai and A. Vinod Kumar, Estimation of rare earth elements in Indian coal fly ashes for recovery feasibility as a secondary source, Fuel, 2014, 119, 236–239 CrossRef.
| This journal is © The Royal Society of Chemistry 2024 |

