
 Open Access Article
 This Open Access Article is licensed under a Creative Commons Attribution-Non Commercial 3.0 Unported Licence
Three CoS/CoO microspheres and their mixed matrix membranes for the highly efficient photocatalytic degradation of methyl blue†
Yuping Huoab,
Tanlai Yu *ab,
Yueyuan Xueab,
Guoshuai Zhangab,
Shengxin Songa,
Yonghua Shaoa and
Xiaojing Hanab
*ab,
Yueyuan Xueab,
Guoshuai Zhangab,
Shengxin Songa,
Yonghua Shaoa and
Xiaojing Hanab
aDepartment of Chemical and Materials Engineering, Lyuliang University, Lishi, Shanxi 033001, China. E-mail: tlyu@llu.edu.cn; Tel: +86 358 2274299
bInstitute of New Carbon-based Materials and Zero-carbon and Negative-carbon Technology, Lyuliang University, Lishi, Shanxi 033001, China
First published on 16th August 2024
Abstract
Photocatalytic degradation technology, as one of the most important advanced oxidation technologies for environmental remediation, has attracted great attention in recent years, but designing photocatalysts with excellent photocatalytic activity and good reusability remains a challenge. Herein, three CoS/CoO microspheres (CoS/CoO-M-1 (1), CoS/CoO-M-2 (2), and CoS/CoO-M-3 (3)) were prepared via a hydrothermal method using cobalt chloride hexahydrate, thiourea, deionized water and polyethylene glycol (PEG) with different polymerization degrees as raw materials, which have a uniform size distribution in the range of 5–24 μm and specific surface areas of 6.1924 m2 g−1 (1), 6.2870 m2 g−1 (2) and 6.6663 m2 g−1 (3). It is worth noting that all the three CoS/CoO microspheres showed a wide optical absorption range from the ultraviolet to the near-infrared (NIR) region and a high photocatalytic activity for degrading methyl blue under visible light (500 W metal halide lamp) irradiation. In order to improve the portability and recyclability of 3, a mixed matrix membrane (MMM) of 3 (3-MMM) was manufactured by coating a mixture dispersion of 3 and polyvinylidene fluoride (PVDF) on a glass substrate, which not only displayed excellent photocatalytic degradation performance, but also showed good portability and reusability (cycles > 12 times). Furthermore, adsorption and photocatalytic kinetics and possible mechanisms were studied.
1 Introduction
Nowadays, with the rapid development of textile industry, a large quantity of wastewater containing organic dyes has been produced, which constitute 20% of the industrial water pollution in the world.1,2 These organic dyes in wastewater are chemically stable, highly toxic and difficult to directly biodegrade, which once released into the environment can cause various environmental problems.3 Thus far, although various physical and chemical treatment technologies have been developed to eliminate the toxicity of wastewater, these technologies cannot completely decompose organic pollutants in industrial wastewater, and only transfer the pollutants from one state to the other, and even generate secondary pollutants.4–6 Recently, advanced oxidation technologies, such as photocatalytic degradation technology (PDT), have been considered as one of the most eco-friendly and efficient methods for purifying wastewater because of their strong oxidation ability, non-toxicity and low cost.7–9 However, a large number of photocatalysts with single components (such as metal oxides, metal sulfides, MOFs, and g-C3N4) or their composite components have been developed and reported successfully by esteemed investigators, but how to rationally design and fabricate of photocatalytic materials with excellent photocatalytic activity under simulated sunlight irradiation and good reusability is still a challenge, which severely limits the practical application of photocatalysis.10–13Thus far, compared with single-component photocatalysts, the construction of composite photocatalysts has been demonstrated to be one of the most efficient methods to enhance the photocatalytic activity under visible light irradiation.14 CoO has gained extensive interest in photocatalysis owing to its narrow band gap (2.4 eV), wide visible-light response, low cost and earth-abundance; however, it displays a weak photocatalytic performance due to rapid e−/h+ pair recombination.15 Similarly, CoS was also considered an attractive photocatalyst considering its excellent photoelectric properties, but it displays a large optical band gap (3.2 eV), poor visible-light absorption capacity, and rapid e−/h+ pair recombination.15,16 Hence, taking into consideration that CoO and CoS are both cobalt compounds and their special properties, a CoS/CoO composite photocatalyst with more excellent photocatalytic activity under visible light irradiation can be expected by modulating their structure, size or morphology, but the latter has little been considered. Meanwhile, the portability and recyclability are also required for practical application scenarios, but the powdery crystal photocatalysts are inconvenient to carry or recycle.17 It seems to be a good solution to fabricate a mixed matrix membrane (MMM) based on crystal photocatalysts and polymer matrixes.18 The flexible and self-supporting MMM can be easily tailored, carried, and conveniently removed from water, thus possessing many merits including processibility, portability and recyclability, which will facilitate the practical application of crystal photocatalysts. However, to the best of our knowledge, the MMM strategy has not been used in the synthesis of CoS/CoO/polymer membranes.19
Inspired by the above-mentioned factors, three CoS/CoO microspheres, namely, CoS/CoO-M-1 (1), CoS/CoO-M-2 (2), and CoS/CoO-M-3 (3) and 3-MMM were prepared and characterized. Interestingly, they displayed a wide optical absorption range from the ultraviolet, visible to the near-infrared region, and are full-solar range responsive photocatalysts, which could realize the photocatalytic degradation of methyl blue under visible light irradiation. In particular, 3-MMM showed not only excellent photocatalytic degradation performance, but also good portability and recyclability (cycles > 12 times). Furthermore, the adsorption and photocatalytic kinetics and possible mechanism were investigated.
2 Experiment section
2.1 Reagents and instruments
In this study, CoCl2·6H2O, thiourea, polyethylene glycol 200 (PEG-200), PEG-400, absolute ethanol, dimethylformamide (DMF), isopropyl alcohol (IPA), benzoquinone (BQ), ethylenediaminetetraacetic acid (EDTA) and polyvinylidene fluoride (PVDF) were used directly without purification. The crystal phase of the samples was detected using an XD-2 X-ray diffractometer (XRD). X-ray photo-electron spectroscopy (XPS) was performed using an Axis Ultra-DLD X-ray photoelectron spectrometer. Morphologies and elemental analyses were conducted using a JSM-6010 Plus scanning electron microscope equipped with EDS. The particle size of 1–3 was analysed using an HYL-1076 laser particle size distribution analyzer. The UV-vis-NIR absorption spectrum of the sample was recorded using a UV-3600 Plus UV-vis-NIR spectrophotometer.![[thin space (1/6-em)]](https://www.rsc.org/images/entities/char_2009.gif) :V(PEG 200) = 4:1) and stirred for more than 0.5 h. Then, it was subjected to a hydrothermal reaction at 180 °C for 16 h, and the precursor products were obtained by centrifugation and washed with water and alcohol. The final products were then obtained by grinding and calcining at 700 °C in air for 1 h.
:V(PEG 200) = 4:1) and stirred for more than 0.5 h. Then, it was subjected to a hydrothermal reaction at 180 °C for 16 h, and the precursor products were obtained by centrifugation and washed with water and alcohol. The final products were then obtained by grinding and calcining at 700 °C in air for 1 h.2.2 Photoelectric measurements and photocatalytic activity evaluation
Photoelectrochemical studies of the title samples were conducted using a CHI660E electrochemical workstation equipped with a three-electrode cell. Here, sample-modified ITO, a Pt wire and a Ag/AgCl electrode were used as the working, auxiliary and reference electrodes, respectively. To prepare the working electrode, 5 mg of microcrystalline powder was first added into a mixed solution containing 50 μL of Nafion and 420 μL of ethanol, which was then subjected to ultrasonic treatment for 30 min. Following this, the obtained suspensions were dropped onto a clean ITO substrate with an effective area of 1.0 cm2 (1 cm × 1 cm). A 0.1 mol per L KCl aqueous solution (50 mL) was used as the supporting electrolyte solution, and a 300 W Xe lamp was used to simulate the sunlight illumination source. The Xe lamp irradiation interval was set at about 20 seconds. Electrochemical impedance spectroscopy (EIS) was performed under the same conditions.The photocatalytic activities of 1, 2, 3 and 3-MMM were evaluated via the photodegradation of methyl blue dye using a multi-channel parallel photocatalytic reaction system with a 500 W metal halide lamp as the light source (NAI-GHY-DGNKW, Shanghai Nai Experimental Instrument Co., Ltd, China). Samples 1, 2, 3 and 3-MMM (containing 20 mg powder sample) were placed in a test tube, immersed in 20 mL aqueous solution containing contaminants (80 mg L−1) of methyl blue, and stirred for 60 min in the dark to establish the adsorption–desorption equilibrium. At every 10 minutes of irradiation time, six parallel suspension solutions of 1, 2 or 3 were centrifuged and analyzed individually, while 3-MMM was tested directly without centrifugation using a UV-vis spectrophotometer.
3 Results and discussion
3.1 Structural characterization
The crystal structures and phase purity of as-synthesized 1, 2, 3 and 3-MMM were analyzed using X-ray diffraction (Fig. 1). As shown in Fig. 1a, the two characteristic diffraction peaks at 30.86° and 35.50° represent the Bragg reflection from the (100) and (101) planes of the hexagonal phase of CoS (JCPDS card no. 65-0407), respectively.20,21 Both 43.56° and 64.55° are also consistent with JCPDS card no. 65-0407. The three characteristic diffraction peaks (2b) at 34.15°, 57.3° and 71.9° are also similar to the three characteristic peaks of CoO (JCPDS card no. 42-1300, Fig. 1b).22,23 The above results indicate the coexistence of CoS and CoO phases in as-synthesized 1, 2 and 3. Meanwhile, it can be seen from Fig. 1 that 1, 2 and 3 prepared from PEG solvents with different degrees of polymerization are not very similar,24 and the crystallization degree of sample 3 is better than that of samples 1 and 2. It is obvious that the diffraction intensities of the primary peaks increase with the addition of PEG-400.25 In addition, the XRD pattern of 3-MMM revealed the maintenance of the crystal structures and phase purity of 3 in the PVDF matrix (Fig. S1†).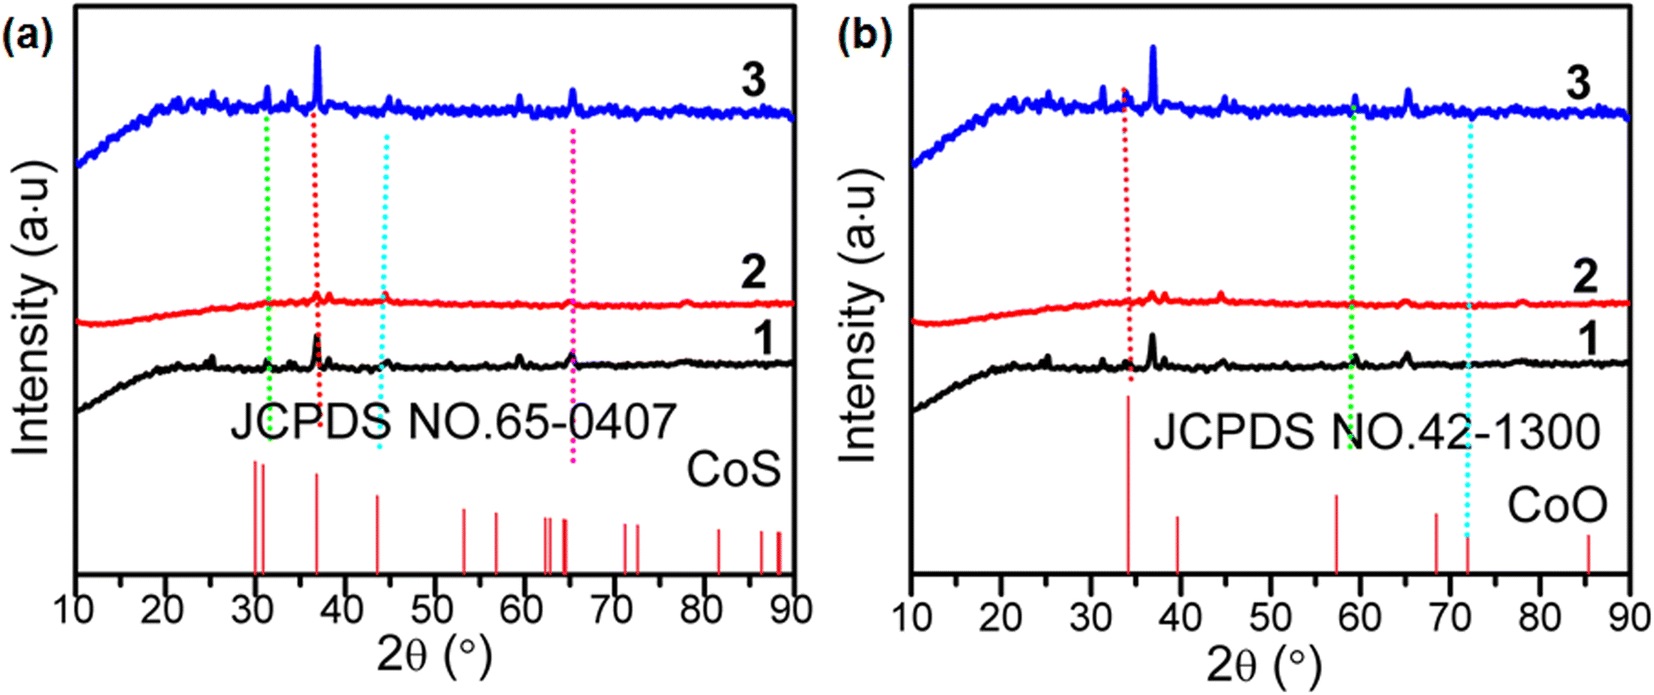 | ||
| Fig. 1 (a) XRD patterns of CoS and 1–3. (b) XRD patterns of CoO and 1–3. | ||
The composition and elemental valence of 3 as a representative microsphere were further investigated by the XPS technique. It can be seen from Fig. 2a that the survey spectra of 3 clearly disclose the characteristic peaks of C 1s, Co 2p, O 1s and S 2p, which also indicates that these elements exist in 3. The fitted peaks of Co 2p and O 1s of 3 are shown in Fig. 2b and c. For the Co 2p spectrum (Fig. 2b), the peaks at 780.9 eV and 796.05 eV can be attributed to Co 2p3/2 and Co 2p1/2, which also proves the presence of Co2+ in 3.26 It is known that the oxidation state of cobalt oxide in XPS can be characterized by the gap between the Co 2p3/2 peak and the Co 2p1/2 peak and by intense shake-up peaks from the spin–orbit components.27 The binding energy splitting between Co 2p3/2 and Co 2p1/2 was approximately 15.15 eV. This indicated that 3 consists of CoS and CoO, which matches well with the XRD results shown in Fig. 1. Fig. 2c shows the high-resolution XPS spectrum of O 1s in 3. The O 1s spectrum of 3 is deconvoluted into three peaks at 530.86 eV, 532.15 eV and 533.19 eV, the Co–O bond at 530.86 eV, and the chemical shift at 532.15 eV and 533.19 eV can be attributed to C–OH and adsorbed H2O, respectively.28,29 It was also found that the binding energies of S 2p1/2 and S 2p3/2 are 162.84 eV and 161.65 eV respectively (Fig. 2d), indicating that S2− exists in 3.26,30 Meanwhile, Fig. 2d shows the S 2p spectrum and the well-resolved peaks are in good agreement with the binding energies of S 2p in cobalt sulfide.27,30 As shown in Fig. S2,† the survey spectra of 3-MMM also mainly contain four elements, namely C, O, S and Co, which is consistent with 3. However, the XPS peak strength of the Co element in 3-MMM is lower than that of the Co element in 3, which is attributed to the less content of 3 in the PVDF matrix. These results further confirmed that the crystal structure of 3 in the PVDF matrix is basically unchanged.
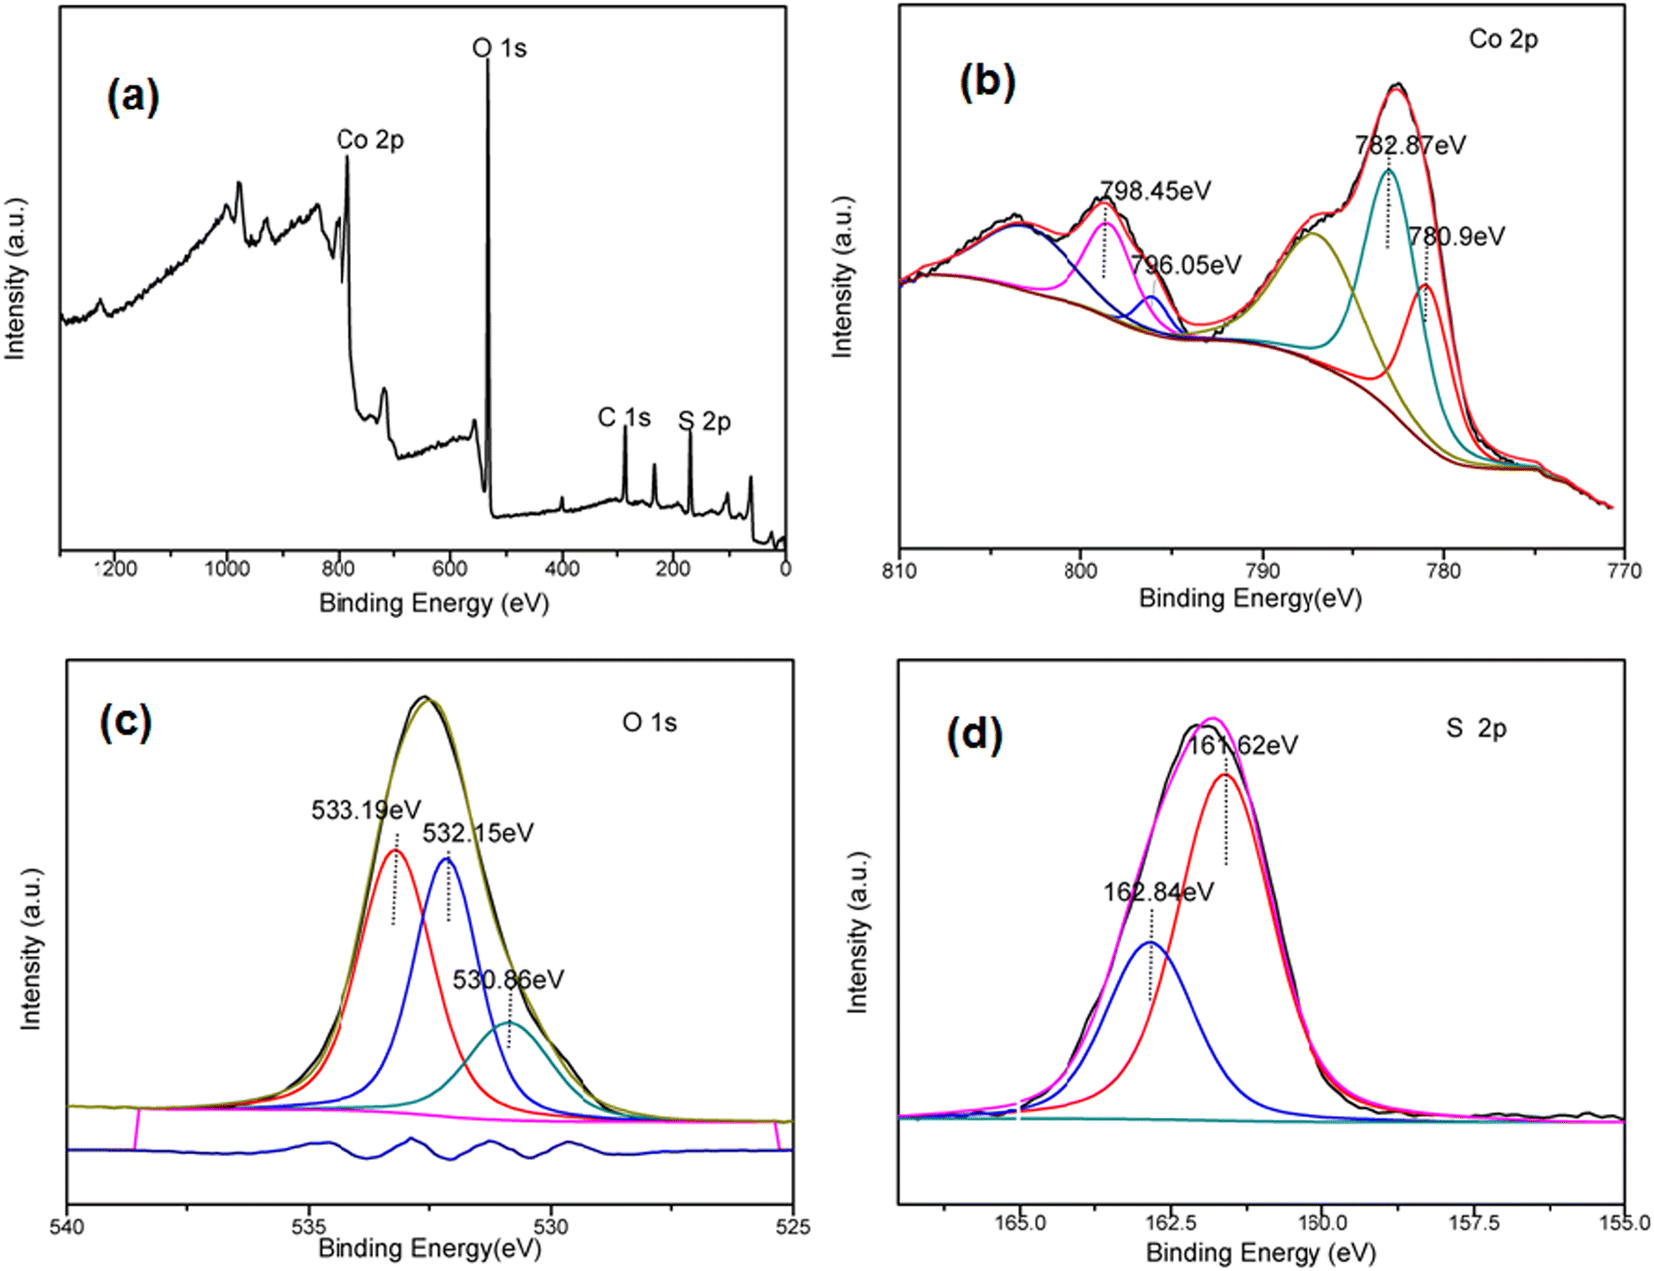 | ||
| Fig. 2 XPS spectra of 3: (a) survey spectra of 3; (b) Co 2p XPS spectra; (c) O 1s XPS spectra; and (d) S 2p XPS spectra. | ||
The morphological features of 1, 2 and 3 at 5 μm and 10 μm were analyzed by scanning electron microscopy (SEM). It can be seen from Fig. 3 that the morphology of 1, 2 and 3 with different solvents is not the same. The surface of 1 is rough with burrs, like the small burrs of “litchi”, and has uneven size distribution and serious aggregation.31,32 The surface of 2 is slightly rough, and has different sizes and relatively uniform distribution, among which the small number of microspheres are aggregated (Fig. 3b and b-1). The structures of 3 are like flowers with different sizes, uneven distribution and aggregation (Fig. 3c and c-1).33,34 However, the SEM images of 3-MMM reveals that there is little morphological difference between the sample 3 in 3-MMM and the as-prepared sample 3, which is probably due to the stirring for a long time in the film-making process (Fig. S3a†). In addition, the elemental compositions of 1, 2, 3 and 3-MMM were analyzed via EDS elemental mapping (Fig. 3a-2–a-4, b-2–b-4, c-2–c-4 and S3b†), indicating the homogeneous distribution of Co, O and S elements, and that no other elements are present.35
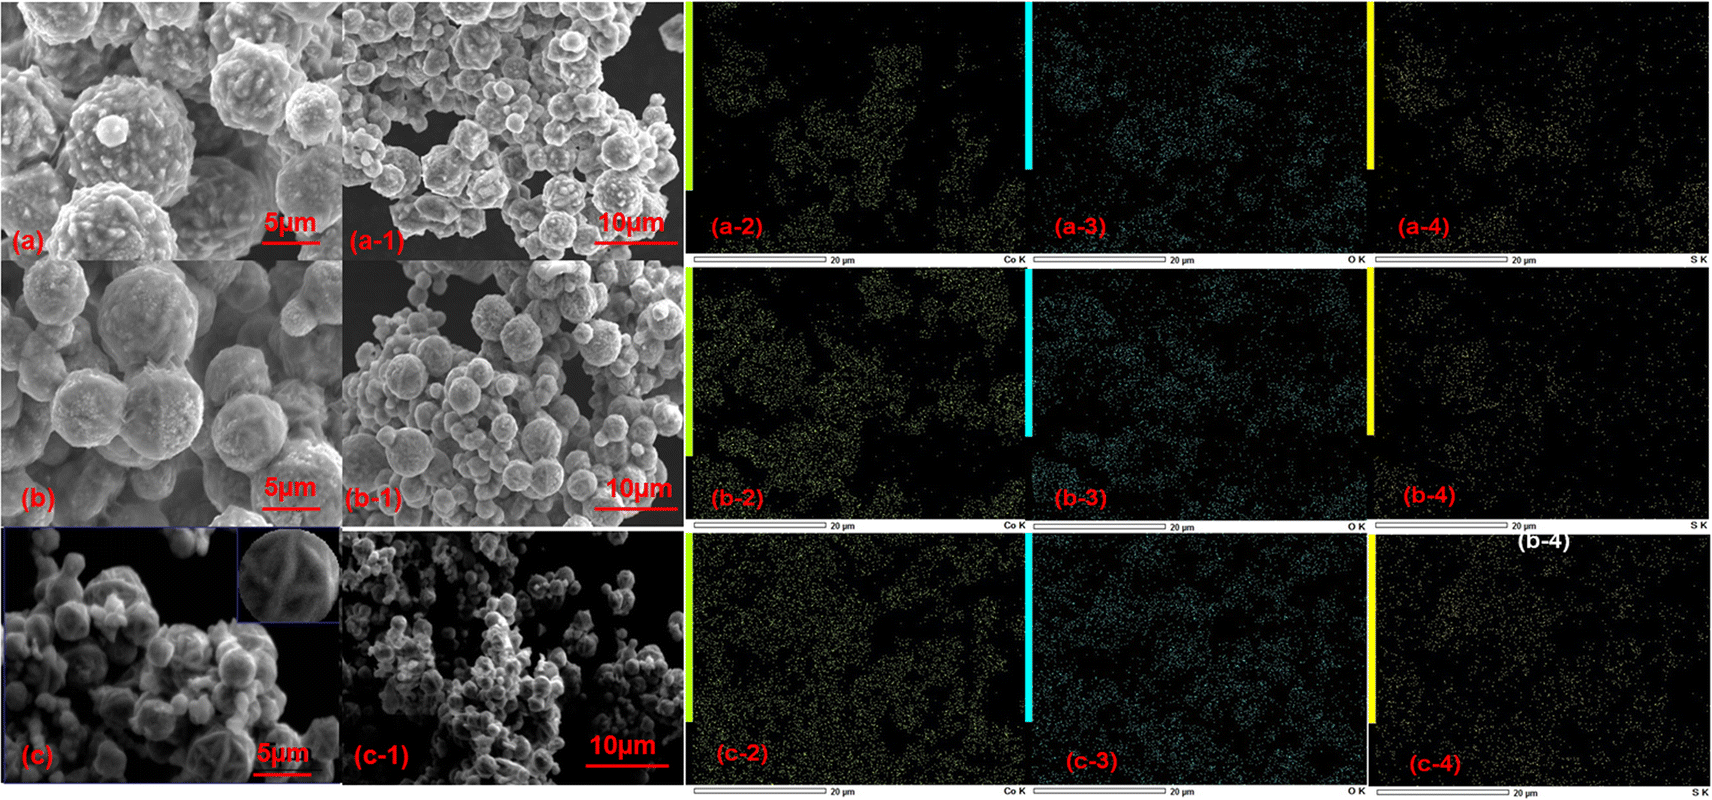 | ||
| Fig. 3 ((a), (a-1), (a-2), (a-3) and (a-4)) SEM and EDS mappings of 1 respectively. ((b), (b-1), (b-2), (b-3) and (b-4)) SEM and EDS mappings of 2 respectively. ((c), (c-1), (c-2), (c-3) and (c-4)) SEM and EDS mappings of 3 respectively. | ||
Furthermore, the particle size and specific surface area of 1, 2 and 3 were analyzed using a laser particle size distribution analyzer. As shown in Fig. S4,† the particle size of 1, 2 and 3 are mainly distributed between 2 and 20 μm, and the average particle size is related to the polymerization degree of PEG ranging from 8.61 to 12.63 μm (ref. 36) (12.63 μm (1), 9.60 μm (2), and 8.61 μm (3), respectively). The specific surface areas of the three samples are 544.1 m2 m−3 (1), 728.76 m2 m−3 (2) and 811.32 m2 m−3 (3), respectively. Notably, with the increase in the polymerization degree of solvent PEG, the particle size of microsphere becomes smaller and smaller, and their specific surface area becomes higher and higher. Furthermore, N2 adsorption and desorption experiments were carried out on samples 1, 2 and 3 at 77 K and the specific surface areas of 1, 2 and 3 were tested (Fig. S5†), the resulting BET surface areas of three samples are 6.1924 m2 g−1, 6.2870 m2 g−1 and 6.6663 m2 g−1, respectively, which is consistent with the law tested using a HYL-1076 laser particle size distribution analyzer (specific surface area: 3 > 2 >1). When the relative pressure p/p0 varies between 0.4 and 1.0, the nitrogen isothermal adsorption–desorption curve has a relatively obvious jump, and the samples also have hysteresis loops in the shape of small shuttles, and the curves of 1, 2 and 3 are similar.
3.2 Optical characterization
The optical absorption properties of the as-synthesized black CoS/CoO microspheres were analyzed by UV-vis-NIR diffuse reflectance spectroscopy. From Fig. 4a, we can clearly see that 1, 2 and 3 have a wide absorption range from the ultraviolet and visible regions to the NIR region, and an absorption edge up to about 1800 nm, which are in accordance with their dark appearance, and are favorable for full-solar-range-driven photocatalysis. According to the previous study, the band gaps (Eg) of the samples could be estimated by the plot of (αhν)2 versus photon energy (hν). As shown in Fig. 4b, the Eg values of 1, 2 and 3 were estimated to be 0.39, 0.70, and 0.97 eV, respectively (Fig. 4b), which are lower than the most reported Eg values of CoO (2.4 eV), CoS (3.2 eV), other single components (such as metal oxides, metal sulfides, MOFs, and g-C3N4) or their composite components.37–39 The above-mentioned results show that the three CoS/CoO microspheres can be activated by visible light irradiation, and can greatly enhance their photocatalytic activity.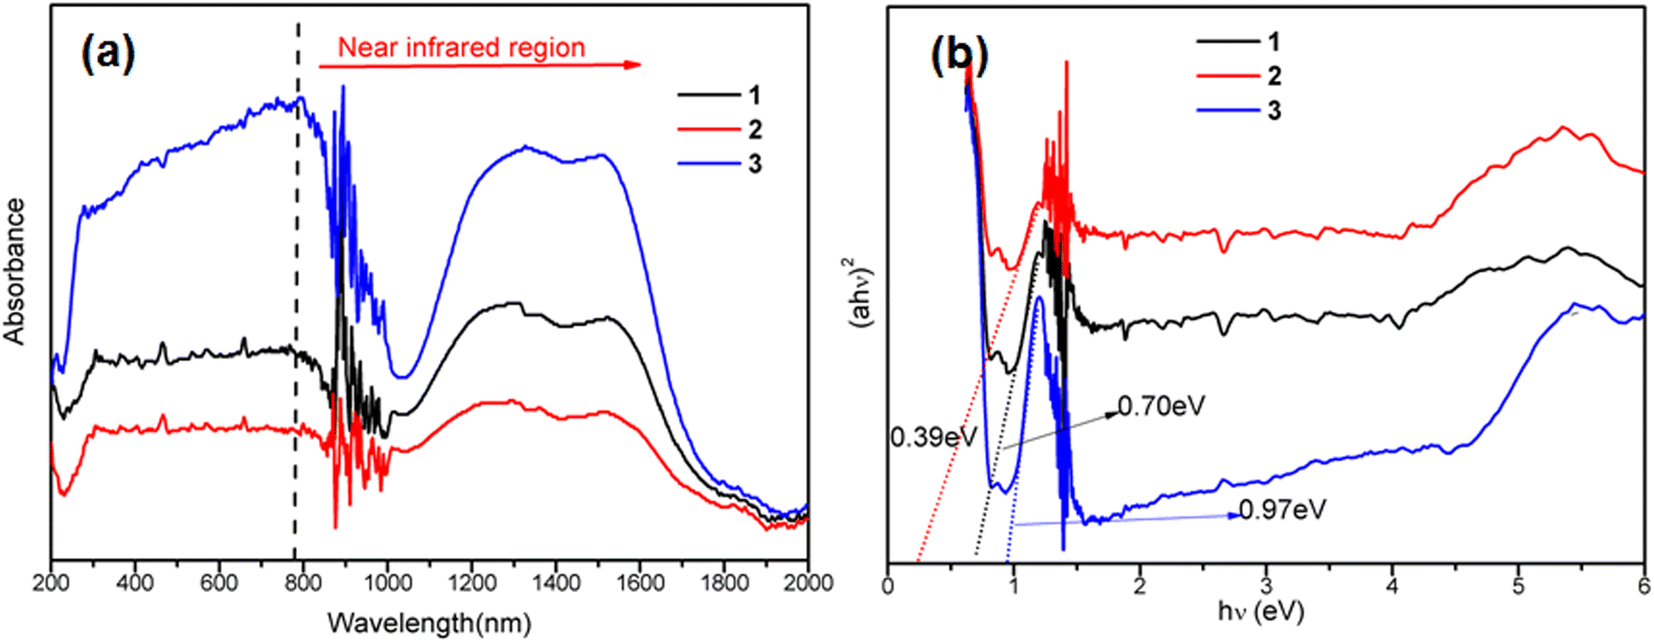 | ||
| Fig. 4 (a) Solid-state UV-vis-NIR absorption spectra of 1, 2 and 3. (b) Plots of (αhv)2 versus photon energy (hv) for the bandgap energies of 1, 2 and 3. | ||
3.3 Photoelectric measurements
The optical bandgaps of title samples fall in the visible region, which encouraged us to further study their photocurrent response abilities that were generally used to evaluate the suitability as promising photocatalytic materials. The time-dependent photocurrent curves of title samples were recorded, as shown in Fig. 5a. As can be clearly seen, samples 1–3 exhibited the fast and obvious photoelectric switching behaviors at the beginning and end of illumination. Even after the multiple cycles, their on/off photocurrent response ratios did not decrease significantly, accounting for the good operation stabilities and performance reproducibilities. Under the visible light conditions, the photocurrent density of sample 3 was 37.5 nA cm−2, which was better than those of samples 1 and 2 (25.0 and 12.5 nA cm−2, respectively). In general, the high photocurrent densities indicated that the obtained materials have a better carrier transport efficiency, which have often appeared in the cases of some previous work.40,41 As shown in Fig. 5b, the electrochemical impedance spectroscopy (EIS) results indicate that 3 has a smallest radius of Nyquist plot, which results in a lower charge transfer resistance of 3 than those of 1 and 2. In short, the photogenerated charge and migration efficiency of 3 are higher than those of 1 and 2, which is consistent with the results of photocurrent.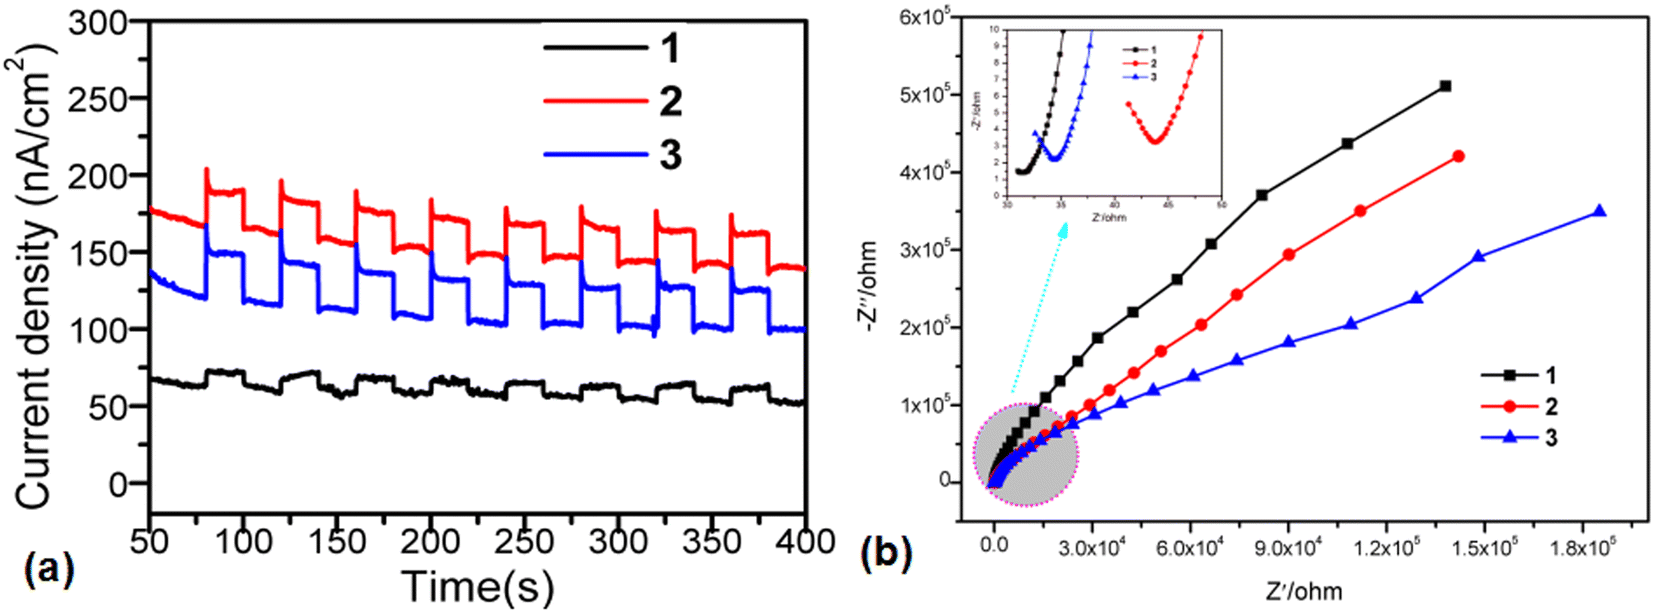 | ||
| Fig. 5 (a) Photocurrent response behavior of 1, 2 and 3. (b) Electrochemical impedance spectra (EIS) of 1, 2 and 3. | ||
3.4 Photocatalytic activity for MB degradation
Inspired by the structural characteristics and the narrow band gap of the title samples, methyl blue (MB) was selected as a model pollutant to study their photocatalytic activities.In order to easily describe the process of sample adsorption and photocatalytic degradation of methyl blue solution, the decontamination efficiency can be expressed as
 | (1) |
The reaction kinetics of the adsorption and photocatalytic degradation of methyl blue solution was found to follow a pseudo-first-order kinetics, as the plot of ln(C0/Ct) against the time fits a linear relationship according to the following equation:42
 | (2) |
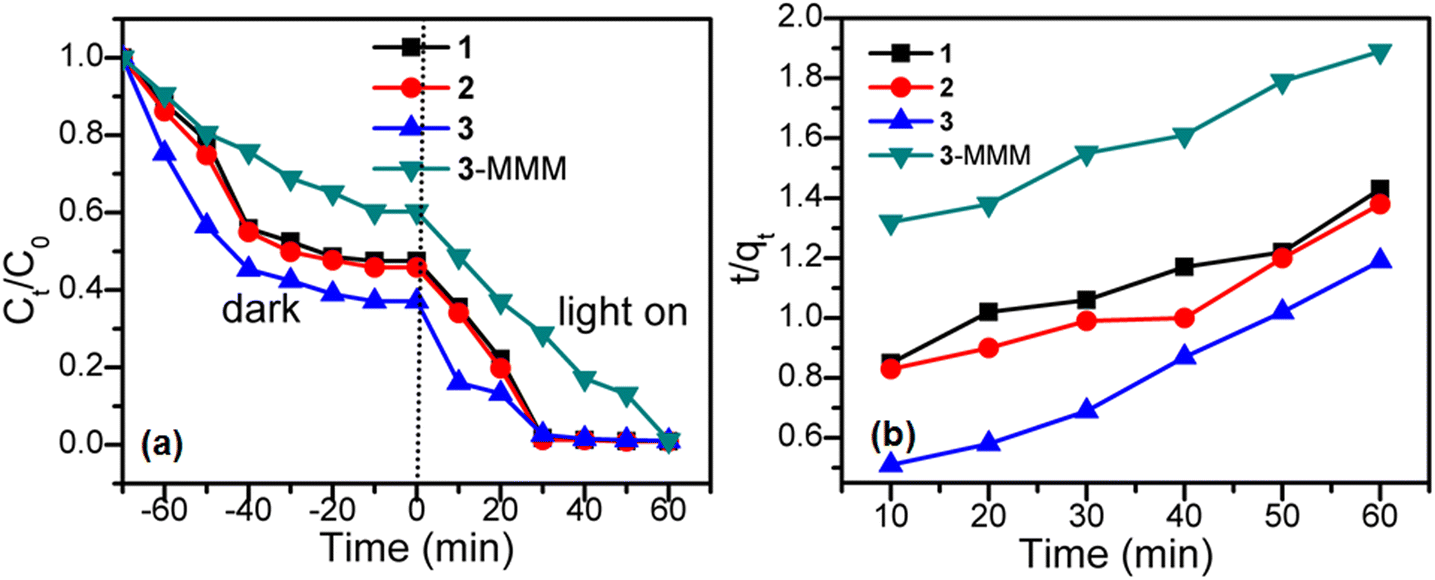
As clearly displayed in Fig. 6a and S6,† a methyl blue solution (80 mg L−1, 20 mL) could be absorbed by the titled samples with the increase in stirring time, and then reached the equilibrium of adsorption–desorption in about 60 min,43 indicating their relatively low adsorption capacity. For sample 1, the adsorption rate of MB reached 46.11% after 60 min. For sample 2, its adsorption rate reached 46.80% after 60 min. Compared with 1 and 2, sample 3 shows a slightly faster adsorption capacity, which can reach 50.72% after 60 min, which may be attributed to the larger specific surface area of 3 than those of 1 and 2.44,45 Fig. 6b shows the secondary reaction kinetics of the adsorption of 1–3, respectively. Samples 1 and 2 do not have a good linear relationship, while 3 shows a good linear relationship, where the linear fitting constant is R2 = 0.9876, indicating that the adsorption kinetics are stable compared with 1 and 2.
 | ||
| Fig. 6 (a) Adsorption and photocatalytic degradation of the methyl blue solution (80 mg L−1, 20 mL) by 1, 2, 3 and 3-MMM. (b) Pseudo-second-order adsorption kinetic fitting of 1, 2, 3 and 3-MMM in the MB solution. | ||
The above-mentioned adsorption results indicate that MB could not be completely adsorbed by the CoS/CoO microspheres, which can be further investigated for their photocatalytic activity.46,47 Samples 1–3 were put into an MB solution, which was kept in the darkness for 60 min to ensure the absorption/desorption equilibrium state prior to the irradiation. Subsequently, under visible light irradiation, the absorbance intensity of MB molecules in the UV-vis spectra decreased gradually as the irradiation time increases (Fig. S7†). As shown in Fig. 6a, the photocatalytic degradation rates of 1, 2 and 3 at 10 min reached 25.00%, 24.90% and 56.74% respectively. After light irradiation for 60 minutes, their photocatalytic degradation rates reached 96.00% for 1, 95.87% for 2, and 97.30% for 3, respectively. However, in the absence of the catalysts, the concentration of MB with irradiation time has hardly any reduction and the degradation is nearly negligible (Fig. S8†).
These results suggest that these CoS/CoO microspheres could be considered as good candidates for efficient visible-light-driven photocatalysts. As shown in Fig. 7, the photocatalytic degradation process also follows first-order reaction kinetics. Samples 1 and 2 showed similar rates (k1 = 0.0885 min−1, k2 = 0.0898 min−1), and the degradation rate of 3 (k3 = 0.109 min−1) is relatively fast, and the degradation is basically balanced in 30 min. Sample 3 performed with a slightly higher photocatalytic rate than 2 and 1, which may be attributed to its stronger photocurrent density, and more effective separation of photogenerated electron–hole pairs. In a word, via the adsorption and photocatalytic degradation process, the total decontamination efficiencies of 1, 2 and 3 reached 97.84%, 97.83% and 98.68% for MB respectively, indicating almost complete decomposition of organic pollutants (Fig. 6a and S9†).
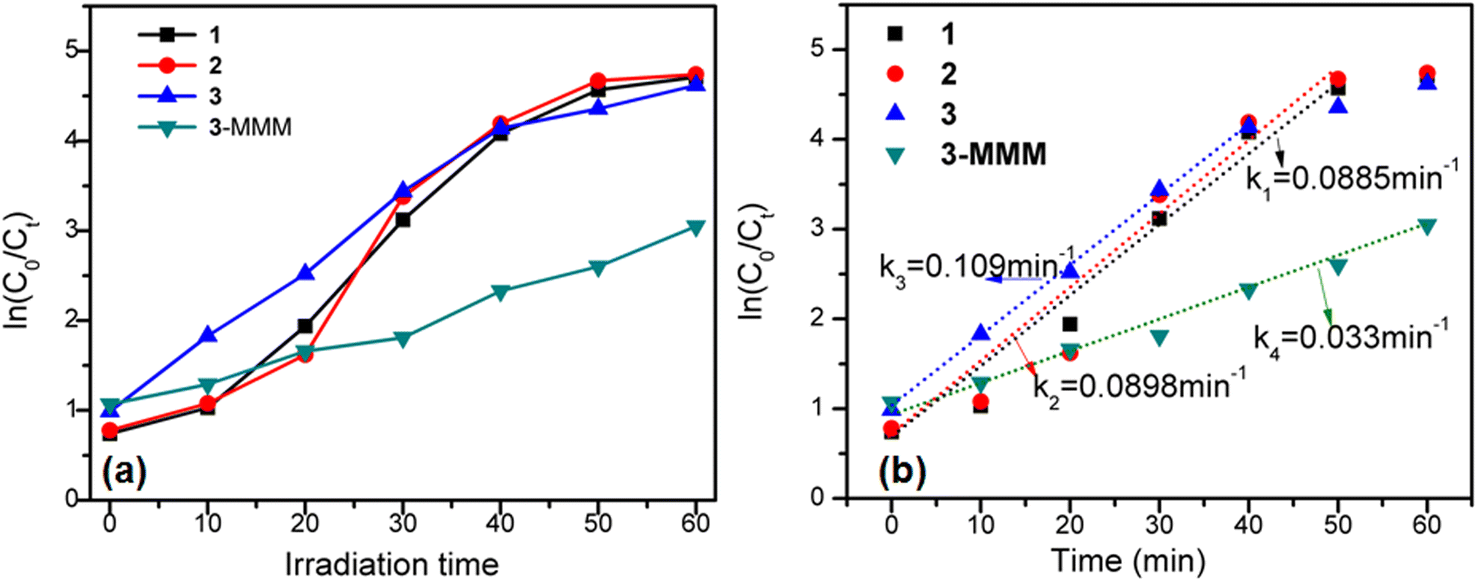 | ||
| Fig. 7 (a) First-order kinetic fitting of photocatalytic degradation of 1, 2, 3 and 3-MMM in the MB solution. (b) Reaction rate of photocatalytic degradation of MB. | ||
The stability of a photocatalyst is an important index to evaluate its research value and actual utilization.48 As sample 3 has a higher photocatalytic rate than that of 1 and 2, sample 3 is used to investigate the stability by adding 20 mg sample into 20 mL methyl blue solution. After adsorption and photocatalytic degradation of MB, the sample was centrifuged, filtered, washed, and dried for secondary use, as shown in Fig. 8.49,50 Unfortunately, the photocatalytic degradation rate of 3 dropped to 77% after 12 times of consecutive uses, which can arise from the mass loss of powdery crystal photocatalysts during the centrifugation and collection process. In order to improve the portability and recyclability, a mixed matrix membrane (MMM) of 3 (3-MMM) was produced by coating a mixture dispersion of 3 and a polyvinylidene fluoride membrane (PVDF-M) onto a glass substrate, and then dried at 50 °C for 12 h. For sample 3-MMM, the adsorption rate of MB reached 33.45% at 60 min, and also shows low adsorption rate and a good linear relationship, where the linear fitting constant is R2 = 0.9901 (Fig. 6a). Furthermore, using the above-mentioned experimental condition, the stability of 3-MMM was tested directly without centrifugation, filtration, washing and drying, while it was taken out with tweezers. It is worth noting that the photocatalytic degradation rate of 3-MMM reached 97.34% after light irradiation for 60 minutes, and the total decontamination efficiency reached 98.23% and remained basically unchanged even after the cycle of 12 times, which is better than the most reported photocatalysts (Table S1†). Meanwhile, as shown in Fig. S8 and S9,† it can be seen that PVDF-M has no obvious adsorption and photocatalytic effect on methyl blue. The above-mentioned result reveals that 3-MMM not only has excellent photocatalytic degradation performance, but also possesses good portability and reusability.10 Moreover, the comparison of the XRD pattern before and after recycling confirms the maintenance of the structure of 3-MMM (Fig. S1†), indicating that it possesses good stability.
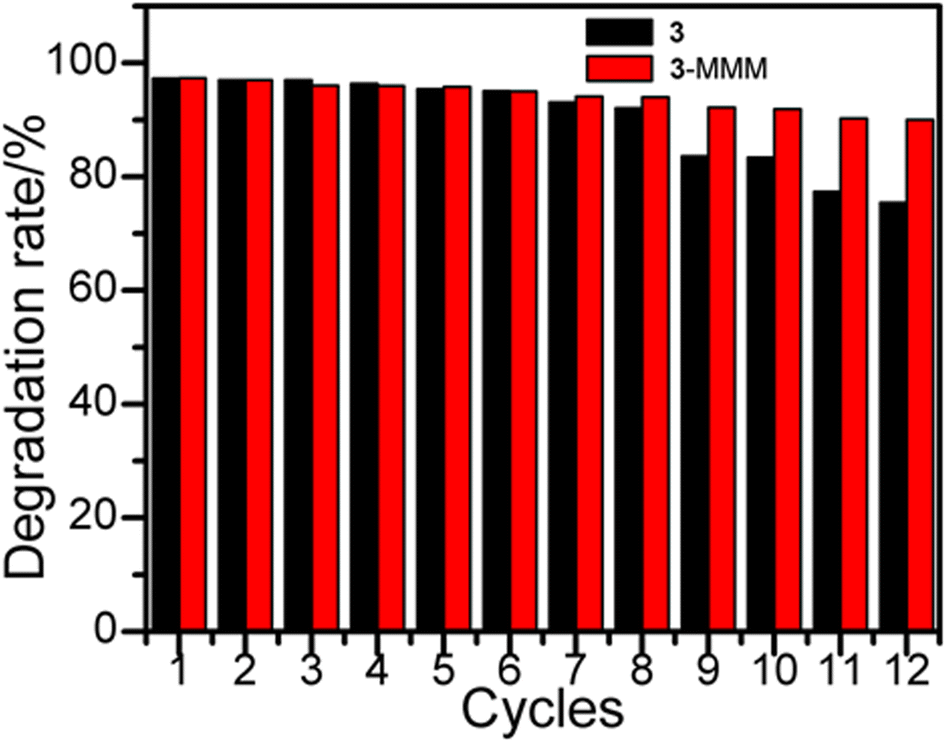 | ||
| Fig. 8 Methyl blue was photocatalyzed for 12 cycles by 3 and 3-MMM. | ||
3.5 Possible photocatalytic mechanism
In order to understand the possible mechanism of photocatalytic degradation, the radical trapping experiments were tested. In this study, isopropyl alcohol (IPA, capture% ˙OH), ethylenediamine tetraacetic acid (EDTA-2Na, capture% h+) and benzoquinone (BQ, capture% ˙O2−) were used to determine the main active species that are generated in the photo-degradation process. Before light irradiation, 0.5 mmol IPA, EDTA-2Na or BQ were added to 20 mL MB 80 mg L−1 solution containing 20 mg of 3, respectively. Fig. 9 shows that the photocatalytic degradation rate of 3 was reduced from 97.30% to 5.30% and 22.37% after adding BQ and EDTA-2Na to the above solution respectively, illustrating that ˙O2− and h+ are the important active species in the photocatalytic reaction.51 By adding IPA, the photocatalytic degradation rate was only reduced to 79.92%, which illustrates that ˙OH is not the most critical reaction species.49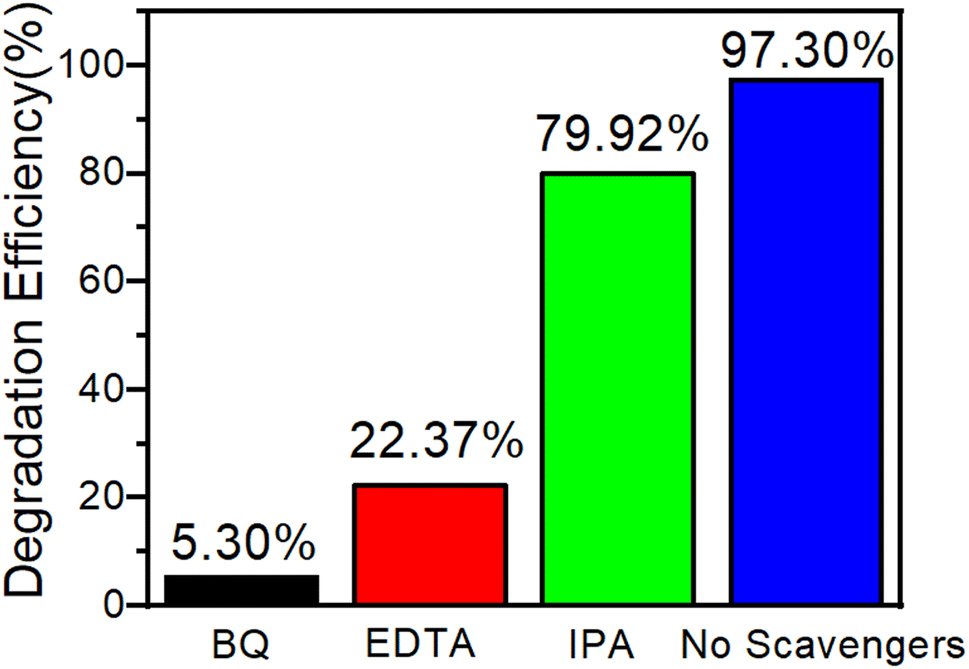 | ||
| Fig. 9 Trapping experiment of active species during the photocatalytic degradation of MB over 3 under light irradiation. | ||
On the basis of the above-mentioned experimental results and the similar reported work, the possible photocatalytic mechanism was proposed for the photodegradation of MB by 3. During the photocatalytic reaction, the electrons and holes of 3 containing CoS/CoO microspheres can first be separated under light irradiation, in which the electrons are moved to the CB, departing from the holes in the VB.49,52 The electrons are further captured by O2 in the solution to form superoxide ions (˙O2−) that will then be converted into less ˙OH, which collectively participate in the degradation of MB. At the same time, the remaining photoinduced holes also contribute to the decomposition of MB.
4 Conclusion
In summary, using cobalt chloride hexahydrate, thiourea, deionized water and polyethylene glycol (PEG) with different polymerization degrees as raw materials, three CoS/CoO microspheres have been prepared by a simple hydrothermal method. Notably, with the change in the polymerization degree of solvent PEG, the morphologies, particle sizes and specific surface areas of three microspheres can be effectively modulated, leading to different band gaps, photocurrent response abilities and photocatalytic degradation rates. In particular, the mixed matrix membrane of 3 (3-MMM) not only showed excellent photocatalytic degradation rate of MB, but also showed good portability and reusability (cycles > 12 times), which has potential prospects in the industrial application to treat organic pollutants in waste water. This result will provide guidance for the further rational design and synthesis of novel excellent visible-light-driven photocatalysts and their mixed matrix membranes based on the energy-band engineering and mixed matrix membrane strategy, and the elucidation of the structure–property relationship. Further studies by our group are in progress.Data availability
All relevant data are available in the manuscript and its online ESI.†Conflicts of interest
There is no conflict to declare.Acknowledgements
This work was supported by the Foundation of Lyuliang Key Laboratory of Optical and Electronic Materials and Devices (2021ZDSY-2-88), the Natural Science Foundation of Shanxi Province (202103021224320), the Scientific and Technological Innovation Programs of Higher Education Institutions in Shanxi (2019L0951, 2020L0713, 2023L370), the Project for the Highlevel Technological Talent of Lyuliang (2021RC-2-26, 2023RC23), and 1331 Project of Shanxi Province; Teaching Reform and Innovation Project of Lyuliang University, Project No. XJJG202125.References
- X. Linghu, Y. Shu, L. Liu, Y. Zhao, J. Zhang, Z. Chen, D. Shan and B. Wang, J. Water Proc. Eng., 2023, 54, 103994 CrossRef.
- I. Ahmad, M. Muneer, A. S. Khder and S. A. Ahmed, ACS Omega, 2023, 8, 22708–22720 CrossRef CAS.
- S. Selvinsimpson, S. Eva Gnana Dhana Rani, A. GaneshKumar, R. Rajaram, I. Sharmila Lydia and Y. Chen, Environ. Res., 2021, 195, 110787 CrossRef CAS.
- N. A. Alamrani and H. A. Al-Aoh, Adsorpt. Sci. Technol., 2021, 2021, 1–12 Search PubMed.
- T. Huang, M. He, Y. Zhou, S. Li, B. Ding, W. Pan, S. Huang and Y. Tong, RSC Adv., 2016, 6, 100392–100400 RSC.
- S. He, Y. Chen, X. Li, L. Zeng and M. Zhu, ACS ES&T Eng., 2022, 2, 527–546 Search PubMed.
- K. Vellingiri, V. Choudhary, D. W. Boukhvalov and L. Philip, ACS ES&T Water, 2022, 2, 1475–1499 Search PubMed.
- C. H. Mak, X. Han, M. Du, J. Kai, K. F. Tsang, G. Jia, K. C. Cheng, H. H. Shen and H. Y. Hsu, J. Mater. Chem. A, 2021, 9, 4454–4504 RSC.
- C. C. Wang, J. R. Li, X. L. Lv, Y. Q. Zhang and G. Guo, Energy Environ. Sci., 2014, 7, 2831–2867 RSC.
- J. Yang, H. Song, Y. Zhang and X. Zhu, Surf. Interfaces, 2021, 24, 101092 CrossRef CAS.
- F. T. Geldasa, M. A. Kebede, M. W. Shura and F. G. Hone, RSC Adv., 2023, 13, 18404–18442 RSC.
- H. R. Dihom, M. M. Al-Shaibani, R. M. S. Radin Mohamed, A. A. Al-Gheethi, A. Sharma and M. H. B. Khamidun, J. Water Proc. Eng., 2022, 47, 102705 CrossRef.
- Z. Saddique, M. Imran, A. Javaid, S. Latif, N. Hussain, P. Kowal and G. Boczkaj, Water Resour. Ind., 2023, 29, 100211 CrossRef CAS.
- H. Jiang, H. Chen, Y. Fu and C. Guo, Appl. Surf. Sci., 2023, 611, 155555 CrossRef CAS.
- H. R. Pouretedal and M. Kiyani, J. Iran. Chem. Soc., 2014, 11, 271–277 CrossRef CAS.
- D. Inoue, T. Yoshikawa, T. Okumura, Y. Yabuki and M. Ike, J. Hazard. Mater., 2021, 414, 125497 CrossRef CAS PubMed.
- Q. Fang, C. Chen, Z. Yang, X. A. Chen, X. Chen and T. Liu, J. Alloys Compd., 2020, 826, 154084 CrossRef CAS.
- A. Gulinigaer, A. Salamu, Y. Tuerxun, Y. Rouzhahong, M. Mamat, L. Xie, Z. Wu, F. Xiaerding and Y. Sun, Russ. J. Phys. Chem. A, 2020, 93, 2852–2857 CrossRef.
- W. Xiang, Q. Wang, Z. Li, J. Dong, J. Liu, L. Zhang, T. Xia, Y. He and D. Zhao, Sep. Purif. Technol., 2024, 330, 125268 CrossRef CAS.
- Y. Ohigashi, A. Higuchi, N. C. Rosero-Navarro, A. Miura and K. Tadanaga, J. Sol-Gel Sci. Technol., 2022, 101, 24–28 CrossRef CAS.
- Z. Shi and A. H. Jayatissa, Prog. Nat. Sci., 2020, 30, 352–359 CrossRef CAS.
- W. Shi, J. Gao, H. Sun, Z. Liu, F. Guo and L. Wang, Chin. J. Chem. Eng., 2022, 49, 213–223 CrossRef CAS.
- A. S. Alkorbi, H. M. Asif Javed, S. Hussain, S. Latif, M. Shabir Mahr, M. S. Mustafa, R. Alsaiari and N. Alhemiary, Opt. Mater., 2022, 127, 112259 CrossRef CAS.
- J. K. Kim, J. Y. Ju, S. K. Choi, S. Unithrattil, S. S. Lee, Y. Kang, Y. Kim, W. B. Im, S. Choi and J. Power, Sources, 2018, 378, 562–570 CrossRef CAS.
- H. Kawasaki, T. Ohshima, Y. Yagyu, T. Ihara, K. Mitsuhashi, H. Nishiguchi and Y. Suda, J. Appl. Phys., 2022, 61, SA1019 CrossRef CAS.
- S. Zhang, X. Yu, F. Yan, C. Li, X. Zhang and Y. Chen, J. Mater. Chem. A, 2016, 4, 12046–12053 RSC.
- X. Liu, Q. Li, Y. Fan, W. Chen, L. Lin, W. Xu, H. Zhuang and Q. Li, Mater. Lett., 2022, 315, 132010 CrossRef CAS.
- L. Qi, J. Yu and M. Jaroniec, Phys. Chem. Chem. Phys., 2011, 13, 8915–8923 RSC.
- M. He, Y. Zhou, T. Huang, S. Nie, Y. Wang, Z. Xu, Y. Huo, R. Xu, X. Chen and H. Peng, Compos. Sci. Technol., 2020, 200, 108403 CrossRef CAS.
- S. Dhiman and B. Gupta, Environ. Technol. Innovation, 2021, 23, 101765 CrossRef CAS.
- K. Qi, J. Yu and K. Chen, Cryst. Res. Technol., 2013, 48, 1083–1086 CrossRef CAS.
- N. Hu, L. Huang, W. Gong and P. K. Shen, ACS Sustain. Chem. Eng., 2018, 6, 16933–16940 CrossRef CAS.
- X. Chen, N. Li, S. Xu, H. Wang and Y. Cai, Materials, 2018, 11, 511 CrossRef PubMed.
- G. Liu and J. Shao, J. Mater. Chem. A, 2017, 5, 9801–9806 RSC.
- J. C. Xing, Y. L. Zhu, M. Y. Li and Q. J. Jiao, Electrochim. Acta, 2014, 149, 285–292 CrossRef CAS.
- Y. Mao, X. Shen, Z. Wu, L. Zhu and G. Liao, J. Alloys Compd., 2020, 816, 152604 CrossRef CAS.
- P. J. Wibawa, H. Saim, M. A. Agam and H. Nur, Phys. Procedia, 2011, 22, 524–531 CrossRef CAS.
- M. Tian, J. Wang, R. Sun, M. Yao and L. Li, Catalysts, 2021, 11, 515 CrossRef CAS.
- T. Luo, X. Sun, D. Ma, G. Wang, F. Yang, Y. Zhang, J. Huang, H. Zhang, J. Wang and F. Peng, J. Phys. Chem. C, 2023, 127, 1372–1380 CrossRef CAS.
- J. Lu, J. Zhang, X. Yang, D. Jia and S. Zhao, Inorg. Chim. Acta, 2022, 537, 120962 CrossRef CAS.
- B. Zhang, M. Pang, J. Li, Y. Yang, M. Z. Liu and X. Chen, Mol. Cryst. Liq. Cryst., 2022, 757, 85–94 CrossRef.
- X. Bu, Y. g. Liu, C. A. Xie and B. Wang, ACS Appl. Opt. Mater., 2023, 1, 688–700 CrossRef CAS.
- G. Yang, Z. F. Yan and T. C. Xiao, Appl. Surf. Sci., 2012, 258, 8704–8712 CrossRef CAS.
- W. Sangchay, Energy Procedia, 2016, 89, 170–176 CrossRef CAS.
- C. Zhang, Y. Li, M. Li, D. Shuai, X. Zhou, X. Xiong, C. Wang and Q. Hu, J. Hazard. Mater., 2021, 420, 126607 CrossRef CAS PubMed.
- S. Okeil, J. Krausmann, I. Dönges, S. Pfleger, J. Engstler and J. J. Schneider, Dalton Trans., 2017, 46, 5189–5201 RSC.
- C. Shi, F. Tao and Y. Cui, Int. J. Biol. Macromol., 2018, 114, 400–407 CrossRef CAS PubMed.
- N. Cruz-González, O. Calzadilla, J. Roque, F. Chalé-Lara, J. K. Olarte and M. Meléndez-Lira, Int. J. Photoenergy, 2020, 2020, 1–9 CrossRef.
- X. Qiao, C. Wang and Y. Niu, J. Hazard. Mater., 2020, 391, 122121 CrossRef CAS.
- M. Guan, H. Li, X. Chen and S. Zhang, Waste Manage., 2021, 120, 635–641 CrossRef CAS PubMed.
- Q. Zhu, Y. Sun, F. Na, J. Wei, S. Xu, Y. Li and F. Guo, Appl. Catal., B, 2019, 254, 541–550 CrossRef CAS.
- H. Xu, X. Wang, M. Dai, W. Wang, D. Lu, M. Zhang, Y. Chen and H. Song, Mater. Chem. Phys., 2021, 260, 124158 CrossRef CAS.
Footnote |
| † Electronic supplementary information (ESI) available: XRD patterns of 3-MMM before and after recycling, XPS spectra of 3-MMM; SEM and EDS mappings of 3-MMM; particle size analysis of 1–3; N2 adsorption–desorption isotherm diagram of 1, 2 and 3 at 77 K, UV-vis spectra at different times for MB in the presence of 1, 2, 3, and 3-MMM; UV-vis spectra for MB in the presence of 1, 2, 3, and 3-MMM under metal halide lamp irradiation; adsorption and photocatalytic degradation of methyl blue solution by no catalyst, PVDF-film, 3-MMM and 3, respectively; total decontamination efficiency of methyl blue contrast; comparison of the photocatalytic degradation behavior of MB by 3, 3-MMM and some reported photocatalysts. See DOI: https://doi.org/10.1039/d4ra03261f |
| This journal is © The Royal Society of Chemistry 2024 |