 Open Access Article
Creative Commons Attribution 3.0 Unported Licence
Impact of NH4OH treatment on the ion exchange and pore characteristics of a metakaolin-based geopolymer†
Jing Li*abc,
Sarah Mailhiot b,
Mohammad I. M. Alzeera,
Tero Luukkonen
 a,
Anu M. Kantola
 b,
Ville-Veikko Telkki
 b and
Paivo Kinnunen
 a
a
aFibre and Particle Engineering Research Unit, Faculty of Technology, University of Oulu, P. O. Box 4300, FIN-90014, Oulu, Finland. E-mail: jing2.li@cea.fr
bNMR Research Unit, Faculty of Science, University of Oulu, P. O. Box 3000, FIN-90014, Oulu, Finland
cNIMBE, CEA, CNRS, Université de Paris Saclay, CEA Saclay, 91191 Gif-sur-Yvette, France
First published on 20th June 2024
Abstract
We investigated the viability and influence of NH4OH post-synthetic treatment on the pore characteristics of geopolymers. Geopolymers are a class of materials with amorphous aluminosilicate three-dimensional frameworks, regarded as amorphous analogues of zeolites. Similar to zeolites, when geopolymers are used in catalysis or adsorption applications, post-synthetic treatments such as ion exchange with NH4+ salts (e.g., NH4Cl and NH4NO3) and desilication (using strong bases such as NaOH) are necessary to introduce active sites and modify their pore structure, respectively. Recently, it has been shown that treatment with NH4OH combines these two steps, in which acidic sites are introduced and the pore structures of zeolites are modified simultaneously. Considering the increasing interest in geopolymers in catalysis and adsorption applications, understanding the impact of such treatment on the structure of geopolymers is needed. Our diffuse reflectance infrared Fourier-transform spectra show that NH4+ exchanges Na+ in the geopolymer, and laser diffraction with scanning electron microscopy images show that the particle size of the powdered geopolymer decreases after NH4OH treatment. N2 sorption isotherms and 129Xe and 1H NMR measurements revealed information about the changes in pore structures: micropores were larger than mesopores and inborn mesopores increased in diameter, thereby reducing the surface area to volume ratio. However, pore accessibility and pore connectivity were not altered by NH4OH treatment. Since solid-state NMR and X-ray fluorescence revealed desilication, these changes in particle size and pore characteristics are considered to be due to desilication caused by NH4OH treatment.
1. Introduction
Geopolymers are a class of amorphous aluminosilicate inorganic polymers synthesized through the alkali-activation of aluminosilicate precursors (e.g., natural clays or low-Ca slags).1 They could be described as the amorphous analogues of zeolites because of their disordered three-dimensional frameworks.2 Compared with synthetic zeolites, geopolymers are cheaper and more easily synthesized at low temperatures (<100 °C).3 In our recent studies, we showed that the pore structures of geopolymers include inborn and interconnected micropores and mesopores.4,5 Geopolymers have shown good performance as catalysts and adsorbents in some processes, such as NOx reduction,6 oxidation of volatile organic compounds (VOCs)7 and water purification.8,9For catalysis applications, acidic sites within a geopolymer framework have been generated via ion exchange of charge-balancing alkali cations (i.e., Na+ or K+) with NH4+, followed by thermal treatment, which releases gaseous NH3 and forms a H+-geopolymer.10 This is typically performed by treating a pre-formed geopolymer with a solution of ammonium salt (e.g., NH4Cl and NH4NO3). In addition, ion-exchange procedures have also been used to incorporate catalytically reactive metals or metal oxides (e.g., Ni, Fe, Ce, Co, Cu, and Pt) within a geopolymer framework.2 Such cations have been shown to be more efficiently incorporated into an NH4+ containing geopolymer compared to an originally synthesised Na+/K+-geopolymer.2,11,12 In such applications, the pore characteristics (i.e., surface area and pore volume) of geopolymer catalysts are essential. This has been shown to be significantly improved by applying post-synthetic treatments such as dealumination (treatment with a weak acid) and desilication (treatment with a strong base).13 Such post-synthetic treatments are routinely carried out on zeolite catalysts, in which they generate additional interconnected and accessible mesopores.14 Similar procedures have been shown to be applicable to geopolymer catalysts.13 The effect of such treatments on the geopolymer properties has been studied to some extent by diffuse reflectance infrared Fourier-transform (DRIFT) spectroscopy for monitoring the success of the NH4+ ion-exchange,15 and 27Al and 29Si magic angle spinning nuclear magnetic resonance (MAS NMR),16 which provide information about structural changes caused by the treatment. However, more information about the impact of such treatments on modifying the chemical structure, particle morphology, and pore properties, importantly pore-connectivity, is still needed.
When probing the pore structures of the geopolymers, N2 sorption is a widely used method to provide information about mesopores.17 Previously, 129Xe and 1H NMR have been shown to be efficient methods to investigate the pore structures of geopolymers4,5 as well as zeolites, silica gels and cementitious materials.18–21 By introducing Xe and H2O as probe fluids into pores, three of the most relevant porous characteristics, pore accessibility, pore connectivity and pore sizes, can be determined. 129Xe NMR spectra provide information about the pore size and accessibility, as 129Xe chemical shift (δ) is inversely proportional to the pore size22 and variable temperature 129Xe spectra enable the determination of the mesopore sizes.23 129Xe spin–spin relaxation time (T2), spin–lattice relaxation time (T1) and exchange rates of Xe gas between different pores (k)24 reflect the pore connectivity.5 1H T1 and T2 relaxation times of H2O also reveal information about the pore structure, such as pore size, pore connectivity, and information about the pore surface characteristics.4,19 Two-dimensional (2D) relaxation experiments, such as T2–T2 (ref. 25) and T1–T2 (ref. 26 and 27) experiments, provide higher resolution and more detailed exchange information than 1D measurements.4 Pore size distributions can be measured by 1H NMR cryoporometry,28,29 which relies on the fact that the melting point of water in a small pore is inversely proportional to the pore size. The amount of unfrozen water is detected as a function of temperature by 1H spin echo or Carr–Purcell–Meiboom–Gill (CPMG) experiments. The derivative of the signal intensity is converted to pore size distributions using the Gibbs–Thompson equation.30,31
In this work, we report, for the first time, the impact of mild NH4OH treatment on the chemical and physical properties of geopolymers. We investigate the dual role of NH4OH; the ion exchange of Na+ with NH4+ simultaneously upon modifying the pore structure of geopolymer by desilication (due to the basicity of NH4OH). The impact of NH4OH treatment on zeolite catalysts has been reported,32 but as far as we are aware it has not been reported on geopolymers previously. Modified geopolymer catalysts with post-synthetic treatments have been previously produced via multistep synthesis procedures involving an initial NH4+ ion-exchange step, followed by dealumination, desilication and then an additional NH4+ ion-exchange step. NH4OH produces desilicated geopolymer in its NH4+ form in a one-pot process without the need for an additional ion exchange step. Herein, the NH4OH (0.02 M) treatment was performed on a metakaolin-based geopolymer, previously treated with acetic acid (0.1 M). The chemical structure and particle morphology of the modified geopolymer were thoroughly investigated at different NH4OH treatment durations. Special attention was paid to studying the impact of NH4OH treatment on the intraparticle pore structure of the geopolymer via N2 physisorption combined with 129Xe and 1H relaxometry NMR techniques.
2. Experimental methods
2.1. Sample preparation
An alkali activating solution was first prepared by mixing 37.4 g sodium silicate solution (27% SiO2, 8% Na2O and 65% H2O) (VWR, BDH, Frankenwald, South Africa) with 5.6 g NaOH pellets (VWR, BDH, Frankenwald, South Africa). The mixing procedure was performed using a shear mixer (IKA, T 25 digital ULTRA-TURRAX, Staufen, Germany) at a speed of 3000 rpm for 5 min. Then, 31.55 g metakaolin (MetaMax, BASF, Ludwigshafen, Germany) was dissolved in the alkali-activating solution, with 3.85 mL H2O. The mixture was placed into silicone molds and sealed into a plastic bag for curing at room temperature. After 24 h of curing, the solid samples were ground into powders using a vibratory disc mill (Retsch RS200, RETSCH GmbH, Haan, Germany). The oxide molar ratio of this geopolymer was: Na2O![[thin space (1/6-em)]](https://www.rsc.org/images/entities/char_2009.gif) :
:![[thin space (1/6-em)]](https://www.rsc.org/images/entities/char_2009.gif) Al2O3
Al2O3![[thin space (1/6-em)]](https://www.rsc.org/images/entities/char_2009.gif) :
:![[thin space (1/6-em)]](https://www.rsc.org/images/entities/char_2009.gif) SiO2
SiO2![[thin space (1/6-em)]](https://www.rsc.org/images/entities/char_2009.gif) :
:![[thin space (1/6-em)]](https://www.rsc.org/images/entities/char_2009.gif) H2O = 1.0
H2O = 1.0![[thin space (1/6-em)]](https://www.rsc.org/images/entities/char_2009.gif) :
:![[thin space (1/6-em)]](https://www.rsc.org/images/entities/char_2009.gif) 1.1
1.1![[thin space (1/6-em)]](https://www.rsc.org/images/entities/char_2009.gif) :
:![[thin space (1/6-em)]](https://www.rsc.org/images/entities/char_2009.gif) 3.8
3.8![[thin space (1/6-em)]](https://www.rsc.org/images/entities/char_2009.gif) :
:![[thin space (1/6-em)]](https://www.rsc.org/images/entities/char_2009.gif) 13.6.
13.6.
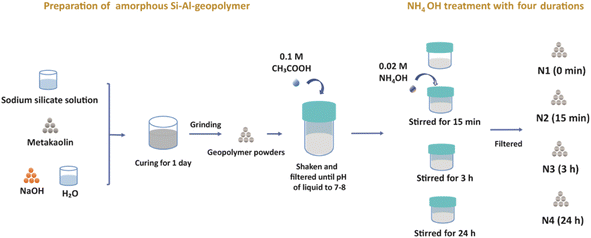
Before the NH4OH treatment, a low-concentration acetic acid treatment was performed. 12.5 g of the geopolymer powder was added to 100 mL of 0.1 M acetic acid (VWR, Merck, Radnor, United States) and shaken on an orbital shaker (Advanced d3500 Orbital Shaker, VWR, Radnor, United States) for 10 min. The powders were then filtered out, while the pH of the filtered liquid was measured (Accumet model 20, Fisher Scientific, Vantaa, Finland). The geopolymer powders were then shaken with 0.1 M acetic acid and filtered repeatedly until the pH value of the filtered liquid became 7 to 8.
The four sets of 12.5 g of geopolymer powders were subjected to 500 mL of 0.02 M NH4OH (Sigma-Aldrich, Munich, Germany) solution treatment in a beaker, and stirred using a magnetic stirrer (Mixdrive 6, 2mag AG, Muenchen, Germany) at 600 rpm for 0 min, 15 min, 3 h and 24 h, and these four geopolymers treated samples were named N1, N2, N3 and N4, respectively. Before characterizing the four samples, they were dried overnight at 100 °C.
Here we would like to note that we used the low-concentration (0.02 M) NH4OH solution in order to avoid damaging the pore structure, which is expected to happen at higher concentrations. However, the 0.02 M concentration was too low to replace efficiently Na+ ions with NH4+ ions and thus it was hard to observe the effect of the NH4+ treatment. Therefore, an acetic acid treatment was applied before the NH4+ treatment in order to help exchange some original Na+ ions in geopolymer by H+ ions, thus facilitating the introduction of NH4+ ions into the pores (Fig. 1).
2.2. DRIFT spectra
DRIFT spectra in the range of 500–4000 cm−1 were collected for powder samples by a Bruker Vertex v80 spectrometer (Bruker, Rheinstetten, Germany).2.3. X-ray fluorescence
X-ray fluorescence (XRF) measurements were used to determine the chemical composition of the samples. Scans were performed on an XRF spectrometer, PANalytical AXIOSmAX fitted with an Rh X-ray tube, which has a maximum power of 4 kW (Malvern PANanlytical, Malvern, UK).2.4. Solid-state magic angle spinning (MAS) NMR
27Al and 29Si MAS NMR spectra were measured using a Bruker Avance III 7.05 T spectrometer (Bruker, Billerica, MA, USA). Samples were packed into 7 mm zirconia rotors and a 7 kHz spinning frequency was applied. For collecting 27Al MAS spectra, a single pulse sequence was used. The length of the excitation pulse was 1 μs. The number of scans was 1024 with a relaxation delay of 2 s. The experiment time was about 0.5 h. The 27Al spectra were collected on all four samples and referenced to the external reference of Al(NO3)3 at 0 ppm. The 29Si MAS spectra were also collected with the single pulse sequence. The pulse length was 4 μs. The spectra were accumulated for 8192 scans. The relaxation delay was 3 s and the experiment time was about 7 h. The 29Si spectra were referenced to tetramethylsilane (TMS) at 0 ppm.2.5. Particle size
Particle size distributions were measured when geopolymer samples were dispersed into an NH4OH treatment solution by using a laser diffraction particle size analyser (LS 13320, Beckman Coulter, Inc., Brea, CA, USA). The induced optical model was ‘Fraunhofer. rfd’.2.6. SEM images
SEM images were recorded using a Zeiss Ultra Plus field emission scanning electron microscope (FESEM) (Zeiss, Jena, Germany). The powdered geopolymers were carbon-coated before scanning.2.7. N2 sorption
N2 sorption measurements were performed at −196 °C using Micromeritics ASAP 2020 (Micromeritics, Norcross, US). The four samples were degassed under vacuum at 100 °C, overnight. The pore size distributions of the mesopores were obtained using the Barret–Joyner–Halenda (BJH) method33 and the pore volumes of micropores were obtained using the t-plot method.34 The surface areas were analysed by Brunauer–Emmett–Teller (BET) method.352.8. 129Xe NMR
To control the particle size effect on the 129Xe NMR results, the samples were sieved with an air jet sieve (HOSOKAWA ALPINE 200LS, Hosokawa Alpine AG, Augsburg, Germany) before the experiments. The particles in the range of 90–250 μm were selected. However, this is not the actual particle size as this sieve cannot separate the aggregated small particles. The actual particle size distributions were measured while dispersed into iso-propanol using a laser diffraction particle size analyser (see Section 2.4).The sample powders were loaded into a 5 mm NMR tube and 5–6 atm of the 129Xe gas was then condensed into each sample using liquid nitrogen and a vacuum system. After 5–6 atm of 129Xe gas was condensed into each sample using liquid nitrogen and a vacuum system, 129Xe NMR spectra were collected on Bruker Avance III 7.1 T spectrometer (Bruker, Billerica, MA, USA) with a 10 mm BBO probe. The 129Xe dynamic experiments, including measurements of the exchange rates and relaxation times (T2 and T1), were performed for samples N1, N2 and N3 on a Bruker Avance III 14.1 T spectrometer (Bruker, Billerica, MA, USA) with a 5 mm BBO probe.
129Xe NMR spectra were measured using a single pulse sequence. The data was collected using 64 scans and a 60 s relaxation delay between each scan. The experiment time of one 129Xe spectrum was about 1 hour. The variable temperature 129Xe spectra were collected for 11 temperature points in the range of 212–324 K. For 1 K of temperature increase, the sample was left for 5 min for temperature stabilization.
The exchange rates (k) were measured by 129Xe selective inversion recovery (IR) experiments24 at 298 K.5 The recovery time was varied from 10 μs to 1 s by 36![[thin space (1/6-em)]](https://www.rsc.org/images/entities/char_2009.gif) log-spaced steps. The length of the selective sinc pulse was 436 μs with 7 W power and the pulse was centred on the peak at 42–53 ppm (labelled with IP in Fig. 6). The number of scans was 128 and the relaxation delay was 10 s. The experiment time was about 15 h.
log-spaced steps. The length of the selective sinc pulse was 436 μs with 7 W power and the pulse was centred on the peak at 42–53 ppm (labelled with IP in Fig. 6). The number of scans was 128 and the relaxation delay was 10 s. The experiment time was about 15 h.
T1 of 129Xe was measured by the IR pulse sequence36 at 298 K. The recovery time increased from 100 μs to 1 s with 25![[thin space (1/6-em)]](https://www.rsc.org/images/entities/char_2009.gif) log-spaced steps. The number of scans was 64 and the relaxation delay was 10 s. The experiment time was about 6 h.
log-spaced steps. The number of scans was 64 and the relaxation delay was 10 s. The experiment time was about 6 h.
T2 of 129Xe was measured by the CPMG pulse sequence37 at 298 K. The echo time (2τ) was 160 μs. The number of echoes varied from 2 to 50 with 14![[thin space (1/6-em)]](https://www.rsc.org/images/entities/char_2009.gif) log-spaced steps. The number of scans was 256 and the relaxation delay was 10 s. The experiment time was about 10 h.
log-spaced steps. The number of scans was 256 and the relaxation delay was 10 s. The experiment time was about 10 h.
The k, T1 and T2 data fits are shown in Section S2.†
2.9. 1H NMR experiments
Before the 1H NMR experiments, the geopolymer samples were water-saturated for 14 days. 1H T2 and T1 measurements, as well as 2D 1H T2–T2 and T1–T2 experiments, were performed on a Magritek Spinsolve 43 MHz NMR spectrometer (Magritek, Aachen, Germany) at 298 K.The spectrally resolved CPMG experiments were conducted to acquire T2 distributions. The echo time was 150 μs and 1000 echoes were collected in a single scan. The number of scans was 4 and the relaxation delay was 14 s. The experiment time was about 16 h.
The T1 distributions were acquired with the saturation recovery (SR) pulse sequence.38 The recovery time was varied from 1 ms to 2 s with 64![[thin space (1/6-em)]](https://www.rsc.org/images/entities/char_2009.gif) log-spaced steps. The number of scans was 4 and the repetition time was 14 s. The experiment time was about 1 h.
log-spaced steps. The number of scans was 4 and the repetition time was 14 s. The experiment time was about 1 h.
T2–T2 experiments26 were performed with an echo time equal to 150 μs and 1000 echoes were acquired in the direct dimension. In the indirect dimension, the echo number was varied from 2 to 2000 in 64![[thin space (1/6-em)]](https://www.rsc.org/images/entities/char_2009.gif) log-spaced steps. The number of scans was 128 and the relaxation delay was 6 s. The experiment time was about 14 h. The experiments were repeated with four different mixing times of 0.01, 0.02, 0.2 and 1 ms.
log-spaced steps. The number of scans was 128 and the relaxation delay was 6 s. The experiment time was about 14 h. The experiments were repeated with four different mixing times of 0.01, 0.02, 0.2 and 1 ms.
The T1 SR–T2 pulse sequence26,27 was used for collecting T1–T2 data. The echo time was 150 μs and 1000 echoes were collected in a single scan. The recovery time was varied from 1 ms to 5 s with 64![[thin space (1/6-em)]](https://www.rsc.org/images/entities/char_2009.gif) log-spaced steps. The number of scans was 128 and the relaxation delay was 6 s. The experiment time was about 14 h.
log-spaced steps. The number of scans was 128 and the relaxation delay was 6 s. The experiment time was about 14 h.
The 1H NMR cryoporometry experiments30 were performed on a Bruker Avance III 11.7 T spectrometer (Bruker, Billerica, MA, USA) with a 10 mm BBO probe. The cryoporometry experiments contained 56 variable temperature CPMG experiments over a temperature range of 170 to 276 K. A temperature stabilization delay of 5 min K−1 was used between experiments. The CPMG echo time was 200 μs and the number of echoes was 1000. The relaxation delay was 5 s and the number of scans was 64. The total experiment time for each sample was about 16 h. The data fits are shown in Section S3.†
1D T2 and T1 as well as 2D T2–T2 and T1–T2 distributions were obtained using the Laplace inversion implemented in MATLAB R2017b (Mathworks, Natick, Massachusetts, United States of America), provided by the research group of late Prof. P. Callaghan.30,39,40
3. Results and discussion
3.1. Ion-exchange and structure
DRIFT spectra were collected to detect the changes in the chemical structure of the geopolymer due to the NH4OH treatment. As visible in Fig. 2a, the geopolymer without the NH4OH treatment shows three main peaks at 3452, 1649 and 1254 cm−1, which are assigned to stretching H–O, bending H–O, and asymmetric stretching Si–O–T groups (T is Si or Al) in the geopolymer framework, respectively.41,42 After the geopolymer was treated with NH4OH for 15 min, 3 h and 24 h, three peaks appeared at 3246, 3037 and 2848 cm−1 (Fig. 2b–d), representing the appearance of anti-symmetric N–H stretching bands, as well as another new peak at 1454 cm−1, which is ascribed to the anti-symmetric bending H–N–H.43,44 These peaks provide evidence that NH4+ went into the pores after the NH4OH treatment and the NH4+-geopolymer was formed. This corresponds to the XRF measurement results: the weight percentage of Na2O decreased from 6.3 to 5.1 (Table 1), which is because Na+ was continuously exchanged with NH4+ during NH4OH treatment, although acetic acid (0.1 M) resulted in a larger level of exchange with a decrease from 11.6 to 6.3. The NH4+-exchanged geopolymer enabled the preparation of material with high acidity after calcination at temperature of 550–600 °C.14,17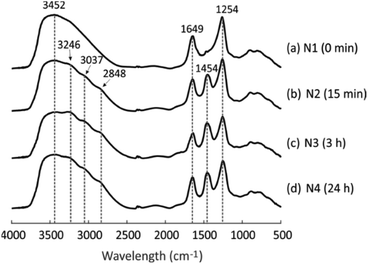 | ||
| Fig. 2 DRIFT spectra of four geopolymers after different NH4OH treatment times: (a) N1, (b) N2, (c) N3 and (d) N4. | ||
| Na2O (%) | SiO2/Al2O3 molar ratio | |
|---|---|---|
| Geopolymer before acetic acid treatment | 11.6 | 3.54 |
| N1 | 6.26 | 3.13 |
| N2 | 5.61 | 3.16 |
| N3 | 4.14 | 3.14 |
| N4 | 5.13 | 3.12 |
The local Al and Si chemical environment changes after the NH4OH treatment were also characterized using 27Al and 29Si MAS NMR. In the 27Al NMR spectra (Fig. 3a–d), the peak at 55 ppm is assigned to Al in tetrahedral coordination and the small peak at 2 ppm to six-fold coordinated Al, arising from a small amount of non-framework Al.45 The treatment does not change the positions of the peaks, but the peak at 2 ppm gradually vanishes as NH4OH treatment time increases to 24 h. This may be because the extra-framework-Al was removed via the NH4OH treatment. A similar result was also found in zeolites.32 In 29Si MAS NMR spectra (Fig. 3e–h), two partially overlapping peaks are observed. The smaller peak at −110 ppm corresponds to SiQ4(0Al), which mainly results from unreacted metakaolin.46 The other peak is a typical broad geopolymer peak at −90 to −92 ppm. Normally, this peak contains four species, SiQ4(4Al), SiQ4(3Al), SiQ4(2Al) and SiQ4(1Al), arranged from low to high frequency.47 This peak shifts from −91.7 ppm (Fig. 3e) to −90.7 ppm (Fig. 3h) with increasing NH4OH treatment time. This small shift was also found for zeolite Y after the NH4OH treatment in a previous study, which is ascribed to the desilication impact of NH4OH.32 Removal of Si from the framework leads to an increased chemical shift. The decreasing input Si/Al ratio in the geopolymer framework was also previously found to lead to increasing chemical shifts.47 The desilication was also found from XRF measurements, where the SiO2-to-Al2O3 molar ratio was decreased from 3.16 to 3.12 as the NH4OH treatment time increased from 15 min to 24 h (Table 1).
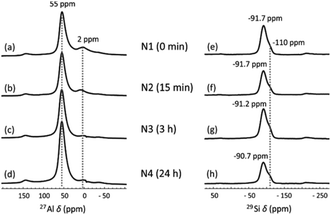 | ||
| Fig. 3 (a–d) 27Al and (e–h) 29Si MAS NMR spectra of (a and e) N1, (b and f) N2, (c and g) N3 and (d and h) N4. | ||
3.2. Particle size
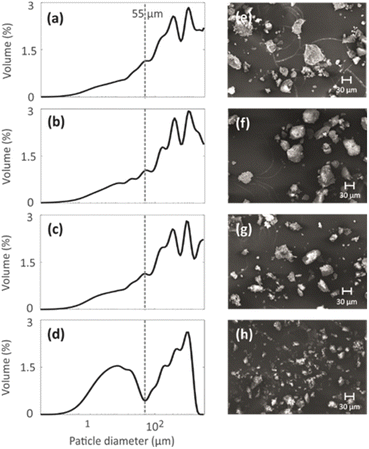
Particle size distributions of the geopolymer powders were measured to investigate the effect of the mild NH4OH treatment on geopolymer particles. The particle size distributions shown in Fig. 4a–d indicate that the NH4OH treatment lasting for 0–3 h (N1, N2 and N3) does not alter the particle size. However, the NH4OH treatment lasting 24 h (N4) leads to a decrease in the particle size. The particles with similar sizes are visible in the SEM images (Fig. 4e–h). The reason for the decreased particle size is hypothesized to be the desilication caused by the NH4OH treatment. As the Si–O bonds break, the large particles become smaller while breaking into multiple smaller pieces. The formation of the crystal fragments of ZSM-5 zeolite due to desilication was also observed in a previous study.483.3. Pore structure
The effect of NH4OH treatment on the pore structure of the geopolymer was studied by N2 physisorption, 1H cryoporometry, 1H NMR relaxometry and 129Xe NMR methods as described below.| Pore volume (cm3 g−1) | Pore size (nm) | Surface area (m2 g−1) | |||
|---|---|---|---|---|---|
| Micropore (t-plot) | Mesopore (BJH) | Mesopore (BJH) | Average (BET) | Micropore (t-plot) | |
| N1 | 0.00385 | 0.256 | 6.54 | 130 | 14.1 |
| N2 | 0.00321 | 0.261 | 6.61 | 126 | 12.5 |
| N3 | 0.00213 | 0.264 | 6.66 | 123 | 10.1 |
| N4 | 0.00130 | 0.274 | 7.43 | 112 | 7.89 |
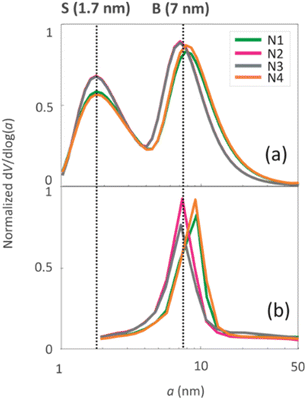
The pore size distributions of the samples were determined by N2 sorption33 and 1H NMR cryoporometry30,31 measurements. The N2 pore size distribution obtained by the BJH method (desorption curve) is limited to the mesoporous range, while the NMR cryoporometry can probe both micro- and mesopores.49 The pore size distributions (Fig. 5a) fitted from NMR cryoporometry (Fig. S3†) include two peaks for all the samples, one from micropores and another from mesopores. The mesopore peak is centred around 7 nm, being in good agreement with the single peak observed by N2 sorption (Fig. 5b). The micropore peak is centred around 1.7 nm. According to the N2 sorption data shown in Table 2, the micropore volume decreases while mesopore volume increases with longer NH4OH treatment time.
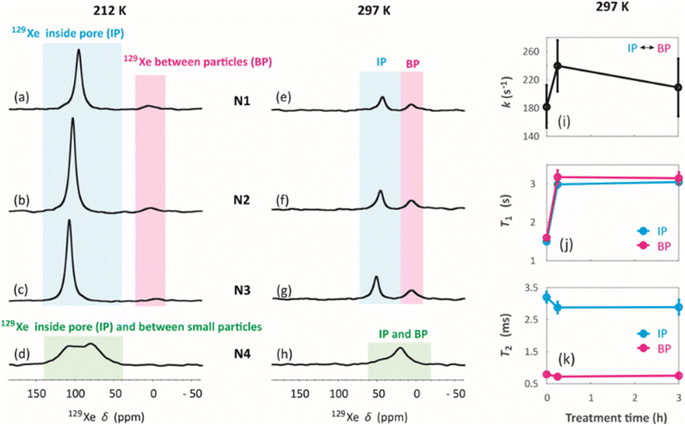
129Xe spectra were collected at variable temperatures from 212 to 324 K to study pore accessibility (Fig. S1†). As seen in Fig. 6, two peaks are observed for samples N1, N2 and N3 at low (212 K) and high (297 K) temperatures. The tall peak labelled as IP around 110 ppm at 212 K is assigned to Xe in small pores inside the particles. The chemical shift and its relatively small temperature dependency imply that the IP signal arises predominantly from Xe atoms in micropores.5,22 The small peak labelled as BP around 6 ppm is attributed to Xe between larger particles (55 to 250 μm).5,22 Due to the large interparticle void spaces, the chemical shift of the BP peak is close to the free gas shift and almost independent of temperature. In contrast, a single, very broad peak is observed for the N4 sample in the chemical shift range of 50 and 130 ppm at 212 K. This is interpreted to be a consequence of the smaller particle size of the N4 sample. According to Fig. 4d, contrary to other samples, the N4 sample has several particles in the range of 0.04 to 55 μm. Due to the decreased particle size, the exchange is faster between the intraparticle and interparticle pool, resulting in partial exchange average signals (intermediate exchange region).
Exchange rates k of Xe between the intraparticle and interparticle pores of N1, N2 and N3 were determined by selective inversion recovery experiments (Fig. S2†).24 The observed exchange rates (Fig. 6i) are in the range of 140–270 s−1, and within the error bars they are independent of the NH4OH treatment time.
129Xe T1 and T2 relaxation times (Fig. 6j and k) also reflect the dynamics of Xe in the geopolymer samples. Within the error bars, T1 relaxation times (1.5–3 s) of the IP and PB peaks are equal due to exchange averaging, as the relaxation rates (0.3–0.7 s−1) are much smaller than the exchange rates (140 to 270 s−1). T1 is longer (3 s) for the NH4OH-treated samples N2 and N3 than for the untreated N1 sample (1.5 s). This may be a consequence of changed surface interactions due to the partial Na+–NH4+ ion exchanges. T2 relaxation times (0.5–3.5 ms) are much shorter than the T1 relaxation times. According to relaxation modelling, fluctuations in the isotropic chemical shift are known to be dominating the T2 relaxation mechanism of 129Xe in porous materials because of the large chemical shift between the exchanging sites.50 Because T2 rates (300–2000 s−1) are higher than the exchange rates (140–270 s−1), T2 values are not exchange averaged; T2 of 129Xe in the intraparticle site is longer (about 3 ms) than that in the inter particle site (about 0.7 ms).
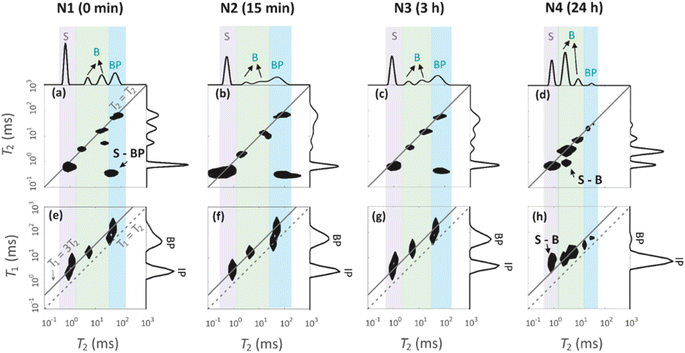
Four peaks are observed in the T2 distributions shown on the top of T2–T2 maps in Fig. 7a–d. The shortest T2 peak (label S) around T2 = 1 ms is interpreted to arise from water in the 1.7 nm micropores. The peaks (label B) in the region of 6–36 ms are assumed to represent water in the 7 nm mesopores. The longest T2 peak (label BP) is assigned for water in large voids in between the particles. The BP signal of the N4 sample has a smaller amplitude and shorter T2 than the other samples. This is because the smaller particles of N4 leave less space for the free water between the particles.
T1 distributions are shown on the right of the T1–T2 maps in Fig. 7e–h. T1 values are systematically longer than T2 values. The T1 distributions include two peaks around 5 and 50 ms, which are attributed to the water inside the intraparticle pores (IP) and the water inside the interparticle pores (BP). The micropore and mesopore peaks S and B observed in the T2 distributions are expected to fuse in the T1 distributions due to exchange; this implies that the micropore–mesopore exchange rate of water is between the T1 and T2 relaxation rates, i.e., in the range of 200–1000 s−1. The cross-peak S-BP visible in the T2–T2 exchange maps (Fig. 7a–d) shows that there is also an exchange between the intraparticle and interparticle pools. The T1–T2 maps show the correlations between the T1 and T2 relaxation time values and confirm the above-mentioned interrelated assignments of the peaks in the T1 and T2 distributions.
4. Conclusions
We studied the effect of mild NH4OH treatment on a metakaolin-based geopolymer in terms of ion exchange, chemical structure, particle size, and pore structure.(1) The obtained DRIFT, accompanied by XRF results shows that ion exchange of the charge balancing alkali cations (i.e., Na+) with NH4+ was successfully achieved by this treatment.
(2) The solid-state NMR spectra and XRF data proved that the NH4OH treatment removed the extra-framework-Al from the geopolymer structure and also led to the desilication of the geopolymer framework.
(3) The particle size reduction resulting from NH4OH treatment was found by both laser diffraction particle-size analysis and SEM.
(4) After the NH4OH treatment, the pore volume and pore size were enlarged, but the pore accessibility and pore connectivity were not altered, as revealed by N2 sorption isotherms, 129Xe and 1H NMR.
The changes in the particle size and pore characteristics are considered to be due to desilication caused by NH4OH treatment.
In this study, the NH4OH treatment was carried out under mild conditions (0.02 M at room temperature) to ensure maintaining the structural integrity of the geopolymers. This resulted in limited ion-exchange efficiency as well as limited impact on the pore characteristics of the prepared materials. This work provides a new approach to simplifying the synthesis of ion-exchanged geopolymers with modified porosity as low-cost functional materials for catalysis and adsorption applications. Further investigation on the impact of NH4OH treatment under harsher conditions (for instance, NH4+ concentration ≥0.1 M, and moderate temperature range (323–353 K)) would be of high interest.
Conflicts of interest
There are no conflicts to declare.Acknowledgements
J. L. and P. K. are grateful for the support from the Kvantum Institute (University of Oulu), The University of Oulu and The Academy of Finland Profi5 project 326291 and 329477. S. M. is grateful for support from the Academy of Finland (grant no. 321701) and Marie Sklodowska-Curie Actions (grant no. 896824). V.-V. T. is grateful for the support from the European Research Council (grant no. 772110), the Academy of Finland (grant no. 340099) and the Kvantum Institute (University of Oulu). J. L. acknowledges the financial support from the French National Research Agency (ANR) (Projet-ANR-20-CE30-0021 HELPING), Finnish Foundation for Technology Promotion as well as Otto A. Malm Foundation. Part of the work was carried out with the support of the Centre for Material Analysis, University of Oulu, Finland. J. L. is particularly grateful for the help from Professor Patrick Berthault for working in CEA-Saclay.Notes and references
- H. Xu and J. S. J. Van Deventer, The geopolymerisation of alumino-silicate minerals, Int. J. Miner. Process., 2000, 59, 247–266 CrossRef CAS.
- P. Sazama, O. Bortnovsky, J. Dědeček, Z. Tvarůžková and Z. Sobalík, Geopolymer based catalysts—New group of catalytic materials, Catal. Today, 2011, 164, 92–99 CrossRef CAS.
- J. Davidovits, Properties of Geopolymer Cements, 1994 Search PubMed.
- J. Li, S. Mailhiot, H. Sreenivasan, A. M. Kantola, M. Illikainen, E. Adesanya, L. Kriskova, V.-V. Telkki and P. Kinnunen, Curing process and pore structure of metakaolin-based geopolymers: Liquid-state 1H NMR investigation, Cem. Concr. Res., 2021, 143, 106394 CrossRef CAS.
- J. Li, S. Mailhiot, H. Sreenivasan, A. M. Kantola, V.-V. Telkki and P. Kinnunen, 129Xe NMR analysis reveals efficient gas transport between inborn micro-, meso- and macropores in geopolymers, Cem. Concr. Res., 2022, 155, 106779 CrossRef CAS.
- Z. Liu and S. Ihl Woo, Recent Advances in Catalytic DeNOX Science and Technology, Catal. Rev., 2006, 48, 43–89 CrossRef CAS.
- N. Tang, K. Yang, Y. Alrefaei, J.-G. Dai, L.-M. Wu and Q. Wang, Reduce VOCs and PM emissions of warm-mix asphalt using geopolymer additives, Constr. Build. Mater., 2020, 244, 118338 CrossRef CAS.
- T. H. Tan, K. H. Mo, T.-C. Ling and S. H. Lai, Current development of geopolymer as alternative adsorbent for heavy metal removal, Environ. Technol. Innovation, 2020, 18, 100684 CrossRef.
- S. A. Rasaki, Z. Bingxue, R. Guarecuco, T. Thomas and Y. Minghui, Geopolymer for use in heavy metals adsorption, and advanced oxidative processes: A critical review, J. Cleaner Prod., 2019, 213, 42–58 CrossRef CAS.
- M. I. M. Alzeer, K. J. D. MacKenzie and R. A. Keyzers, Facile synthesis of new hierarchical aluminosilicate inorganic polymer solid acids and their catalytic performance in alkylation reactions, Microporous Mesoporous Mater., 2017, 241, 316–325 CrossRef CAS.
- H. Chen, Y. J. Zhang, P. Y. He, C. J. Li and L. C. Liu, Facile synthesis of cost-effective iron enhanced hetero-structure activated carbon/geopolymer composite catalyst for NH3-SCR: Insight into the role of iron species, Appl. Catal., A, 2020, 605, 117804 CrossRef CAS.
- Y. J. Zhang, L. C. Liu, L. L. Ni and B. L. Wang, A facile and low-cost synthesis of granulated blast furnace slag-based cementitious material coupled with Fe2O3 catalyst for treatment of dye wastewater, Appl. Catal., B, 2013, 138–139, 9–16 CrossRef CAS.
- M. I. M. Alzeer, K. J. D. MacKenzie and R. A. Keyzers, Porous aluminosilicate inorganic polymers (geopolymers): a new class of environmentally benign heterogeneous solid acid catalysts, Appl. Catal., A, 2016, 524, 173–181 CrossRef CAS.
- D. Verboekend, G. Vilé and J. Pérez-Ramírez, Hierarchical Y and USY Zeolites Designed by Post-Synthetic Strategies, Adv. Funct. Mater., 2012, 22, 916–928 CrossRef CAS.
- S. Karakus, New Trends in Ion Exchange Studies, BoD – Books on Demand, 2018 Search PubMed.
- S. J. O'Connor, K. J. D. MacKenzie, M. E. Smith and J. V. Hanna, Ion exchange in the charge-balancing sites of aluminosilicate inorganic polymers, J. Mater. Chem., 2010, 20, 10234–10240 RSC.
- T. R. Barbosa, E. L. Foletto, G. L. Dotto and S. L. Jahn, Preparation of mesoporous geopolymer using metakaolin and rice husk ash as synthesis precursors and its use as potential adsorbent to remove organic dye from aqueous solutions, Ceram. Int., 2018, 44, 416–423 CrossRef CAS.
- D. Wisser and M. Hartmann, 129Xe NMR on Porous Materials: Basic Principles and Recent Applications, Adv. Mater. Interfaces, 2021, 8, 2001266 CrossRef.
- Y.-Q. Song, Magnetic Resonance of Porous Media (MRPM): A perspective, J. Magn. Reson., 2013, 229, 12–24 CrossRef CAS PubMed.
- M. A. Javed, S. Komulainen, H. Daigle, B. Zhang, J. Vaara, B. Zhou and V.-V. Telkki, Determination of pore structures and dynamics of fluids in hydrated cements and natural shales by various 1H and 129Xe NMR methods, Microporous Mesoporous Mater., 2019, 281, 66–74 CrossRef CAS.
- B. Zhou, S. Komulainen, J. Vaara and V.-V. Telkki, Characterization of pore structures of hydrated cements and natural shales by 129Xe NMR spectroscopy, Microporous Mesoporous Mater., 2017, 253, 49–54 CrossRef CAS.
- V. V. Terskikh, I. L. Moudrakovski, S. R. Breeze, S. Lang, C. I. Ratcliffe, J. A. Ripmeester and A. Sayari, A General Correlation for the 129Xe NMR Chemical Shift−Pore Size Relationship in Porous Silica-Based Materials, Langmuir, 2002, 18, 5653–5656 CrossRef CAS.
- K. V. Romanenko, A. Fonseca, S. Dumonteil, J. B. Nagy, J.-B. d'Espinose de Lacaillerie, O. B. Lapina and J. Fraissard, 129Xe NMR study of Xe adsorption on multiwall carbon nanotubes, Solid State Nucl. Magn. Reson., 2005, 28, 135–141 CrossRef CAS PubMed.
- A. D. Bain and J. A. Cramer, A Method for Optimizing the Study of Slow Chemical Exchange by NMR Spin-Relaxation Measurements. Application to Tripodal Carbonyl Rotation in a Metal Complex, J. Magn. Reson., Ser. A, 1993, 103, 217–222 CrossRef CAS.
- J. H. Lee, C. Labadie, C. S. Springer and G. S. Harbison, Two-dimensional inverse Laplace transform NMR: altered relaxation times allow detection of exchange correlation, J. Am. Chem. Soc., 1993, 115, 7761–7764 CrossRef CAS.
- J. E. M. Snaar and H. Van As, A method for the simultaneous measurement of NMR spin-lattice and spin-spin relaxation times in compartmentalized systems, J. Magn. Reson., 1969, 1992(99), 139–148 Search PubMed.
- Y.-Q. Song, L. Venkataramanan, M. D. Hürlimann, M. Flaum, P. Frulla and C. Straley, T1–T2 Correlation Spectra Obtained Using a Fast Two-Dimensional Laplace Inversion, J. Magn. Reson., 2002, 154, 261–268 CrossRef CAS PubMed.
- J. H. Strange, M. Rahman and E. G. Smith, Characterization of porous solids by NMR, Phys. Rev. Lett., 1993, 71, 3589–3591 CrossRef CAS PubMed.
- O. V. Petrov and I. Furó, NMR cryoporometry: Principles, applications and potential, Prog. Nucl. Magn. Reson. Spectrosc., 2009, 54, 97–122 CrossRef CAS.
- R. M. E. Valckenborg, L. Pel and K. Kopinga, Combined NMR cryoporometry and relaxometry, J. Phys. D: Appl. Phys., 2002, 35, 249 CrossRef CAS.
- D. W. Aksnes, K. Førland and L. Kimtys, Pore size distribution in mesoporous materials as studied by 1 H NMR, Phys. Chem. Chem. Phys., 2001, 3, 3203–3207 RSC.
- J. Van Aelst, D. Verboekend, A. Philippaerts, N. Nuttens, M. Kurttepeli, E. Gobechiya, M. Haouas, S. P. Sree, J. F. M. Denayer, J. A. Martens, C. E. A. Kirschhock, F. Taulelle, S. Bals, G. V. Baron, P. A. Jacobs and B. F. Sels, Catalyst Design by NH4OH Treatment of USY Zeolite, Adv. Funct. Mater., 2015, 25, 7130–7144 CrossRef CAS.
- E. P. Barrett, L. G. Joyner and P. P. Halenda, The Determination of Pore Volume and Area Distributions in Porous Substances. I. Computations from Nitrogen Isotherms, J. Am. Chem. Soc., 1951, 73, 373–380 CrossRef CAS.
- B. C. Lippens and J. H. de Boer, Studies on pore systems in catalysts: V. The t method, J. Catal., 1965, 4, 319–323 CrossRef CAS.
- G. Pickett, Modification of the Brunauer—Emmett—Teller Theory of Multimolecular Adsorption, J. Am. Chem. Soc., 1945, 67, 1958–1962 CrossRef CAS.
- R. L. Vold, J. S. Waugh, M. P. Klein and D. E. Phelps, Measurement of Spin Relaxation in Complex Systems, J. Chem. Phys., 1968, 48, 3831–3832 CrossRef CAS.
- S. Meiboom and D. Gill, Modified Spin-Echo Method for Measuring Nuclear Relaxation Times, Rev. Sci. Instrum., 1958, 29, 688–691 CrossRef CAS.
- J. L. Markley, W. J. Horsley and M. P. Klein, Spin-Lattice Relaxation Measurements in Slowly Relaxing Complex Spectra, J. Chem. Phys., 1971, 55, 3604–3605 CrossRef CAS.
- S. Godefroy and P. T. Callaghan, 2D relaxation/diffusion correlations in porous media, Magn. Reson. Imaging, 2003, 21, 381–383 CrossRef CAS PubMed.
- L. Venkataramanan, Y.-Q. Song and M. D. Hurlimann, Solving Fredholm integrals of the first kind with tensor product structure in 2 and 2.5 dimensions, IEEE Trans. Signal Process., 2002, 50, 1017–1026 CrossRef.
- F. G. M. Aredes, T. M. B. Campos, J. P. B. Machado, K. K. Sakane, G. P. Thim and D. D. Brunelli, Effect of cure temperature on the formation of metakaolinite-based geopolymer, Ceram. Int., 2015, 41, 7302–7311 CrossRef CAS.
- M. S. Mohd Basri, F. Mustapha, N. Mazlan and M. R. Ishak, Rice Husk Ash-Based Geopolymer Binder: Compressive Strength, Optimize Composition, FTIR Spectroscopy, Microstructural, and Potential as Fire-Retardant Material, Polymers, 2021, 13, 4373 CrossRef CAS PubMed.
- M. Mookherjee, M. D. Welch, L. L. Pollès, S. A. T. Redfern and D. E. Harlov, Ammonium ion behaviour in feldspar: variable-temperature infrared and 2H NMR studies of synthetic buddingtonite, N(D,H)4AlSi3O8, Phys. Chem. Miner., 2005, 32, 126–131 CrossRef CAS.
- I. Mihailova, I. Uzunov and D. Mehandjiev, Waste Copper Slag/Aluminium Dross-Based Geopolymer, 2021 Search PubMed.
- P. He, M. Wang, S. Fu, D. Jia, S. Yan, J. Yuan, J. Xu, P. Wang and Y. Zhou, Effects of Si/Al ratio on the structure and properties of metakaolin based geopolymer, Ceram. Int., 2016, 42, 14416–14422 CrossRef CAS.
- M. R. Wang, D. C. Jia, P. G. He and Y. Zhou, Influence of calcination temperature of kaolin on the structure and properties of final geopolymer, Mater. Lett., 2010, 64, 2551–2554 CrossRef CAS.
- Q. Wan, F. Rao, S. Song, R. E. García, R. M. Estrella, C. L. Patiño and Y. Zhang, Geopolymerization reaction, microstructure and simulation of metakaolin-based geopolymers at extended Si/Al ratios, Cem. Concr. Compos., 2017, 79, 45–52 CrossRef CAS.
- W. C. Yoo, X. Zhang, M. Tsapatsis and A. Stein, Synthesis of mesoporous ZSM-5 zeolites through desilication and re-assembly processes, Microporous Mesoporous Mater., 2012, 149, 147–157 CrossRef CAS.
- J. Mitchell, J. B. W. Webber and J. H. Strange, Nuclear magnetic resonance cryoporometry, Phys. Rep., 2008, 461, 1–36 CrossRef CAS.
- P. Håkansson, M. Asadullah Javed, S. Komulainen, L. Chen, D. Holden, T. Hasell, A. Cooper, P. Lantto and V.-V. Telkki, NMR relaxation and modelling study of the dynamics of SF 6 and Xe in porous organic cages, Phys. Chem. Chem. Phys., 2019, 21, 24373–24382 RSC.
Footnote |
| † Electronic supplementary information (ESI) available. See DOI: https://doi.org/10.1039/d4ra03972f |
| This journal is © The Royal Society of Chemistry 2024 |

