 Open Access Article
A stable and visualized fatty acid-based phase transition material constructed by solid-phase molecular self-assembly for thermal management†
Chunda Ji *,
Jianbin Huang and
Yun Yan
Beijing National Laboratory for Molecular Sciences (BNLMS), College of Chemistry and Molecular Engineering, Peking University, Beijing 100871, China. E-mail: jichunda@pku.edu.cn
First published on 11th July 2024
Abstract
Fatty acids are excellent thermal management materials for thermal storage, release and preventing thermal runaway. However, the leakage of fatty acids leads to instability and prevents their application in thermal management. Herein, a stable and visualized fatty acid-based phase transition material P–S/PA was constructed through solid-state molecular self-assembly strategy from polydiallyldimethylammonium chloride (PDDA), sodium dodecyl benzene sulfonate (SDBS) and palmitic acid (PA). The electrostatic interaction between PDDA and SDBS and hydrophobic interaction between PA and SDBS can prevent PA leakage during phase transition, achieving stability. After 1000 cycles, the changes in the phase transition enthalpy (ΔHM, ΔHC) were less than 1%. The structural similarity also made P–S/PA phase transition visible, and the transmittance changed significantly from 0% to 68% during phase transition. In addition, P–S/PA can be remolded by hot-pressing without performance changes, showing temperature adjustability on varying the fatty acid carbon chain length. Thus, the stable and visualized P–S/PA fatty acid-based phase transition material constructed by solid-phase molecular self-assembly has promising application in thermal management.
Introduction
Thermal energy, the energy source of human survival, should be managed because uncontrolled thermal energy can cause disasters, such as volcanic eruptions, explosions and battery fires.1–5 Thermal management is the maintenance of the system temperature by absorbing or releasing thermal energy according to demand, which is widely employed in battery,6–9 buildings,10,11 solar engineering12 and biomedical13 fields.Fatty acids are excellent materials for thermal management due to their phase transition properties.14–16 As phase transition materials, fatty acids can absorb and release thermal energy by large quantities of latent heat during the phase transition process, with constant temperature. The phase transition temperature and enthalpy increase with the carbon chain length of fatty acids.17,18 Moreover, fatty acids are commonly used due to their superior properties, such as non-toxicity, good chemical and thermal stability and low cost.19
Instability or leakage is the biggest challenge in the application of fatty acids as thermal management materials.20–22 Fatty acids melt into liquids and flow easily above the phase transition temperature (Fig. S1†), which causes leakage and instability. A popular strategy to solve fatty acid leakage is the preparation of encapsulation materials23–27 such as porous material28–33 and microencapsulation.34–36 However, the instability of physical adsorption, tedious preparation and high cost of the encapsulant materials greatly restrict the application of fatty acids in thermal management. Therefore, the development of no-leakage strategies and construction of stable fatty acid-based phase transition materials are extremely important and challenging.
Visualization is an important and unnoticed property of phase transition materials during thermal management.37,38 Thermal management relies on phase transition and has an energy management scope. Phase transition completion indicates the loss of thermal management ability; consequently, continuous heat generation will lead to thermal runaway. Thus, the phase transition should be visualized to alert and prevent the occurrence of thermal runaway accidents. Therefore, the molecular structure of encapsulation materials should be similar to fatty acids for visualization, which is undoubtedly another major challenge for fatty acid-based thermal management materials.
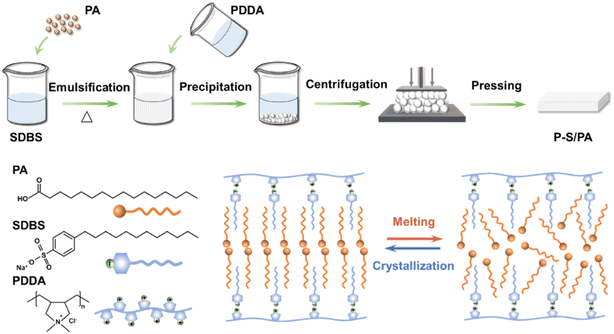
Recently, we developed a strategy of solid-phase molecular self-assembly39–42 for the large-scale fabrication of supramolecular materials by surfactants and polyelectrolytes through electrostatic interactions. Surfactants, such as sodium dodecyl benzene sulfonate (SDBS), have hydrophilic head groups and hydrophobic long carbon chains, which are similar to the fatty acid structure, as shown in Scheme 1. For SDBS, on the one hand, the hydrophobic long carbon chains can interact with fatty acids by hydrophobic interaction; on the other hand, the hydrophilic head groups can combine with the polyelectrolyte polydiallyldimethylammonium chloride (PDDA) through electrostatic interaction. Thus, stable and visualized fatty acid-based phase transition materials can be constructed through solid-phase molecular self-assembly.
 | ||
| Scheme 1 Construction of P–S/PA fatty acid-based phase transition material by solid-phase molecular self-assembly. | ||
In this work, a stable and visualized fatty acid-based phase transition material P–S/PA was constructed through solid-state molecular self-assembly strategy from PDDA, SDBS and palmitic acid (PA) (Scheme 1) for thermal management. The electrostatic interaction and hydrophobic interaction can prevent PA leakage during phase transition, achieving stability. The structural similarity between PA and SDBS leads to the visualization of P–S/PA phase transition with obvious transmittance change. In addition, P–S/PA can be remolded by adjusting the temperature. The construction of the stable and visualized P–S/PA phase transition material by solid-state molecular self-assembly can prevent fatty acid leakage and reduce thermal runaway disaster, showing promising application in thermal management.
Results and discussion
Structural characterization
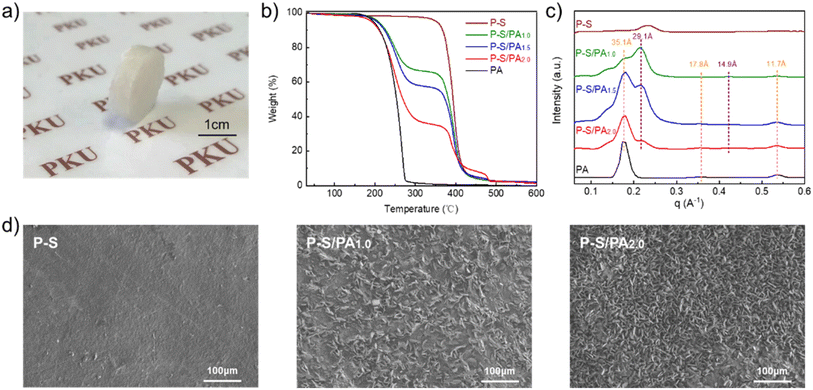
Fatty acid-based phase transition material P–S/PA was constructed by solid-phase molecular self-assembly from PDDA, SDBS and PA. PDDA (0.1 mol L−1, 10 mL) and SDBS (0.1 mol L−1, 10 mL) heated to 70 °C, separately. Then, PA (0.5 g) was gradually added to SDBS solution with constant stirring to be emulsified. Next, PDDA solution was poured into the SDBS/PA solution, and the precipitates were formed immediately, which were collected by centrifugation. Finally, the fatty acid-based phase transition material P–S/PA was prepared by mechanical pressing, as described in Scheme 1.Fig. 1a shows the photograph of P–S/PA, and the PA content can be measured by TGA, as shown in Fig. 1b. Here, P–S/PA is denoted as P–S/PAx, where x represents the molar ratio of PA to SDBS, and the PA content in P–S/PA2.0 is ∼60 wt%. The structure of P–S/PA was characterized by two-dimensional (2D) wide-angle X-ray scattering (WAXS) (Fig. S2†). Bragg diffraction peaks, corresponding to distances of 35.1 Å, 29.1 Å, 17.8 Å, 14.9 Å and 11.7 Å, were observed (Fig. 1c), indicating the presence of lamellar structures in P–S/PA. The thickness was determined to be 35.1 Å and 29.1 Å, approximately two times the length of extended SDBS and PA molecule (Fig. S3†), respectively. SDBS and PA molecules were assembled into bilayers in P–S/PA because of the hydrophobic interaction (as shown in Scheme 1). The SEM images of P–S/PA are displayed in Fig. 1d. The P–S surface is compact and flat, while P–S/PA has a rough surface and sharp edges due to the PA crystallization. Moreover, the crystals become more uniform due to the emulsification of SDBS, compared with pure PA (Fig. S4†). The results also indicate that SDBS has similar structure to PA.
 | ||
| Fig. 1 (a) Photograph of P–S/PA; (b) TG curves, (c) one-dimensional curves of WAXS and (d) SEM images of P–S/PA with different PA contents. | ||
Thermal performance and stability
Thermal performance, storage or release of energy (melting enthalpy ΔHM, crystallization enthalpy ΔHC, melting temperature TM and crystallization temperature TC) during heating and cooling, is an important indicator for thermal management applications. The thermal performance of P–S/PA was investigated through DSC, and the heating curves are shown in Fig. 2a (cooling curves, Fig. S7†). As the PA content increases, there are obvious melting peaks, which proves the phase transition and existence of thermal management capability of P–S/PA. The ΔHM and ΔHC of P–S/PA are shown in Fig. 2b and increase with the PA content. The thermal performances are summarized in Table 1. It is worth noting that the TM and TC of P–S/PA increases with the PA content and is close to that of pure PA. The encapsulated P–S can affect the PA thermal performance in P–S/PA. The long carbon chains of SDBS participate in the melting or crystallization behavior of PA, according to XRD (Fig. 2c). The sharp and intense peaks at 7.36°, 12.3°, 21.5°, and 23.9° are the PA characteristics and they are all observed in P–S/PA, but the peak intensity has changed, proving that the PA crystal structure changes. The difference between P–S/PA and PA is attributed to the similar long carbon chain structure of SDBS and PA. The long carbon chain of SDBS affects the arrangement of carbon chains in PA, resulting in differences in the crystal structure and thermal properties. | ||
| Fig. 2 (a) DSC heating curves of P–S/PA with different PA contents; (b) melting enthalpy ΔHM and crystallization enthalpy ΔHC of P–S/PA; (c) XRD diagrams of P–S/PA. | ||
| Melting process | Crystallization process | PA content (wt%) | |||
|---|---|---|---|---|---|
| TM (°C) | ΔHM (J g−1) | TC (°C) | ΔHC (J g−1) | ||
| P–S/PA1.0 | 47.3 | 2.4 | 29.2 | 1.1 | 33.2 |
| P–S/PA1.5 | 54.2 | 26.6 | 32.8 | 22.6 | 42.5 |
| P–S/PA2.0 | 60.5 | 107.3 | 52.7 | 100.2 | 61.6 |
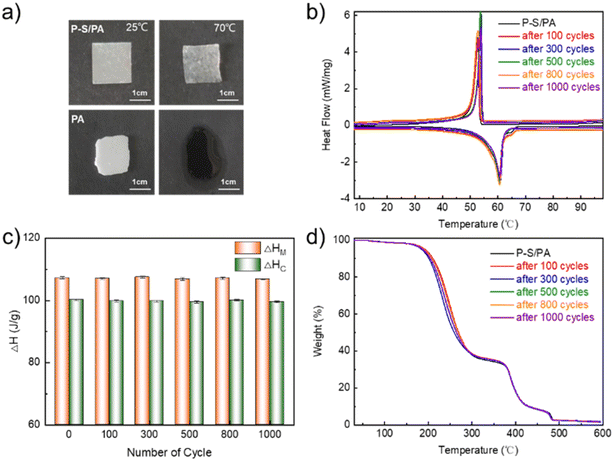
Stability, no leakage of fatty acids and no change in the thermal properties after multiple thermal cycles are the prerequisites for thermal management application. Pure PA melts into flowing liquids at 70 °C, which is prone to leakage, while P–S/PA maintains solid-like properties without flowing, as shown in Fig. 3a. For stability, the thermal properties of P–S/PA after multiple thermal cycles were measured. The DSC curves of P–S/PA after 1000 thermal cycles are shown in Fig. 3b, and the thermal performance parameters are summarized in Table 2. The phase transition enthalpy does not decrease (<1%) after 1000 thermal cycles (Fig. 3c). This demonstrates the excellent thermal stability of P–S/PA. In addition, the TG data (Fig. 3d) also prove that there is no PA leakage after 1000 thermal cycles. The hydrophobic interaction of PA and SDBS and the electrostatic interaction between PDDA and SDBS can prevent PA leakage and achieve the construction of stable fatty acid-based phase transition materials, which is important for thermal management.
 | ||
| Fig. 3 (a) Photographs of P–S/PA and PA at 25 °C and 70 °C; (b) DSC curves (c) melting enthalpy ΔHM and crystallization enthalpy ΔHC and (d) TG curves of P–S/PA after multiple thermal cycles. | ||
| Cycles | Melting process | Crystallization process | PA content (wt%) | ||
|---|---|---|---|---|---|
| TM (°C) | ΔHM (J g−1) | TC (°C) | ΔHC (J g−1) | ||
| 0 | 60.5 | 107.3 | 52.7 | 100.2 | 61.6 |
| 100 | 60.5 | 107.1 | 52.8 | 99.8 | 61.3 |
| 300 | 60.4 | 107.5 | 52.7 | 99.8 | 61.4 |
| 500 | 60.3 | 106.9 | 52.5 | 99.5 | 61.5 |
| 800 | 60.5 | 107.2 | 52.5 | 100.1 | 61.2 |
| 1000 | 60.2 | 106.8 | 52.4 | 99.6 | 60.8 |
Visualization of phase transition
The visualization of phase transition as a warning is essential in the actual thermal management process, which can avoid thermal runaways and reduce safety accidents. Here, a visualized fatty acid-based phase transition material was designed from PA and SDBS with the structure similar to PA and PDDA. The transmittance of pure PA changes significantly during the phase transition (Fig. S1†); thus, the transmittance of P–S/PA is measured.The photographs of P–S/PA at 25 °C (crystallize) and 70 °C (melting) are shown in Fig. 4a and it is characterized by UV-vis spectrum (Fig. 4b). After melting, the P–S/PA transmittance changes from 0% to 68% (@600 nm). The phase transition of P–S/PA is visualized, because of the structural similarity between SDBS and PA, which can serve as a warning for thermal management completion. Moreover, the transmittance of P–S/PA has an obvious change during phase transition after 100 cycles (Fig. 4c). This indicates that the visualized fatty acid-based phase transition material P–S/PA is successfully constructed through the structural similarity of PA and SDBS.
 | ||
| Fig. 4 (a) Photographs of P–S/PA at 25 °C and 70 °C; (b) transmittance of P–S/PA at 25 °C and 70 °C; (c) transmittance (@600 nm) of P–S/PA after multiple cycles. | ||
Temperature adjustability and remolding
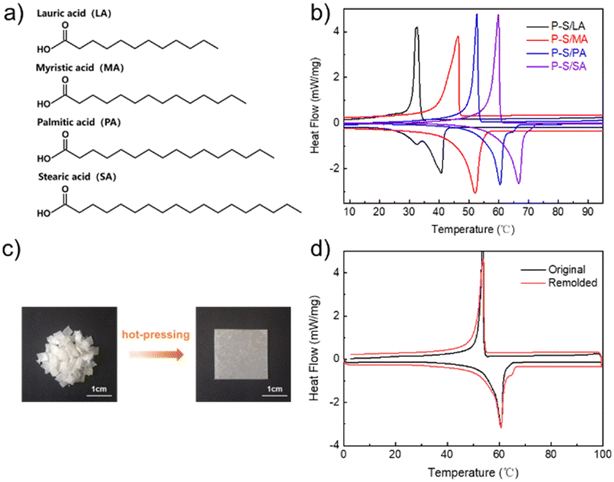
Phase transition temperature (TM, TC) is the basic parameter in the thermal management process. The thermal management material with temperature adjustability is excellent and can meet the requirements of application scenarios. For P–S/PA, the temperature adjustability is achieved by changing the fatty acids' carbon chain length (Fig. 5a). Fig. 5b shows the DSC curves of P–S/fatty acids with different carbon chain lengths. The TM of P–S/LA is 40.7 °C, while it is 67.5 °C for P–S/SA. Due to the structure similarity of fatty acids and SDBS, all fatty acid-based phase transition materials have excellent thermal properties and stability (Table S1†). | ||
| Fig. 5 (a) Molecular structures of fatty acids with different carbon chain lengths; (b) DSC curves of P–S/fatty acids; (c) remolding process of P–S/PA; (d) DSC curves of P–S/PA after remolding. | ||
Material damage is inevitable and easily causes leakage or instability, such as porous encapsulation materials. P–S/PA, the stable and visualized fatty acid-based phase transition material, can be remolded after damage, except for non-leakage due to the structural similarity of PA and SDBS. Above the TM, P–S/PA can be remolded under mechanical pressure, as shown in Fig. 5c, and the thermal properties of P–S/PA do not change after remodeling (Fig. 5d and Table S2†). This is beneficial to improve the materials utilization in thermal management applications.
Thermal management behavior
Thermal storage and release is an intuitive manifestation of thermal management; the thermal management behavior of P–S/PA was thus investigated. The sample was placed on a heating apparatus (75 °C) for thermal energy storage; after completing phase transition, it was quickly removed for cooling and thermal energy release. The heating and cooling processes were recorded and observed.The temperature of P–S/PA gradually increases from 25 °C to 75 °C and was kept constant at ∼60 °C for 3 min during the heating process (Fig. 6a). The temperature platform corresponds to the thermal energy storage with P–S/PA solid–liquid phase transition. During the cooling process, the P–S/PA temperature reached the platform at about ∼53 °C (TC for P–S/PA) and the stabilization time was about 2 min, suggesting the thermal energy release. The temperature of the P–S/PA sample gradually recovered to the ambient temperature under natural cooling after the phase transition. Fig. 6b presents the temperature–time curves during the thermal storage and release. The temperature platform is observed, which is the melting and crystalline transition of P–S/PA, respectively. Stable and visualized fatty acid-based phase transition material P–S/PA thus exhibited excellent thermal management performance.
Conclusion
We have reported the construction of a stable and visualized fatty acid-based phase transition material P–S/PA through the solid-state molecular assembly from PDDA, SDBS and PA for thermal management. The electrostatic interaction of PDDA and SDBS and hydrophobic interaction between PA and SDBS can prevent PA leakage during phase transition, achieving stability for thermal management. After 1000 thermal cycles, the phase transition enthalpy changes less than 1%. The structure similarity between PA and SDBS also makes the P–S/PA phase transition visible. The transmittance changes significantly from 0% to 68% during phase transition. In addition, P–S/PA fatty acid-based phase transition material can be remolded by hot-pressing, without performance changes, and thus shows temperature adjustability on varying the fatty acid carbon chain length change. The construction of stable and visualized P–S/PA phase transition material by solid-state molecular self-assembly can prevent the damage caused by thermal runaway, and it demonstrates excellent application prospects for thermal management.Experimental
The experimental details have been provided in the ESI.†Data availability
The data that support the findings of this study are available from the corresponding author [Chunda Ji, College of Chemistry and Molecular Engineering, Peking University] upon reasonable request.Author contributions
Chunda Ji for writing – original draft, data curation and investigation; Jianbin Huang for writing – review & editing and conceptualization; Yun Yan for writing – review & editing, resources and methodology.Conflicts of interest
No potential conflict of interest was reported by the authors.Acknowledgements
The authors acknowledge Peking University Analysis and Testing Center.References
- J. Cui, W. Li, Y. Wang, H. Yu, X. Feng, Z. Lou, W. Shan and Y. Xiong, Adv. Funct. Mater., 2021, 32, 2108000 CrossRef.
- Y. Kou, K. Sun, J. Luo, F. Zhou, H. Huang, Z. S. Wu and Q. Shi, Energy Storage Mater., 2021, 34, 508–514 CrossRef.
- C. Liu, F. Li, L. P. Ma and H. M. Cheng, Adv. Mater., 2010, 22, E28–E62 CAS.
- A. A. Mehrizi, H. Karimi-Maleh, M. Naddafi and F. Karimi, J. Energy Storage, 2023, 61, 106859 CrossRef.
- R. K. Mishra, K. Verma, V. Mishra and B. Chaudhary, J. Energy Storage, 2022, 50, 104166 CrossRef.
- Z. Ling, Z. Zhang, G. Shi, X. Fang, L. Wang, X. Gao, Y. Fang, T. Xu, S. Wang and X. Liu, Renewable Sustainable Energy Rev., 2014, 31, 427–438 CrossRef.
- Z. Ling, F. Wang, X. Fang, X. Gao and Z. Zhang, Appl. Energy, 2015, 148, 403–409 CrossRef CAS.
- Q. Huang, X. Li, G. Zhang, Y. Wang, J. Deng, C. Wang and T. Chen, ACS Appl. Energy Mater., 2021, 4, 1978–1992 CrossRef CAS.
- M. Fang, J. Zhou, H. Fei, K. Yang and R. He, Energy Fuels, 2022, 36, 4153–4173 CrossRef CAS.
- F. Souayfane, F. Fardoun and P. H. Biwole, Energy Build., 2016, 129, 396–431 CrossRef.
- Z. Fan, Y. Zhao, Y. Ding, Y. Shi, X. Liu and D. Jiang, J. Energy Storage, 2022, 55, 105710 CrossRef.
- L. Kong, Z. Wang, X. Kong, L. Wang, Z. Ji, X. Wang and X. Zhang, ACS Appl. Mater. Interfaces, 2021, 13, 29965–29974 CrossRef CAS.
- K. Ma, X. Zhang, J. Ji, L. Han, X. Ding and W. Xie, Biomater. Sci., 2021, 9, 5762–5780 RSC.
- Y. Yuan, N. Zhang, W. Tao, X. Cao and Y. He, Renewable Sustainable Energy Rev., 2014, 29, 482–498 CrossRef CAS.
- A. Sharma, V. V. Tyagi, C. R. Chen and D. Buddhi, Renewable Sustainable Energy Rev., 2009, 13, 318–345 CrossRef CAS.
- K. Pielichowska and K. Pielichowski, Prog. Mater. Sci., 2014, 65, 67–123 CrossRef CAS.
- K. Tuncbilek, A. Sari, S. Tarhan, G. Ergunes and K. Kaygusuz, Energy, 2005, 30, 677–692 CrossRef CAS.
- D. Rozanna, T. G. Chuah, A. Salmiah, T. S. Y. Choong and M. Sa'ari, Int. J. Green Energy, 2005, 1, 495–513 CrossRef.
- S. Kahwaji, M. B. Johnson, A. C. Kheirabadi, D. Groulx and M. A. White, Sol. Energy Mater. Sol. Cells, 2017, 167, 109–120 CrossRef CAS.
- X. Huang, X. Chen, A. Li, D. Atinafu, H. Gao, W. Dong and G. Wang, Chem. Eng. J., 2019, 356, 641–661 CrossRef CAS.
- A. Chakrabarty and Y. Teramoto, ACS Appl. Polym. Mater., 2021, 3, 5441–5451 CrossRef CAS.
- A. R. Akhiani, M. Mehrali, S. Tahan Latibari, M. Mehrali, T. M. I. Mahlia, E. Sadeghinezhad and H. S. C. Metselaar, J. Phys. Chem. C, 2015, 119, 22787–22796 CrossRef CAS.
- P. P. Zhao, C. Deng, Z. Y. Zhao, S. C. Huang, P. Lu and Y. Z. Wang, ACS Appl. Mater. Interfaces, 2020, 12, 28700–28710 CrossRef CAS PubMed.
- M. M. Umair, Y. Zhang, K. Iqbal, S. Zhang and B. Tang, Appl. Energy, 2019, 235, 846–873 CrossRef CAS.
- M. H. Sipponen, A. Henn, P. Penttilä and M. Österberg, Chem. Eng. J., 2020, 393, 124711 CrossRef CAS.
- M. M. Kenisarin and K. M. Kenisarina, Renewable Sustainable Energy Rev., 2012, 16, 1999–2040 CrossRef CAS.
- J. H. Jing, H. Y. Wu, Y. W. Shao, X. D. Qi, J. H. Yang and Y. Wang, ACS Appl. Mater. Interfaces, 2019, 11, 19252–19259 CrossRef CAS PubMed.
- Z. Wang, G. Huang, Z. Jia, Q. Gao, Y. Li and Z. Gu, Materials, 2022, 15, 6856 CrossRef CAS.
- L. P. Vandana and R. Ramadoss, J. Energy Storage, 2023, 65, 107258 CrossRef.
- C. Ao, S. Yan, S. Zhao, W. Hu, L. Zhao and Y. Wu, Energy Rep., 2022, 8, 4834–4843 CrossRef.
- Q. Zhang and J. Liu, Sol. Energy Mater. Sol. Cells, 2018, 179, 217–222 CrossRef CAS.
- J. Wang, H. Xie, Z. Xin, Y. Li and L. Chen, Sol. Energy, 2010, 84, 339–344 CrossRef CAS.
- J. Wang, H. Xie, Z. Xin and Y. Li, Carbon, 2010, 48, 3979–3986 CrossRef CAS.
- R. Zhang, D. Chen, L. Chen, X. Cao, X. Li and Y. Qu, J. Energy Storage, 2022, 51, 104546 Search PubMed.
- Y. Wang, T. D. Xia, H. X. Feng and H. Zhang, Renew. Energy, 2011, 36, 1814–1820 CrossRef CAS.
- X. Liu, A. Fleischer and G. Feng, ACS Appl. Polym. Mater., 2021, 3, 2341–2351 CrossRef CAS.
- G. Xu, H. Xia, P. Chen, W. She, H. Zhang, J. Ma, Q. Ruan, W. Zhang and Z. Sun, Adv. Funct. Mater., 2021, 32, 2109597 CrossRef.
- R. Zhang, B. Xiang, Y. Shen, L. Xia, L. Xu, Q. Guan and S. Tang, J. Mater. Chem. A, 2021, 9, 17481–17491 RSC.
- H. Jin, C. Ma, W. Wang, Y. Cai, J. Qi, T. Wu, P. Liao, H. Li, Q. Zeng, M. Xie, J. Huang and Y. Yan, ACS Mater. Lett., 2021, 4, 145–152 Search PubMed.
- H. Jin, M. Xie, W. Wang, L. Jiang, W. Chang, Y. Sun, L. Xu, S. Zang, J. Huang, Y. Yan and L. Jiang, CCS Chem., 2020, 2, 98–106 CrossRef CAS.
- J. Qi, T. Wu, W. Wang, H. Jin, S. Gao, S. Jiang, J. Huang and Y. Yan, Aggregate, 2022, 3, e173 CrossRef CAS.
- T. Wu, S. Gao, W. Wang, J. Huang and Y. Yan, ACS Appl. Mater. Interfaces, 2021, 13, 41997–42004 CrossRef CAS.
Footnote |
| † Electronic supplementary information (ESI) available. See DOI: https://doi.org/10.1039/d4ra03966a |
| This journal is © The Royal Society of Chemistry 2024 |

