 Open Access Article
Zr6O8 core cluster with formula unit [Zr6O4(OH)4(OH2)8(CH3COO)4(SO4)4]·nH2O obtained under mild conditions†
Andrea Y. Garzón-Serranoa,
Johan D. Lozanob,
Leon D. Perez a,
César A. Sierra*a and
Mario A. Macías
 *b
*b
aGrupo de Investigación en Macromoléculas, Departamento de Química, Universidad Nacional de Colombia, Bogotá, 111321, Colombia. E-mail: casierraa@unal.edu.co
bCrystallography and Chemistry of Materials, CrisQuimMat, Department of Chemistry, Universidad de los Andes, Bogotá, 111711, Colombia. E-mail: ma.maciasl@uniandes.edu.co
First published on 19th September 2024
Abstract
During attempts to synthesize zirconium-based MOFs, we have obtained a new crystal structure of the cluster with Zr6O8 core and formula unit [Zr6O4(OH)4(OH2)8(CH3COO)4(SO4)4]·nH2O. Unlike other systems, mild conditions were employed in this case; no strong acids or hydrothermal conditions were required. The molecular assembly in the crystal is characterized by strong O–H⋯O hydrogen bonds connecting neighboring molecules, allowing the formation of a three-dimensional maze of tunnels with H2O molecules stabilizing the framework. Noteworthy, at 100 °C, the strong Zr6O8 core and the O–H⋯O hydrogen bonds help form a system where the molecular cluster is conserved, but the long-range order is lost. FT-IR, Raman, TGA, DSC, and X-ray diffraction techniques were used to characterize the title compound.
Introduction
An interesting group of compounds denominated as clusters with a Zr6O8 core has recently been a focus of research.1 These clusters are characterized by high symmetry, which provides attractive possibilities for synthesizing materials assembled from Zr6 clusters used as building blocks. Among these structures, Zr6O4(OH)4(OOCR)12 clusters are formed by μ3-O and μ3-OH groups capping the Zr6 octahedron, where each Zr atom is coordinated by 8 oxygen atoms (2μ3-O, 2μ3-OH, and 4 from carboxylate ligands).1 Although there are few reports, the literature shows derivatives of Zr6O4(OH)4(OOCR)12 clusters with R = Me,2 tBu or CMe2Et,3 isostructural compounds with the long ago reported U6O4(OH)4[O2P(OPh)2]12 structure, changing the carboxylate ligands by diphenylphosphate.4 Revising alternative possibilities regarding the ligands, the coordination sphere of the Zr6O8 cluster core can be modified during the synthesis, making post-synthetic ligand exchange also possible. Methacrylate ligands of Zr6O4(OH)4(methacrylate)12 clusters can be completely changed by the addition of propionic or isobutyric acids,5 however, partial exchange is also possible, for example, in the formation of [Zr6O4(OH)4(OOCR)11(acac)]2 where the bridging carboxylate ligands are not completely substituted from the precursor [Zr6O4(OH)4(OOCR)12]2 (R = Et, CH2CH![[double bond, length as m-dash]](https://www.rsc.org/images/entities/char_e001.gif) CH2) cluster treated acetylacetone.6 Similarly, mixtures of acids (RCOOH and sulfuric acid) with ZrOCl2 under hydrothermal conditions and temperatures as high as 60 °C during 24 h can lead to the formation of clusters with different ligands, as in the compounds Zr6O4(OH)4(OOCR)4(SO4)4(H2O)8 (R = H, Me, Et) and [Zr6O4(OH)4(OH2)8(CH3COO)4(SO4)4]·2HCl·3H2O.7 On the other hand, metal–organic frameworks (MOFs) have stood out for their physicochemical properties and the wide range of possible uses. Among all the reported structures, zirconium-based MOFs (Zr-MOF) draw attention due to their stability in water, becoming materials of high interest for environmental applications.8 Sometimes, these MOFs are synthesized using modulators to improve their reproducibility, increase their crystallinity, and control the microstructure of the obtained samples.9,10 From the available diverse modulators, monocarboxylic acids have been demonstrated to be excellent candidates in the obtention of Zr-MOFs based on water synthesis.11,12 Recently, in our attempts to synthesize zirconium-based MOFs using as precursors phenolic acids as organic ligands, zirconium sulfate, water/ethanol solvents, and acetic acid as a modulator, we obtained a new crystal structure variation of [Zr6O4(OH)4(OH2)8(CH3COO)4(SO4)4]·2HCl·3H2O with general formula [Zr6O4(OH)4(OH2)8(CH3COO)4(SO4)4]·nH2O.7 Interestingly, this cluster is only obtained in the presence of phenolic acids, suggesting that these compounds control the pH in the reaction media to facilitate the formation of the cluster. Therefore, in this work, the synthesis and structural characterization of the cluster [Zr6O4(OH)4(OH2)8(CH3COO)4(SO4)4]·nH2O is reported. For this purpose, TGA/DSC, FT-IR, and X-ray diffraction techniques were employed, along with computational calculations, to extract relevant data about the structural stability of the title compound.
CH2) cluster treated acetylacetone.6 Similarly, mixtures of acids (RCOOH and sulfuric acid) with ZrOCl2 under hydrothermal conditions and temperatures as high as 60 °C during 24 h can lead to the formation of clusters with different ligands, as in the compounds Zr6O4(OH)4(OOCR)4(SO4)4(H2O)8 (R = H, Me, Et) and [Zr6O4(OH)4(OH2)8(CH3COO)4(SO4)4]·2HCl·3H2O.7 On the other hand, metal–organic frameworks (MOFs) have stood out for their physicochemical properties and the wide range of possible uses. Among all the reported structures, zirconium-based MOFs (Zr-MOF) draw attention due to their stability in water, becoming materials of high interest for environmental applications.8 Sometimes, these MOFs are synthesized using modulators to improve their reproducibility, increase their crystallinity, and control the microstructure of the obtained samples.9,10 From the available diverse modulators, monocarboxylic acids have been demonstrated to be excellent candidates in the obtention of Zr-MOFs based on water synthesis.11,12 Recently, in our attempts to synthesize zirconium-based MOFs using as precursors phenolic acids as organic ligands, zirconium sulfate, water/ethanol solvents, and acetic acid as a modulator, we obtained a new crystal structure variation of [Zr6O4(OH)4(OH2)8(CH3COO)4(SO4)4]·2HCl·3H2O with general formula [Zr6O4(OH)4(OH2)8(CH3COO)4(SO4)4]·nH2O.7 Interestingly, this cluster is only obtained in the presence of phenolic acids, suggesting that these compounds control the pH in the reaction media to facilitate the formation of the cluster. Therefore, in this work, the synthesis and structural characterization of the cluster [Zr6O4(OH)4(OH2)8(CH3COO)4(SO4)4]·nH2O is reported. For this purpose, TGA/DSC, FT-IR, and X-ray diffraction techniques were employed, along with computational calculations, to extract relevant data about the structural stability of the title compound.
Experimental
Synthesis
Several solutions were prepared during the attempts to synthesize zirconium-based MOFs. Initially, dissolutions of 478.26 mg of gallic acid (GA) and 378.27 mg of protocatechuic acid (PCA) in 5 mL of ethanol, respectively, were performed, as well as the preparation of the solution containing 496.36 mg of Zr(SO4)2·4H2O (Zr) in 5 mL of deionized water. Each solution was placed in a sonicator bath for 5 min to ensure complete dissolution of the constituents. Then, five vials were prepared: (vial 1) 0.5 mL of the modulator (acetic acid) and 1.0 mL of GA; (vial 2) 0.5 mL of the modulator (acetic acid) and 1.0 mL of PAC; (vial 3) 1.0 mL of GA; (vial 4) 1.0 mL of PAC; and (vial 5) 1.0 mL of ethanol and 0.5 mL of the modulator (acetic acid). Subsequently, the five vials were agitated at room temperature, while 1.0 mL of the metal salt solution (Zr) was added dropwise to each vial, obtaining five systems. At the end of this stage, the vials were allowed to rest for 15 minutes and then placed under constant agitation for 24 hours. The recovery of the white solids obtained was carried out by three washing cycles using water/ethanol solutions. Surprisingly, no vial contained the zirconium-based MOF structure. Instead, in vial 1 and vial 2 systems, the [Zr6O4(OH)4(OH2)8(CH3COO)4(SO4)4]·nH2O cluster was identified and subsequently characterized (yields: 45% and 32% for vials 1 and 2, respectively).Characterization
Infrared spectroscopy
Infrared spectra were acquired using a Shimadzu IR-Tracer100 spectrophotometer at room temperature in the 400–4000 cm−1 region. The measurement resolution was ±8 cm−1, and LabSolutionsIR software was used for the data analysis.Raman spectroscopy
Raman spectra were acquired using a HORIBA-Scientific model XploRa-One spectrophotometer at room temperature in the 200–4000 cm−1 region. The excitation wavelength was set at 532 nm, with an acquisition time of 5 s, 15 accumulations, and an objective lens of 100×/0.75 NIR. Spectral LabSpec 6 software was used for the data analysis.Thermogravimetric analysis
TGA traces were recorded using a TGA550 thermogravimetric analyzer. The measurements were performed under a nitrogen atmosphere heating from 35 °C to 800 °C at 10 °C min−1, and the TGA1000 software was used for the data analysis.Differential scanning calorimetry
DSC traces were recorded using a PerkinElmer DSC2-00194 instrument under a nitrogen atmosphere. For the analysis, cluster samples (4 mg) were placed in a non-hermetic aluminum pan heated from −30° to 360 °C at 20 °C min−1 scan rate. Indium was used as the reference.Single crystal X-ray diffraction
Data acquisition was performed at room temperature (298 K) using an Agilent SuperNova, Dual (Cu at zero position) Atlas four-circle diffractometer equipped with a CCD plate detector, using CuKα radiation (λ = 1.54184 Å), and ω scans. The data integration and the absorption effect correction were carried out using the CrysAlis PRO software package.13 The crystal structure of the cluster was determined by applying an iterative algorithm,14 followed by the difference Fourier map method to obtain missing atoms. Once the structure was resolved entirely, the refinement was performed using the SHELXL2018/3 software.15 During the refinements, the non-hydrogen atoms were treated anisotropically. The hydrogen atoms in this structure were generated geometrically and placed in calculated positions (C–H: 0.96 Å; O–H: 0.82 Å). These H atoms were refined isotropically as riding contributions with displacement parameters set at 1.2 (O–H) and 1.5 (C–H) times the Ueq of the respective parent atom. Molecular and supramolecular graphics were generated using Mercury software.16 The data collection and refinement details are given in Table 1. Energy frameworks describing the intermolecular interaction energies and the volume occupied by the solvent were computed based on CE-HF energy models and the procrystal electron density, respectively, using the CrystalExplorer program.17–19| Crystal data | Cluster |
|---|---|
| a Solvent molecules calculated based on the procrystal electron density using the CrystalExplorer software and the CIF file. This value changes to 17 when the TGA information is considered. | |
| Chemical formulaa | C8H32O40S4Zr6, 13[H2O] |
| Mr | 1678.13 |
| Crystalline system, space group | Monoclinic, Cc |
| a, b, c (Å) | 13.9608(13), 27.9958(19), 14.7493(11) |
| α, β, γ (°) | 90, 116.436(11), 90 |
| Volume, (Å3) | 5161.9(8) |
| ρ, g cm−3 | 1.837 |
| Z | 4 |
| Temperature, (K) | 298(2) |
| Radiation type | Cu Kα |
| μ (mm−1) | 12.29 |
| Theta range for data collection | 3.873° < 2θ < 76.086° |
| Index range | −11 ≤ h ≤ 17, −30 ≤ k ≤ 35, −18 ≤ l ≤ 17 |
![[thin space (1/6-em)]](https://www.rsc.org/images/entities/char_2009.gif) |
|
| Data collection | |
| Diffractometer | SuperNova, dual, Cu at zero, atlas |
| Absorption correction | Multi-scan (CrysAlis PRO 1.171.38.43) |
| Tmin, Tmax | 0.637, 1.000 |
| No. of measured, independent, and observed reflections [I > 2σ(I)] | 13![[thin space (1/6-em)]](https://www.rsc.org/images/entities/char_2009.gif) 186, 6972, 5931 186, 6972, 5931 |
| Rint | 0.06 |
| (Sin θ/λ)max (Å−1) | 0.630 |
![[thin space (1/6-em)]](https://www.rsc.org/images/entities/char_2009.gif) |
|
| Refinement | |
| R[F2 > 2σ(F2)], wR(F2), S | 0.051, 0.143, 1.04 |
| No. of reflections | 6972 |
| Refined parameters | 533 |
| No. of restraints | 86 |
| H-atoms treatment | H-atom parameters constrained |
| Δρmax, Δρmin (e Å−3) | 1.61, −1.28 |
Powder X-ray diffraction
Data acquisition was performed using a Panalytical Empyrean diffractometer in a Bragg–Brentano type focusing geometry using a CuKα1 radiation source (1.5406 Å). The diffraction pattern was obtained in an angular range of 5–70° (2θ). Le Bail analysis was performed to evaluate the purity of the sample using the Jana software.20 The refinement was carried out assuming a pseudo-Voigt function to model the peak shapes, and the background was calculated through linear interpolation between a set of fixed points.Results and discussion
FT-IR and Raman characterization of the as-synthesized sample
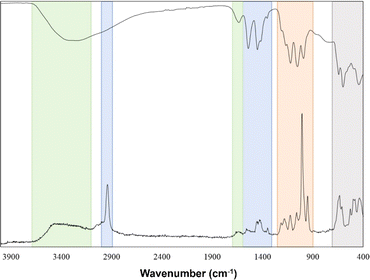
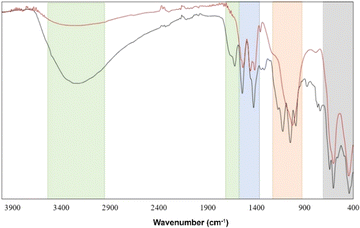
FT-IR and Raman analyses of the [Zr6O4(OH)4(OH2)8(CH3COO)4(SO4)4]·nH2O cluster were performed to identify both the Zn–O and ligands vibrations, dividing these into four zones. The first zone corresponds to OH symmetric stretching and bending vibrations. The former is centered at 3040–3653 cm−1, and the latter can be noticed by a low-intensity shoulder around 1630 cm−1 in both FT-IR and Raman spectra. These peaks correspond to the contributions of coordinated H2O and μ3-OH groups and the vibrations of H2O molecules present in the supramolecular arrangement as solvates.7,21 The acetate vibrations constitute zone 2 (Fig. 1) in FT-IR spectra, where two sharp absorption bands at 1450 cm−1 and 1540 cm−1 were assigned to symmetric and antisymmetric stretch of carbonyl groups in the cluster structure. Since the difference between these two bands is around ≈90 cm−1, it can be suggested that the acetate behaves as a bidentate ligand.22Moreover, in the Raman spectrum, an additional band at 2940 cm−1 was assigned to the C–H stretching vibration of –CH3 in the acetate group.7 Sulfate ion vibrations compose the third zone, where the most notable band in the Raman spectrum at 1010 cm−1 is attributable to the symmetrical vibration of the SO42− group. Furthermore, three bands in IR spectra at 1120, 1050, and 990 cm−1 are also assigned to antisymmetric and symmetrical vibrations.23 Finally, the last zone corresponds to Zr–O vibrations, which can be seen at 597 cm−1 and 440 cm−1; mainly, these vibrations can be attributable to the stretching modes of Zr–O(H)–Zr and Zr–O–Zr.24
Thermal characterization of the as-synthesized sample
TGA and DSC results were used to describe the thermal behavior of [Zr6O4(OH)4(OH2)8(CH3COO)4(SO4)4]·nH2O cluster, and it can be used to estimate its molecular formula indirectly.In the TGA trace (Fig. 2a), the first region corresponds to water evaporation (81.8–151.0 °C), where around 18% of the total weight loss occurs. This result correlates to the DSC curve where an endothermic (15 kJ g−1) peak appears centered at 89.0 °C, which is attributable to water evaporation. From this initial analysis, the estimation of the stoichiometric amount of water molecules in the cluster structure suggests around 17H2O molecules of crystallization. Taking arbitrarily 17 as the n value in the formula, the cluster could be written as [Zr6O4(OH)4(OH2)8(CH3COO)4(SO4)4]·17H2O. After water loss, endothermic peaks in the DSC curve at around 144 °C (227 kJ g−1) and 196 °C (135 kJ g−1) can be assigned to probable atomic/molecular reordering (discoordination of ligands). The second and third decompositions in the TGA curve (412–453 °C) correspond to ≈17% and ≈12% of weight loss, respectively, caused by the acetate groups and μ3-OH moieties (≈17%) and two sulfate groups (≈12%), giving ≈2% and ≈6% as relative errors, respectively. However, another hypothesis seems plausible: a loss of three sulfate groups (≈17%) followed by the loss of all coordinated H2O molecules and hydroxyl groups (≈12%) with relative errors of ≈4% and ≈1%, respectively (calculated % and enthalpy values are shown in Fig. S2 and S3†). To clarify the sub-products of these decompositions, additional analysis is needed, such as TGA/MS (thermogravimetric analysis/mass spectrometry).
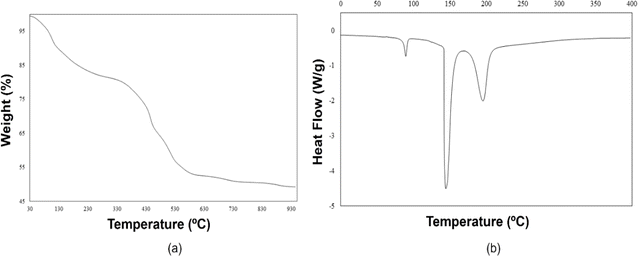 | ||
| Fig. 2 (a) TGA and (b) DSC traces for [Zr6O4(OH)4(OH2)8(CH3COO)4(SO4)4]·17H2O cluster (endo down). Details of the calculations are shown in ESI.† | ||
Crystal structure analysis of as-synthesized sample
Compound [Zr6O4(OH)4(OH2)8(CH3COO)4(SO4)4]·17H2O crystallizes in the Cc space group with unit cell parameters a = 13.9608(13) Å, b = 27.9958(19) Å, c = 14.7493(11) Å, α = 90°, β = 116.436(11)°, and γ = 90°, forming octahedral crystals in the order of ≈0.5 mm (inset in Fig. 3). The search in crystallographic databases shows that the only related compounds found, [Zr6O4(OH)4(OOCR)4(SO4)4(H2O)8]·2HCl·3H2O (R = H, Me, Et) crystallize in the Fdd2, Fddd, and P![[4 with combining macron]](https://www.rsc.org/images/entities/char_0034_0304.gif) c2 space groups, respectively,7 leaving the title compound, [Zr6O4(OH)4(OH2)8(CH3COO)4(SO4)4]·17H2O, as a non-reported supramolecular variation of that reported. Noteworthy, the methodology for the synthesis of the title compound was performed under mild conditions compared to the [Zr6O4(OH)4(OOCR)4(SO4)4(H2O)8]·2HCl·3H2O (R = H, Me, Et) family, where sulfuric acid and hydrothermal treatments were employed.
c2 space groups, respectively,7 leaving the title compound, [Zr6O4(OH)4(OH2)8(CH3COO)4(SO4)4]·17H2O, as a non-reported supramolecular variation of that reported. Noteworthy, the methodology for the synthesis of the title compound was performed under mild conditions compared to the [Zr6O4(OH)4(OOCR)4(SO4)4(H2O)8]·2HCl·3H2O (R = H, Me, Et) family, where sulfuric acid and hydrothermal treatments were employed.
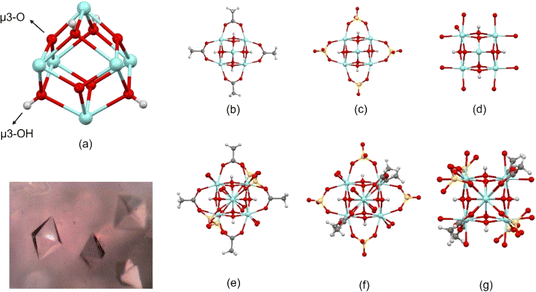 | ||
| Fig. 3 Metal cluster showing (a) Zr-octahedron capped by μ3-O and μ3-OH groups, (b)–(d) coordination of carboxylate, sulfate, and H2O ligands to Zr atoms (hydrogen of water ligands are omitted), respectively, (additional ligands are omitted for clarity), and (e)–(g) whole molecule in different orientations to highlight the coordination of carboxylate, sulfate and H2O ligands to Zr atoms. The inset shows a photograph with the octahedral crystals. Fig. S1† shows ADPs using ORTEP style. | ||
Considering the results and the different synthesis conditions used, as well as the reports in the literature, this unreported supramolecular variation is possible thanks to the esterification of phenolic acids in the presence of acetic acid and a strong acid catalyst,25 such as zirconium sulfate.26,27 This is because in the presence of GA a greater amount of solid cluster (Zr/formate/sulfate) is obtained compared to PCA; indicating that the amount of OH groups present in the respective phenolic acid would be related to the yield of the cluster. Concerning the mild synthesis conditions used, it should be noted that the previously reported structure starts from zirconium chloride, which, in the presence of sulfuric acid and monocarboxylic acids, forms a stable cluster (in hydrothermal synthesis conditions), which is subsequently used as a precursor of nano ZrO2 structures. Taking into account the report by Stern et al., where it is thermodynamically demonstrated that the hexanuclear Zr6 clusters are less stable in water, requiring ligand support for stabilization (unlike the tetranuclear Zr4 clusters),28 as well as the report by Zhang et al. where the effect of sulfate anions on the crystallization of Zr oxo clusters was studied,29 the structure obtained in the present investigation was obtained under mild synthesis conditions thanks to the stabilization of sulfate and formate anions to the Zr6 cluster. The sulfate anions were provided by the metal salt (zirconium sulfate), and the esterification of the phenolic acids present in the reaction medium provided the formate anions.
Additionally, in the [Zr6O4(OH)4(OH2)8(CH3COO)4(SO4)4]·17H2O cluster, the 6 Zr atoms describe an octahedron alternatively capped by μ3-O (planar) and μ3-OH (pyramidal) groups (Fig. 3a), where a C2 point group described the molecular symmetry. The coordination geometry of Zr atoms is completed through eight oxygens to form an antiprismatic geometry. This coordination is constructed by different groups in each case. Two Zr atoms are coordinated by two carboxylate ligands, 2μ3-O, 2μ3-OH groups, and 2H2O molecules (polyhedral volumes: 18.699 and 19.013 A3). Alternatively, two Zr atoms are coordinated by 2 carboxylate ligands, 2μ3-O, 2μ3-OH groups, and 2 sulfate ligands (polyhedral volumes: 18.660 and 18.776 Å3). Thus, two Zr atoms are coordinated by two sulfate ligands, 2μ3-O, 2μ3-OH groups, and 2H2O molecules (polyhedral volumes: 18.986 and 19.164 Å3) (Fig. 3b–g).
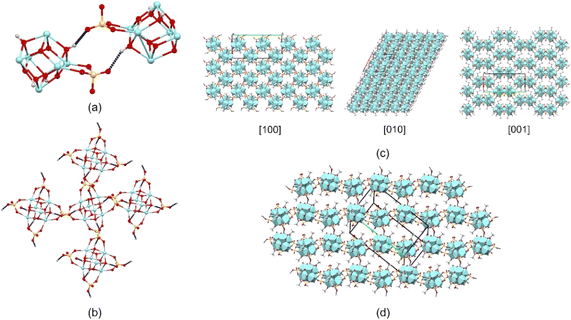
Furthermore, the acidity of the μ3-OH groups is essential in connecting neighboring molecules in the supramolecular structure.1 O–H⋯O hydrogen bonds involving the four μ3-O-H groups (H donor) and the sulfate ligands of a neighboring molecule (H acceptor) are the most significant interactions in the crystal structure (Fig. 4a and b, Table 2). The molecular assembly through these interactions builds a three-dimensional framework that, interestingly, resembles the structure of a metal–organic framework (Fig. 4c and d).
| Compound 3a | |||||
|---|---|---|---|---|---|
| D–H⋯A | D–H | H⋯A | D⋯A | D–H⋯A | Symmetry code |
| O4–H4⋯O22 | 0.82 | 1.98 | 2.779(17) | 166 | −1/2 + x, 3/2 − y, −1/2 + z |
| O8–H8⋯O34 | 0.82 | 2.20 | 2.95(2) | 152 | x, 1 − y, 1/2 + z |
| O12–H12⋯O45 | 0.82 | 1.98 | 2.785(16) | 167 | 1/2 + x, 3/2 − y, 1/2 + z |
| O13–H13⋯O29 | 0.82 | 2.22 | 2.96(3) | 151 | x, 1 − y, −1/2 + z |
Through these short intermolecular bonds (H⋯O distances <2.3 Å), the supramolecular structure is defined by a three-dimensional maze of intersecting tunnels (Fig. 5). H2O molecules occupied these tunnels in the room temperature structure, which is corroborated in the FT-IR/Raman spectra (Fig. 1). These solvent molecules interact through additional O–H⋯O bonds with the Zr-coordinated H2O molecules and sulfate ligands, stabilizing the framework and maintaining the integrity of the tunnels. Nevertheless, due to difficulties in the refinement process related to these disordered H2O molecules, the final crystal structure was refined in a model where the PLATON/SQUEEZE tool was applied.30 Therefore, the position of the hydrogens in the final Zr-coordinated H2O molecules rise A/B-warnings in the checkcif due to possible misplacement due to the lack of solvent in the final refined model. Then, to approach the volume occupied by the solvent, calculations were performed based on the procrystal electron density using the CrystalExplorer software.17–19 Consequently, the results show that the calculated surface contact volume available to the solvent molecules is 1876.8 Å3, a value in accordance with the previous calculated using PLATON software,31 corresponding to ≈36% of the total unit cell volume.
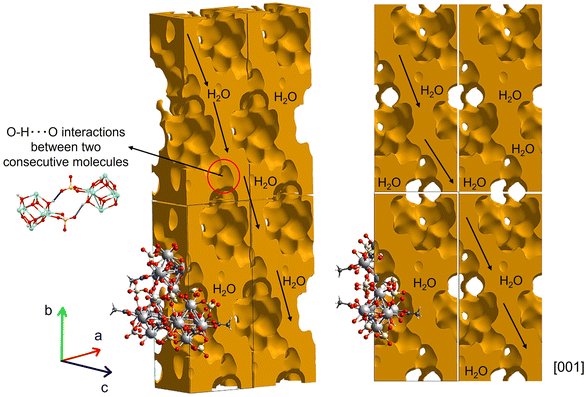 | ||
| Fig. 5 Visualization of the 0.002 a.u. void surface calculated using CrystalExplorer showing the tunnels where solvent H2O molecules stabilize the framework. | ||
This calculation suggests that approximately 13H2O molecules (included in the submitted CIF file to the CCDC and registered in Table 1) are present per formula unit, which is not too far from the 17H2O molecules calculated in the TGA analysis, considering the two different approaches (Fig. 5).
In summary, the crystal structure of the title compound is then formed by strong O–H⋯O hydrogen bonds involving the μ3-O-H and SO42− groups, which is complemented by weaker O–H⋯O hydrogen bonds where solvent H2O molecules stabilize the framework by interactions with the Zr-coordinated H2O and SO2− groups. CrystalExplorer Hartree–Fock level of theory; CE-HF energy models using HF/3-21G electron densities were used as an approximation to estimate the pairwise interaction energies and obtain insights about the forces acting in the framework's formation.17,18 From these calculations; we conclude that two consecutive molecules connected by strong O–H⋯O hydrogen bonds have a total pairwise interaction energy of approximately −315.2 kJ mol−1, with electrostatic, polarization, dispersion, and repulsive energies of −250.9, −119.0, −61.3, and 90.2 kJ mol−1, respectively. From this result, it is possible to infer that the molecular framework is mainly built by electrostatic forces, as shown in Fig. 6, where the energy frameworks observed along [001] and [100] directions show the formation of the tunnels.
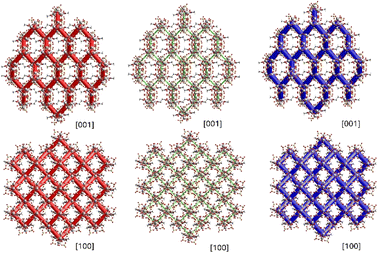 | ||
| Fig. 6 Energy framework diagrams for electrostatic (red) and dispersion (green) contributions to the total interaction energies (blue) observed along [001] and [100] directions. | ||
Thermal stability of the framework
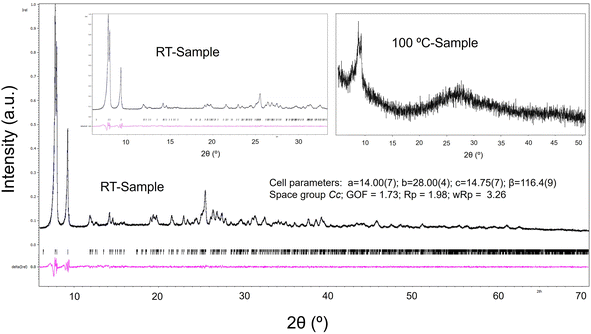
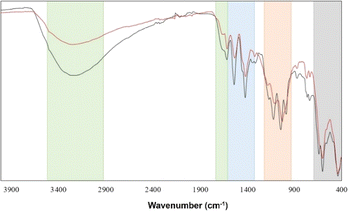
Considering the great potential that this sort of structure has in the field of catalysis and absorption of small molecules,32 a thermal treatment was carried out to obtain information about the stability of the framework when the H2O solvent molecules are lost. In this procedure, a powder sample was used, and the purity of the bulk was confirmed by Le Bail fit using the Jana software (Fig. 7).20,33To clarify the fundamental role of H2O molecules in the supramolecular arrangement, FT-IR spectra of the sample at room temperature and treated at 100 °C were measured. Fig. 8 shows that the characteristic vibrations grouped in the four regions depicted in Fig. 1 are maintained with slight differences. There is mainly an intensity decrease in the OH-group vibration bands after thermal treatment at 100 °C due to the elimination of the H2O molecules present in the tunnels, which correlates with the TGA first weight loss.
In general, all the identified bands of the untreated sample are also visible in the sample treated at 100 °C, which suggests a conservation of the molecular integrity. However, the powder X-ray diffraction pattern (Fig. 7) of the sample treated at 100 °C indicates a loss of the original molecular periodicity. These results can be interpreted as follows: the molecular cluster is maintained after eliminating the free solvent H2O molecules in the tunnels; nevertheless, the hydrogen bond interactions of these H2O molecules with the cluster are important to keep the long-range arrangement.
In addition, we measured the FT-IR spectrum and powder X-ray diffraction pattern (ESI Fig. S4†) of the cluster sample treated at 150 °C, corresponding to the end of the first weight lost in the TGA curve. Fig. 9 shows an intensity decrease of the OH-symmetric stretching band in zone 1 and the absence of H2O bending mode around 1630 cm−1, which suggests a total loss of H2O molecules, most probably from the coordination sphere of the Zr metals. However, a main change can be observed in the sulfate zone (red region), where the three characteristic modes of SO42− vibrations transform to a broad band, which could be associated with a discoordination of these groups from the Zr atoms, leading to a decomposition of the cluster. X-ray diffractogram (ESI†) supports this hypothesis, suggesting the probable formation of Zr(CH3COO)4 and Zr3O5(SO4) according to the ICSD database. These findings favor the second thermal decomposition mechanism proposed previously, where, after the elimination of the crystallization H2O molecules, a loss of three sulfate groups (≈17%) followed by the loss of all hydroxide groups and coordinated H2O molecules (≈12%) takes place.
Conclusions
In summary, we have synthesized a new crystal structure of a cluster with Zr6O8 core and formula unit [Zr6O4(OH)4(OH2)8(CH3COO)4(SO4)4]·17H2O, where the number of solvent water molecules was calculated from TGA, being this number 13 from X-ray data. As a difference to the previously reported [Zr6O4(OH)4(OOCR)4(SO4)4(H2O)8]·2HCl·3H2O (R = H, Me, Et) family where sulfuric acid and hydrothermal treatments were employed, this work reports a mild synthesis procedure using gallic and protocatechuic acids in ethanol, acetic acid and Zr(SO4)2·4H2O at ambient conditions. The crystal structure of the cluster is characterized by a framework built by strong O–H⋯O hydrogen bonds, allowing the formation of a three-dimensional maze of tunnels with H2O molecules occupying the volume, structure firmly maintained by the crystallization solvent. Interestingly, at 100 °C, the water molecules start to evaporate, and the strong Zr6O8 core accompanied by the intermolecular O–H⋯O hydrogen bonds allows the formation of a new system where the molecular cluster is conserved, but the long-range order is lost.Author contributions
The manuscript was written with contributions from all authors, and all authors have approved the final version. AYGS: investigation, formal analysis, methodology. JDL: investigation, formal analysis, methodology. JDP: investigation, formal analysis, methodology. CAS: investigation, formal analysis, methodology, conceptualization. MAM: investigation, formal analysis, methodology, conceptualization, writing – original draft.Conflicts of interest
There are no conflicts to declare.Acknowledgements
The authors thank the Departamento de Química of the Universidad de los Andes, Colombia, for financial support. M. A. M. acknowledges support from the Facultad de Ciencias at the Universidad de los Andes, Colombia (project number INV-2023-176-2938).References
- U. Schubert, Coord. Chem. Rev., 2022, 469, 214686 CrossRef CAS.
- C. Hennig, S. Weiss, W. Kraus, J. Kretzschmar and A. C. Scheinost, Inorg. Chem., 2017, 56, 2473–2480 CrossRef CAS PubMed.
- L. M. Mokry, N. S. Dean and C. J. Carrano, Angew. Chem., Int. Ed. Engl., 1996, 35, 1497–1498 CrossRef CAS.
- P. Piszczek, A. Radtke, A. Grodzicki, A. Wojtczak and J. Chojnacki, Polyhedron, 2007, 26, 679–685 CrossRef CAS.
- M. Puchberger, F. R. Kogler, M. Jupa, S. Gross, H. Fric, G. Kickelbick and U. Schubert, Eur. J. Inorg. Chem., 2006, 2006(16), 3283–3293 CrossRef.
- J. Kreutzer, M. Czakler, M. Puchberger, E. Pittenauer and U. Schubert, Eur. J. Inorg. Chem., 2015, 2015(17), 2889–2894 CrossRef CAS PubMed.
- Q. Sun, C. Liu, G. Zhang, J. Zhang, C.-H. Tung and Y. Wang, Chemistry, 2018, 24, 14701–14706 CrossRef CAS PubMed.
- Y. Wen, P. Zhang, V. K. Sharma, X. Ma and H.-C. Zhou, Metal-organic frameworks for environmental applications, Cell Rep. Phys. Sci., 2021, 2(2), 1–17 Search PubMed.
- G. Zahn, P. Zerner, J. Lippke, F. L. Kempf, S. Lilienthal, C. A. Schröder, A. M. Schneider and P. Behrens, CrystEngComm, 2014, 16, 9198–9207 RSC.
- R. S. Forgan, Chem. Sci., 2020, 11, 4546–4562 RSC.
- G. Zahn, H. A. Schulze, J. Lippke, S. König, U. Sazama, M. Fröba and P. Behrens, Microporous Mesoporous Mater., 2015, 203, 186–194 CrossRef CAS.
- Y. Bai, Y. Dou, L.-H. Xie, W. Rutledge, J.-R. Li and H.-C. Zhou, Chem. Soc. Rev., 2016, 45, 2327–2367 RSC.
- Rigaku, CrysAlisPro 1.171.39.46e, Rigaku Oxford Diffraction, 2018 Search PubMed.
- L. Palatinus and G. Chapuis, J. Appl. Cryst., 2007, 40, 786–790 CrossRef CAS.
- G. M. Sheldrick, Acta Cryst. C, 2015, 71, 3–8 CrossRef PubMed.
- C. F. Macrae, I. J. Bruno, J. A. Chisholm, P. R. Edgington, P. McCabe, E. Pidcock, L. Rodriguez-Monge, R. Taylor, J. van de Streek and P. A. Wood, J. Appl. Cryst., 2008, 41, 466–470 CrossRef CAS.
- P. R. Spackman, M. J. Turner, J. J. McKinnon, S. K. Wolff, D. J. Grimwood, D. Jayatilaka and M. A. Spackman, J. Appl. Cryst., 2021, 54, 1006–1011 CrossRef CAS PubMed.
- C. F. Mackenzie, P. R. Spackman, D. Jayatilaka and M. A. Spackman, IUCrJ, 2017, 4, 575–587 CrossRef CAS PubMed.
- M. J. Turner, J. J. McKinnon, D. Jayatilaka and M. A. Spackman, CrystEngComm, 2011, 13, 1804–1813 RSC.
- V. Petříček, M. Dušek and L. Palatinus, Z. Kristallogr. Cryst. Mater., 2014, 229, 345–352 CrossRef.
- Y. Tominaga, A. Fujiwara and Y. Amo, Fluid Phase Equilib., 1998, 144, 323–330 CrossRef CAS.
- A. M. Al-Sabagh, F. Z. Yehia, A. M. F. Eissa, M. E. Moustafa, Gh. Eshaq, A. M. Rabie and A. E. ElMetwally, Polym. Degrad. Stab., 2014, 110, 364–377 CrossRef CAS.
- K. Ben Mabrouk, T. H. Kauffmann, H. Aroui and M. D. Fontana, J. Raman Spectrosc., 2013, 44, 1603–1608 CrossRef CAS.
- I. Iordanov, V. Bermudez and C. Knox, J. Phys. Chem. C, 2018, 122, 5385–5400 CrossRef CAS.
- L. Krbechek, US Pat., 5808130, 1998 Search PubMed.
- D. Xu, H. Ma and F. Cheng, Mater. Res. Bull., 2014, 53, 15–20 CrossRef CAS.
- M. L. Testa, V. La Parola, F. Mesrar, F. Ouanji, M. Kacimi, M. Ziyad and L. F. Liotta, Catalysis, 2019, 9, 148 Search PubMed.
- R. D. Stern, R. S. Kingsbury and K. A. Persson, Inorg. Chem., 2021, 60, 15456–15466 CrossRef CAS PubMed.
- Y. Zhang, F. de Azambuja and T. N. Parac-Vogt, Coord. Chem. Rev., 2021, 138, 213886 CrossRef.
- A. L. Spek, Acta Cryst. C, 2015, 71, 9–18 CrossRef CAS PubMed.
- A. L. Spek, Acta Cryst. D, 2009, 65, 148–155 CrossRef CAS PubMed.
- D. Yang, M. A. Ortuño, V. Bernales, C. J. Cramer, L. Gagliardi and B. C. Gates, J. Am. Chem. Soc., 2018, 140, 3751–3759 CrossRef CAS PubMed.
- A. Le Bail, H. Duroy and J. L. Fourquet, Mater. Res. Bull., 1988, 23, 447–452 CrossRef CAS.
Footnote |
| † Electronic supplementary information (ESI) available. CCDC 2354420. For ESI and crystallographic data in CIF or other electronic format see DOI: https://doi.org/10.1039/d4ra03940h |
| This journal is © The Royal Society of Chemistry 2024 |

