 Open Access Article
New synthetic chitosan Schiff bases bearing pyranoquinolinone or benzonaphthyridine and their silver nanoparticles derivatives with potential activity as antioxidant and molecular docking study for EGFR inhibitors†
Shrouk M. Hassan,
Jehan M. Morsy,
Hany M. Hassanin,
Elham S. Othman and
Mai A. Mostafa *
*
Department of Chemistry, Faculty of Education, Ain Shams University Roxy, 11711 Cairo, Egypt. E-mail: maiabdellatef@edu.asu.edu.eg
First published on 20th September 2024
Abstract
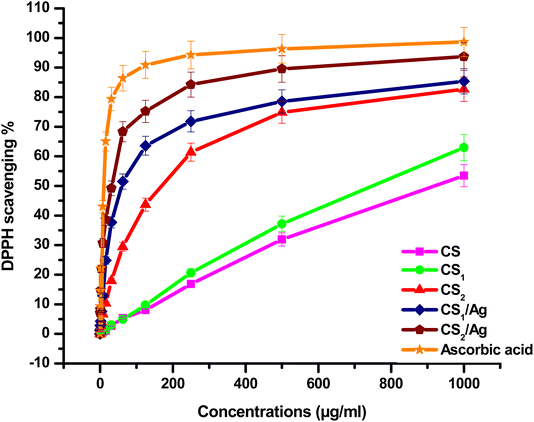
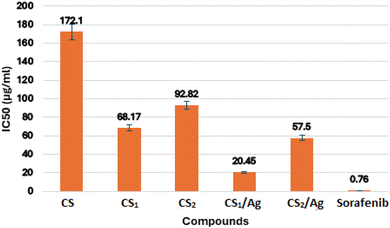
In this study, two new carboxaldehydes 3, and 4 were synthesized by Vilsmeier–Haack formylation of 6-butyl-benzo[h][1,6]naphthyridine-2,5-dione 2 and 6-butyl-pyrano[3,2-c]quinolinone 1, respectively. Structures of newly synthesized compounds were achieved by IR, 1H NMR, 13C NMR, mass techniques, and elemental analyses. The two synthesized carboxaldehydes 3 and 4 were used as precursors for the synthesis of two new chitosan-based Schiff bases, CS1 and CS2. The new chitosan Schiff bases were grafted on silver nanoparticles, providing CS1/Ag and CS2/Ag structures. However, CS1 and CS2 and their silver nanoparticles were characterized by FT-IR, XRD, SEM-EDX, XRF, TEM, TGA, and DSC. The target compounds CS1, CS2, CS1/Ag, and CS2/Ag were assessed as radical scavengers against 1,1-diphenyl-2-picrylhydrazyl radicals (DPPH%). The results showed that CS1 and CS2 had a better ability to scavenge DPPH radical than its unmodified chitosan. CS1/Ag and CS2/Ag, combining the unique properties of silver and Schiff bases, displayed excellent antioxidant activity (IC50, 59.13, and 32.54 μg mL−1, respectively). In addition, the previous compounds were tested in vitro for inhibition of epidermal growth factor receptor (EGFR) tyrosine kinase using the EGFR kinase assay kit (Cat. #40321). In particular, compound CS1/Ag displayed potent inhibitory activity towards EGFR with IC50 20.45 μg mL−1 compared to reference drug sorafenib (IC50 = 0.76 μg mL−1). The bioactivity of new chitosan Schiff bases was studied by molecular docking to see how they bind with the EGFR receptor. The results implied that CS1 has a higher binding energy than CS2 and CS regarding EGFR kinase, which agreed with the results obtained from the experimental EGFR inhibition assay.
1 Introduction
Chitosan, as a second biopolymer in nature, has a linear structure consisting of [β-(1,4)-2-amino-doxy-D-glucopyranose], which is derived from the N-deacetylation of chitin.1,2 Chitosan is an important polymer with a wide range of functionalities because it is biodegradable, non-toxic, and biocompatible.3–5 The abundant supply of chitosan, the presence of reactive hydroxyl and amino sets, and the variety of modifications successfully made chitosan a viable candidate in a diversity of applications, such as biomaterials for tissue engineering, drug delivery applications,6 and agriculture.7 Besides, chitosan derivatives have exposed antioxidant,8 anticancer activities with less toxicity on no tumor cells,9,10 and epidermal growth factor receptor (EGFR) inhibitory activity.11Among the different chemical modifications of chitosan (CS) is the reaction of aldehydes and ketones with their amino groups, established as the Schiff base modification.12–14 Numerous derivatives of CS Schiff bases have various biomedical activities, including an antitumor and antioxidant.15,16 It was found that some chitosan Schiff bases exhibited inhibitory activities towards (acetylcholinesterase (AchE), butyrylcholinesterase (BchE), glutamine synthetase (GSI), and sphingomyelinase (SMASE)).17,18
Besides, the azo aromatics have revealed great biological and therapeutic activities. Therefore, naphthyridines were estimated as HIV-1 integrase inhibitors, fibroblast growth factor receptor (FGFR) tyrosine kinase, human cytomegalovirus (HCMV), and enzyme acetylcholinesterase.19–27 Furthermore, benzo[h][1,6]naphthyridine demonstrates high affinity. 5-Hydroxytryptamine receptor 4 (5-HT4) ligands and acts as protein kinase CK2 inhibitors for curing cancer, mammalian target of rapamycin (mTOR), and 3-phosphoinositide-dependent protein kinase-1 inhibitors (PDK1).28 As well, it shows anticancer activity against several cell lines, including human alveolar basal epithelial cells (A-549), colon adenocarcinoma (HCT-15), breast cancer cell line (T-47D), and human liver cancer cell line (HepG-2).28,29
In the current medical era, pyrano[3,2-c]quinolinones emerged as a promising privileged moiety in biological and therapeutic activities. Pyranoquinolinones are known for their great cytotoxic ability toward several cell lines (HepG-2, A-549, MCF-7).30–32 Interestingly, pyranoquinolinone derivatives possess high antioxidant activity.33,34 It is an important motif found in plenty of alkaloids having pharmaceutical applications.35 For example, huajiaosimuline and zanthosimuline have inhibitor activity towards multidrug-resistant KB-VI tumor cells.36 Also, pyranoquinolinone derivatives have emerged as notable topoisomerase IIB inhibitors.37,38
We therefore aimed to enhance the overall biological potency of chitosan via its condensation reactions with novel carboxaldehydes, 6-butyl-benzo[h][1,6]naphthyridine-3-carbaldehyde 3, and 6-butyl-pyrano[3,2-c]quinoline-3-carbaldehyde 4. In addition, we have incorporated silver nanoparticles into the synthesized Schiff bases, hoping that the formed compounds will be eco-friendly favorable pharmacological candidates and discover new anticancer and antioxidant drugs. Recently, well-known silver nanoparticles have gained much concern in the nanomedicine field. Also, silver nanoparticles display efficient inhibitory activities of cancer cells, inhibition of angiogenesis, and antioxidants.39,40 Modern studies exhibit the ability of silver nanoparticles (Ag NPs) to induce cytotoxicity in tumor cells by various methods such as DNA damage, oxidative stress, apoptosis, or cell cycle arrest.41 Remarkably, chitosan Schiff base loaded with Ag NPs exposes antimicrobial, and anticancer activity.42–44 Hence, we hypothesized that incorporating silver nanoparticles into the newly synthesized Schiff bases might significantly increase their biological activities.
The new synthesized chitosan Schiff base derivatives were characterized using different analytical methodologies, including Fourier transform infrared (FTIR), X-ray diffraction (XRD), scanning electron microscope (SEM), energy-dispersive X-ray spectroscopy (EDX), X-ray fluorescence (XRF), transmission electron microscopy (TEM), thermogravimetric analyzer (TGA) and differential scanning calorimetric analyses (DSC). As a result of the previous studies, which showed the activity of chitosan derivatives, pyranoquinolines, and benzonaphthyridines as antioxidants and enzyme inhibitors for cancer therapy, we chose to investigate antioxidant efficiencies on DPPH of the synthesized chitosan Schiff bases. As well, these compounds were assayed for their potential inhibitory activity towards the epidermal growth factor receptor (EGFR). The molecular docking study of the new compounds was carried out.
2 Materials and methods
2.1 . Materials
Chitosan (CS) low molecular weight (50![[thin space (1/6-em)]](https://www.rsc.org/images/entities/char_2009.gif) 000–190
000–190![[thin space (1/6-em)]](https://www.rsc.org/images/entities/char_2009.gif) 000 Da, 75% deacetylated) (Iceland), DMF, and phosphorus oxychloride were purchased from Sigma-Aldrich. Silver nitrate and ammonium acetate were provided by Merck. Sodium citrate, sodium carbonate, glacial acetic acid, methanol, and ethanol were purchased by a local company (Pio Chem., Cairo, Egypt).
000 Da, 75% deacetylated) (Iceland), DMF, and phosphorus oxychloride were purchased from Sigma-Aldrich. Silver nitrate and ammonium acetate were provided by Merck. Sodium citrate, sodium carbonate, glacial acetic acid, methanol, and ethanol were purchased by a local company (Pio Chem., Cairo, Egypt).
2.2. Synthetic procedure
![[double bond, length as m-dash]](https://www.rsc.org/images/entities/char_e001.gif) Oα-pyridone), 1683 (C
Oα-pyridone), 1683 (C![[double bond, length as m-dash]](https://www.rsc.org/images/entities/char_e001.gif) Oγ-pyridone), and 1639 (C
Oγ-pyridone), and 1639 (C![[double bond, length as m-dash]](https://www.rsc.org/images/entities/char_e001.gif) Oquinolinone), 1613 (C
Oquinolinone), 1613 (C![[double bond, length as m-dash]](https://www.rsc.org/images/entities/char_e001.gif) Caromatic). 1H NMR (500 MHz, DMSO-d6) δH: 0.89 (t, J = 7.15 Hz, 3H, CH3butyl), 1.34–1.38 (m, 2H, CH2butyl), 1.53–1.55 (m, 2H, CH2butyl), 4.17 (t, J = 7.15 Hz, 2H, NCH2butyl), 5.06 (s, 1H, C3–H), 7.32 (t, J = 7.15 Hz, 1H, Ar–H), 7.58 (d, J = 8.5 Hz, 1H, Ar–H), 7.72 (t, J = 7.6 Hz, 1H, Ar–H), 7.81 (s, 1H, NH), 7.99 (d, J = 8.0 Hz, 1H, Ar–H), 8.61 (s, 1H, OH). 13C NMR (125 MHz, DMSO-d6) δC: 14.2 (s, C4′), 20.1 (s, C3′), 29.7 (s, C2′), 40.3 (C1′), 82.0, 100.1, 115.8, 115.9, 123.5, 123.9, 124.3, 134.2, 138.8, 158.7, 158.8, 160.1. Mass spectrum, m/z (Ir %): 285.11 [M+ + 1; 33], 284.18 [M+; 100], 256.05 [M+–CO; 44], 214.10 (33), 199.66 (95), 145.09 (62), 131.62 (35). Analysis calculated for C16H16N2O3 (284.1): C, 67.59; H, 5.67; N, 9.85%. Found: C, 67.55; H, 5.71; N, 9.83%.
Caromatic). 1H NMR (500 MHz, DMSO-d6) δH: 0.89 (t, J = 7.15 Hz, 3H, CH3butyl), 1.34–1.38 (m, 2H, CH2butyl), 1.53–1.55 (m, 2H, CH2butyl), 4.17 (t, J = 7.15 Hz, 2H, NCH2butyl), 5.06 (s, 1H, C3–H), 7.32 (t, J = 7.15 Hz, 1H, Ar–H), 7.58 (d, J = 8.5 Hz, 1H, Ar–H), 7.72 (t, J = 7.6 Hz, 1H, Ar–H), 7.81 (s, 1H, NH), 7.99 (d, J = 8.0 Hz, 1H, Ar–H), 8.61 (s, 1H, OH). 13C NMR (125 MHz, DMSO-d6) δC: 14.2 (s, C4′), 20.1 (s, C3′), 29.7 (s, C2′), 40.3 (C1′), 82.0, 100.1, 115.8, 115.9, 123.5, 123.9, 124.3, 134.2, 138.8, 158.7, 158.8, 160.1. Mass spectrum, m/z (Ir %): 285.11 [M+ + 1; 33], 284.18 [M+; 100], 256.05 [M+–CO; 44], 214.10 (33), 199.66 (95), 145.09 (62), 131.62 (35). Analysis calculated for C16H16N2O3 (284.1): C, 67.59; H, 5.67; N, 9.85%. Found: C, 67.55; H, 5.71; N, 9.83%.![[double bond, length as m-dash]](https://www.rsc.org/images/entities/char_e001.gif) Oald.), 1724 (C
Oald.), 1724 (C![[double bond, length as m-dash]](https://www.rsc.org/images/entities/char_e001.gif) Oα-pyridone), 1670 (C
Oα-pyridone), 1670 (C![[double bond, length as m-dash]](https://www.rsc.org/images/entities/char_e001.gif) Oquinolinone), and 1621 (C
Oquinolinone), and 1621 (C![[double bond, length as m-dash]](https://www.rsc.org/images/entities/char_e001.gif) Caromatic). 1H NMR (500 MHz, DMSO-d6) δH: 0.96 (t, J = 8.0 Hz, 3H, CH3butyl), 1.40–1.45 (m, 2H, CH2butyl), 1.59–1.64 (m, 2H, CH2butyl), 4.32 (t, J = 8.0 Hz, 2H, NCH2butyl), 7.49 (t, J = 8.0 Hz, 1H, Ar–H), 7.76 (d, J = 8.0 Hz, 1H, Ar–H), 7.91 (t, J = 8.0 Hz, 1H, Ar–H), 8.16 (d, J = 8.0 Hz, 1H, Ar–H), 9.93 (s, 1H, HC
Caromatic). 1H NMR (500 MHz, DMSO-d6) δH: 0.96 (t, J = 8.0 Hz, 3H, CH3butyl), 1.40–1.45 (m, 2H, CH2butyl), 1.59–1.64 (m, 2H, CH2butyl), 4.32 (t, J = 8.0 Hz, 2H, NCH2butyl), 7.49 (t, J = 8.0 Hz, 1H, Ar–H), 7.76 (d, J = 8.0 Hz, 1H, Ar–H), 7.91 (t, J = 8.0 Hz, 1H, Ar–H), 8.16 (d, J = 8.0 Hz, 1H, Ar–H), 9.93 (s, 1H, HC![[double bond, length as m-dash]](https://www.rsc.org/images/entities/char_e001.gif) O), 10.35 (s, 2H, OH + NH, exchangeable in D2O). 13C NMR (101 MHz, DMSO-d6) δC: 14.1 (s, C4′), 20.0 (s, C3′), 29.6 (s, C2′), 42.1 (C1′), 94.2, 98.8, 112.9, 116.1, 123.9, 124.9, 135.6, 139.6, 159.6, 160.8, 160.9, 161.5, 189.9 (C
O), 10.35 (s, 2H, OH + NH, exchangeable in D2O). 13C NMR (101 MHz, DMSO-d6) δC: 14.1 (s, C4′), 20.0 (s, C3′), 29.6 (s, C2′), 42.1 (C1′), 94.2, 98.8, 112.9, 116.1, 123.9, 124.9, 135.6, 139.6, 159.6, 160.8, 160.9, 161.5, 189.9 (C![[double bond, length as m-dash]](https://www.rsc.org/images/entities/char_e001.gif) Oald.). Mass spectrum, m/z (Ir %): 312.29 [M+; 11.83], 283.83 [M+–CO; 100], 226.82 (42), 199.40 (77), 184.96 (27), 145.10 (36). Analysis calculated for C17H16N2O4 (312.33): C, 65.38; H, 5.16; N, 8.97%. Found: C, 65.28; H, 5.26; N, 8.90%.
Oald.). Mass spectrum, m/z (Ir %): 312.29 [M+; 11.83], 283.83 [M+–CO; 100], 226.82 (42), 199.40 (77), 184.96 (27), 145.10 (36). Analysis calculated for C17H16N2O4 (312.33): C, 65.38; H, 5.16; N, 8.97%. Found: C, 65.28; H, 5.26; N, 8.90%.![[double bond, length as m-dash]](https://www.rsc.org/images/entities/char_e001.gif) Oα-pyrone), 1730 (C
Oα-pyrone), 1730 (C![[double bond, length as m-dash]](https://www.rsc.org/images/entities/char_e001.gif) Oald.), 1659 (C
Oald.), 1659 (C![[double bond, length as m-dash]](https://www.rsc.org/images/entities/char_e001.gif) Oquinolinone), 1613 (C
Oquinolinone), 1613 (C![[double bond, length as m-dash]](https://www.rsc.org/images/entities/char_e001.gif) Caromatic). 1H NMR (500 MHz, DMSO-d6) δH: 0.93 (t, J = 10.0 Hz, 3H, CH3butyl), 1.38–1.45 (m, 2H, CH2butyl), 1.59–1.64 (m, 2H, CH2butyl), 4.30 (t, J = 10.0 Hz, 2H, NCH2butyl), 7.52 (t, J = 10.0 Hz, 1H, C9–H), 7.83–7.93 (m, 2H, C7–H + C8–H), 8.10 (d, J = 10.0 Hz, 1H, C10–H), 9.99 (s, 1H, HC
Caromatic). 1H NMR (500 MHz, DMSO-d6) δH: 0.93 (t, J = 10.0 Hz, 3H, CH3butyl), 1.38–1.45 (m, 2H, CH2butyl), 1.59–1.64 (m, 2H, CH2butyl), 4.30 (t, J = 10.0 Hz, 2H, NCH2butyl), 7.52 (t, J = 10.0 Hz, 1H, C9–H), 7.83–7.93 (m, 2H, C7–H + C8–H), 8.10 (d, J = 10.0 Hz, 1H, C10–H), 9.99 (s, 1H, HC![[double bond, length as m-dash]](https://www.rsc.org/images/entities/char_e001.gif) O). 13C NMR (125 MHz, DMSO-d6) δC: 13.6 (s, C4′), 19.4 (s, C3′), 29.1 (s, C2′), 41.9 (C1′), 100.5, 112.7, 116.5, 124.4, 124.7, 128.6, 135.9, 138.6, 158.2, 160.9, 162.7, 173.6, 184.7 (CH
O). 13C NMR (125 MHz, DMSO-d6) δC: 13.6 (s, C4′), 19.4 (s, C3′), 29.1 (s, C2′), 41.9 (C1′), 100.5, 112.7, 116.5, 124.4, 124.7, 128.6, 135.9, 138.6, 158.2, 160.9, 162.7, 173.6, 184.7 (CH![[double bond, length as m-dash]](https://www.rsc.org/images/entities/char_e001.gif) O). Mass spectrum, m/z (Ir %): 333.02 [M+ + 2; 14], 331.06 [M+; 45], 303.32 [M+–(HCO + H); 90], 218.38 (40), 131.52 (68). Analysis calculated for C17H14ClNO4 (331.75): C, 61.55; H, 4.25; Cl, 10.69; N, 4.22%. Found: C, 61.47; H, 4.35; Cl, 10.60; N, 4.31%.
O). Mass spectrum, m/z (Ir %): 333.02 [M+ + 2; 14], 331.06 [M+; 45], 303.32 [M+–(HCO + H); 90], 218.38 (40), 131.52 (68). Analysis calculated for C17H14ClNO4 (331.75): C, 61.55; H, 4.25; Cl, 10.69; N, 4.22%. Found: C, 61.47; H, 4.35; Cl, 10.60; N, 4.31%.2.3. Characterization techniques
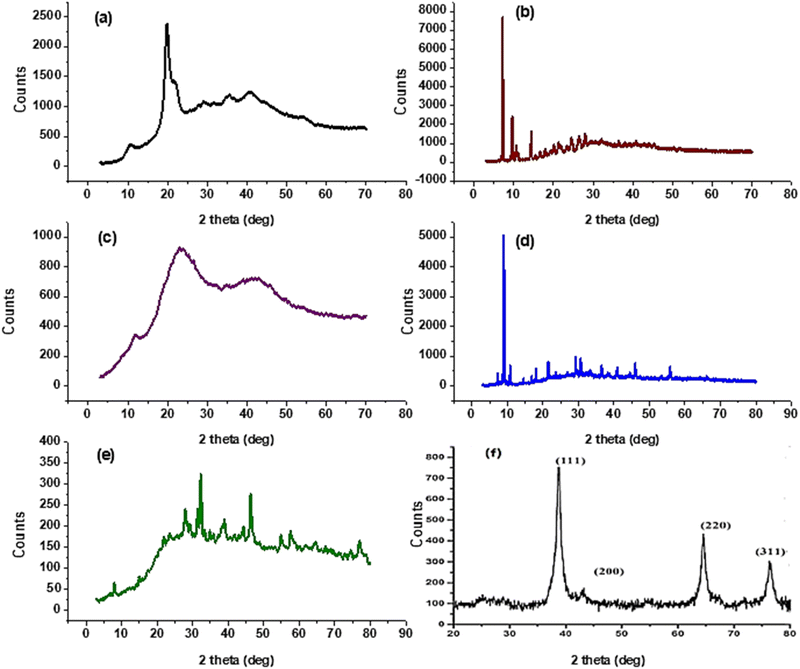
Melting points were assessed by a digital Stuart-SMP3 apparatus. Fourier transform infrared spectra of synthesized compounds were reported on the FT-IR Nicolet IS10 spectrophotometer (cm−1) at the faculty of education, chemistry department, Ain Shams University, using KBr disks, at ranges from 500 to 4000 cm−1. 1H NMR (500 MHz) and 13C NMR (125 MHz) spectra were measured on the Bruker spectrometer (δ) at the National Research Centre using DMSO-d6 as a solvent and tetramethyl silane as an internal standard. A Bruker Axs D8 Advance X-ray diffractometer with CuKα irradiation (λ = 0.145060 nm) was used for XRD data. Whereas the average crystal size (D in nm) of CS1 was calculated using the Debye-Scherrer equation, D = Kλ/β![[thin space (1/6-em)]](https://www.rsc.org/images/entities/char_2009.gif) cos
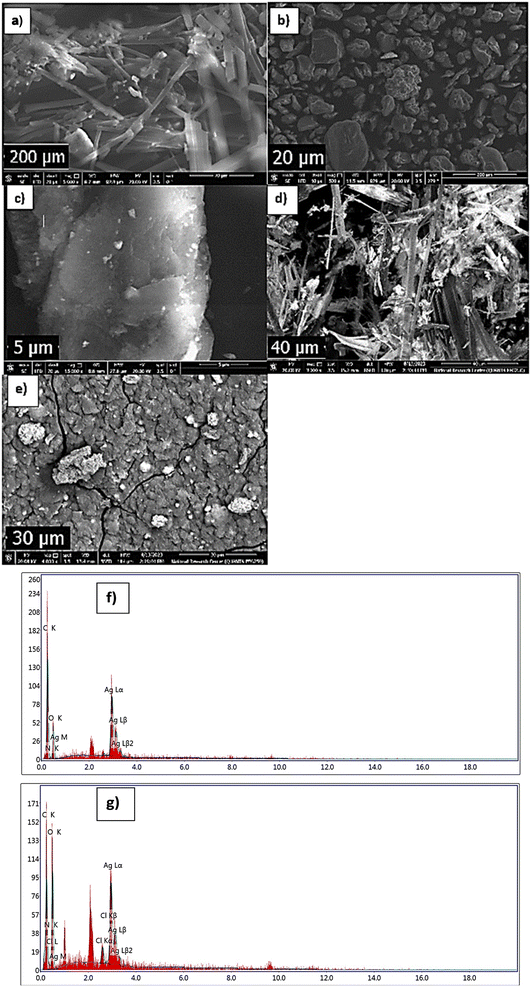
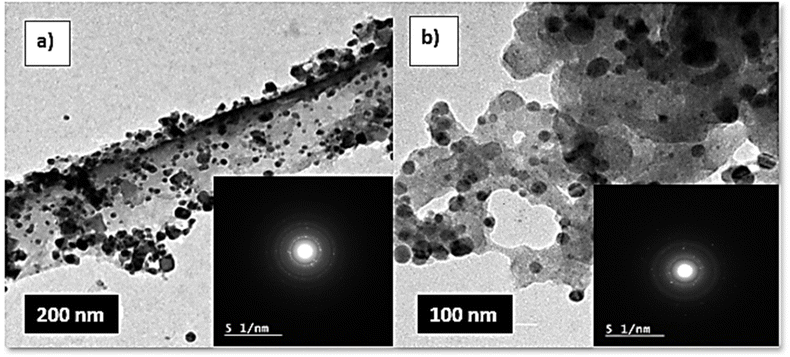
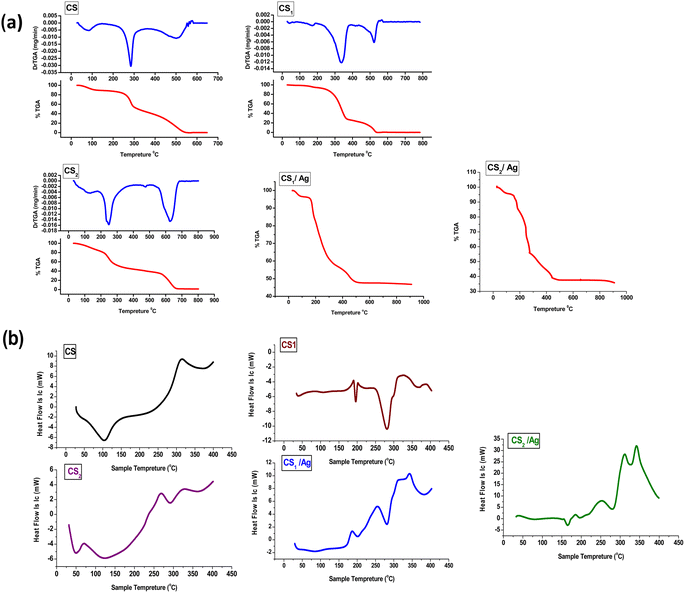
cos![[thin space (1/6-em)]](https://www.rsc.org/images/entities/char_2009.gif) θ, where the constant K = 0.91, λ = 0.15406 nm, β (in radians) is full width half maximum, and θ (deg) is peak position (radius). Scanning electron microscope (SEM) using an SEM model, FESEM, QUANTA FEG 250, FEI, Netherlands was used to the surface morphology of samples. A JEOL (JEM-210, Japan) transmission electron microscope (TEM) was used to confirm the formation of Chitosan Schiff bases. Thermo Scientific Fisher Niton XL2 XRF analyzer was used for X-ray fluorescence spectrometer (XRF) data. TGA measurements were performed on a Shimadzu-50 thermal analyzer from room temperature up to 800 °C at a heating rate of 10 °C min−1. Differential scanning calorimetric analyses (DSC) were accomplished with a DSC evo 131-stram, France, in a nitrogen atmosphere with a heating flow of 10 °C min−1 from −170 to 500 °C. Elemental microanalyses were measured on a PerkinElmer CHN-2400 analyzer at the Chemical War Department, Ministry of Defense, Cairo, Egypt.
θ, where the constant K = 0.91, λ = 0.15406 nm, β (in radians) is full width half maximum, and θ (deg) is peak position (radius). Scanning electron microscope (SEM) using an SEM model, FESEM, QUANTA FEG 250, FEI, Netherlands was used to the surface morphology of samples. A JEOL (JEM-210, Japan) transmission electron microscope (TEM) was used to confirm the formation of Chitosan Schiff bases. Thermo Scientific Fisher Niton XL2 XRF analyzer was used for X-ray fluorescence spectrometer (XRF) data. TGA measurements were performed on a Shimadzu-50 thermal analyzer from room temperature up to 800 °C at a heating rate of 10 °C min−1. Differential scanning calorimetric analyses (DSC) were accomplished with a DSC evo 131-stram, France, in a nitrogen atmosphere with a heating flow of 10 °C min−1 from −170 to 500 °C. Elemental microanalyses were measured on a PerkinElmer CHN-2400 analyzer at the Chemical War Department, Ministry of Defense, Cairo, Egypt.
2.4. Biological activities
| Antioxidant activity % = [{(Ac − At)/Ac} × 100] | (1) |
Protocol: All samples and controls should be tested in duplicate. ATP, PTK substrate Poly (Glu![[thin space (1/6-em)]](https://www.rsc.org/images/entities/char_2009.gif) :
:![[thin space (1/6-em)]](https://www.rsc.org/images/entities/char_2009.gif) Tyr 4
Tyr 4![[thin space (1/6-em)]](https://www.rsc.org/images/entities/char_2009.gif) :
:![[thin space (1/6-em)]](https://www.rsc.org/images/entities/char_2009.gif) 1) (10 mg mL−1), and 5× kinase buffer 1 were liquified. The master mixture was prepared (25 μl per well); consequently, 25 mL was added to every well. 5 mL of inhibitor solution was added to each well identified as a “test inhibitor”. Conversely, 5 mL of the same inhibitor-free solution (inhibitor buffer) was added to the “Reference Control” and “Blank”. 3 mL of 1× kinase buffer was developed by mixing 600 mL of 5× kinase buffer 1 with 2400 mL of water. About 20 mL of 1× kinase buffer 1 was added to the wells designated as “Blank”. EGFR enzyme was thawed on ice. Upon the first thaw, a brief tube containing the enzyme was spun to recover the full content of the tube. The amount of EGFR required for the assay was calculated, and the enzyme was diluted to 1 ng μl−1 with 1× kinase buffer 1. The reaction was initiated by adding 20 mL of diluted EGFR enzyme to the wells designated “positive control” and “test inhibitor control.” After incubation for 40 minutes at 30 °C, the Kinase-Glo Max reagent was defrosted. Following the 40 minute reaction, each well got 50 mL of Kinase-Glo Max reagent. Plates were coated with aluminum foil and incubated at room temperature for 15 min. Finally, luminescence was measured using the microplate reader.49
1) (10 mg mL−1), and 5× kinase buffer 1 were liquified. The master mixture was prepared (25 μl per well); consequently, 25 mL was added to every well. 5 mL of inhibitor solution was added to each well identified as a “test inhibitor”. Conversely, 5 mL of the same inhibitor-free solution (inhibitor buffer) was added to the “Reference Control” and “Blank”. 3 mL of 1× kinase buffer was developed by mixing 600 mL of 5× kinase buffer 1 with 2400 mL of water. About 20 mL of 1× kinase buffer 1 was added to the wells designated as “Blank”. EGFR enzyme was thawed on ice. Upon the first thaw, a brief tube containing the enzyme was spun to recover the full content of the tube. The amount of EGFR required for the assay was calculated, and the enzyme was diluted to 1 ng μl−1 with 1× kinase buffer 1. The reaction was initiated by adding 20 mL of diluted EGFR enzyme to the wells designated “positive control” and “test inhibitor control.” After incubation for 40 minutes at 30 °C, the Kinase-Glo Max reagent was defrosted. Following the 40 minute reaction, each well got 50 mL of Kinase-Glo Max reagent. Plates were coated with aluminum foil and incubated at room temperature for 15 min. Finally, luminescence was measured using the microplate reader.49
2.5. Molecular docking
The docking simulation was carried out using AutoDockVina.50,51 The crystal structure of the EGFR-T790M/V948R protein was obtained from the protein data bank using the PDB code 7ZYQ. All ligands and receptors were investigated for docking with rigid protein geometry by Auto Dock Tools version 1.5.6.52–54 The docking cavity was defined according to the interactions of the protein with the co-crystalized ligand, which is also used as a reference ligand. The grid box with dimensions of 14 × 24 × 14 points at X = 42.296, Y = −0.11672, and Z = −1.851 with 1.0 Å spacing was placed to make the entire binding cavity involved. The co-crystalized ligand was redocked to the receptor to validate the docking parameters. The 2D and 3D images were produced by Discovery Studio and Chimera.553 Results and discussion
3.1. Chemistry
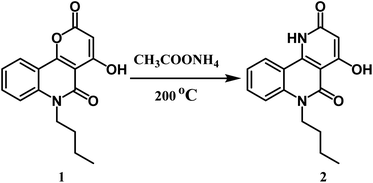
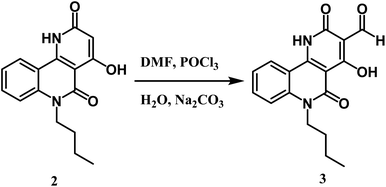
Here, we discuss an affordable and effectively operated lactone-to-lactam evolution to generate 6-butyl-4-hydroxybenzo[h][1,6]naphthyridine-2,5-dione 2.The reaction takes place between n-butyl pyranoquinolinone 1 and ammonium acetate at 200 °C in good yield (76%) as shown in Scheme 1.29 The structure of compound 2 was approved via spectral data. The IR spectrum of compound 2 displayed two adsorption bands at 3397 and 3296 cm−1 attributed to OH and NH groups, respectively. Also, the presence of a stretching band for cyclic lactam carbonyl at 1704 cm−1,29 which is lower than the cyclic lactone carbonyl group in the starting compound 1. 1H NMR declared the appearance of a new singlet signal at 7.81 ppm due to NH. 13C NMR spectrum revealed sixteen signals, which is agreeable with the number of carbon atoms in its molecular formula. The mass spectrum of compound 2 exhibited a molecular ion peak [M+] as the base peak at m/z 284.18 (100%).Formylation of compound 2 using the Vilsmeier–Haack reaction led to benzo[h][1,6]naphthyridine-3-carbaldehyde 3 (Scheme 2). The IR spectrum revealed three characteristic absorption bands assigned to three carbonyl groups at 1739 (HC![[double bond, length as m-dash]](https://www.rsc.org/images/entities/char_e001.gif) O), 1724 (C
O), 1724 (C![[double bond, length as m-dash]](https://www.rsc.org/images/entities/char_e001.gif) Oα-pyridone), and 1670 cm−1 (C
Oα-pyridone), and 1670 cm−1 (C![[double bond, length as m-dash]](https://www.rsc.org/images/entities/char_e001.gif) Oquinolone). While the 1H NMR spectrum of 3 demonstrated the absence of the singlet proton of C-3 at 5.06 ppm and displayed a distinguishable singlet signal ascribed to the aldehydic proton at δ 9.93 ppm, it also showed the existence of a more downfield chemical shift of OH at 10.35 ppm than starting compound 2, which happens because of the electron-withdrawing effect of the CHO group. 13C NMR confirmed the presence of formyl carbon signal at δ 189.9 ppm. The mass spectrum of compound 3 presented a molecular ion peak at m/z 312 (11%) (M+) and the base peak at m/z 284 (100%) assigned to [M+–CO].
Oquinolone). While the 1H NMR spectrum of 3 demonstrated the absence of the singlet proton of C-3 at 5.06 ppm and displayed a distinguishable singlet signal ascribed to the aldehydic proton at δ 9.93 ppm, it also showed the existence of a more downfield chemical shift of OH at 10.35 ppm than starting compound 2, which happens because of the electron-withdrawing effect of the CHO group. 13C NMR confirmed the presence of formyl carbon signal at δ 189.9 ppm. The mass spectrum of compound 3 presented a molecular ion peak at m/z 312 (11%) (M+) and the base peak at m/z 284 (100%) assigned to [M+–CO].
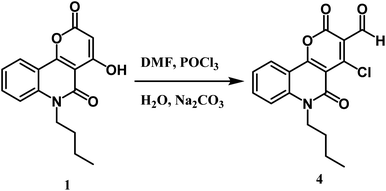
Furthermore, the novel 6-butyl-pyrano[3,2-c]quinoline-3-carbaldehyde 4 was efficiently synthesized from Vilsmeier–Haack formylation of 6-butyl-pyrano[3,2-c]quinoline-2,5-dione 1 (Scheme 3). The IR spectrum of the product proved the absence of the singlet proton at C-3 and the appearance of a new stretching vibration band at 1730 cm−1 due to the carbonyl group of the aldehydic group. 1H NMR spectrum exhibited the appearance of a singlet CHO signal at 9.99 ppm, as well as verifying the absence of the OH group. Our product gave a negative result with iron III chloride solution and a positive result with the Beilstein test. The previous observations indicate the presence of a chlorine atom instead of phenolic O–H. 13C NMR spectrum of synthesized compound 4 revealed a new sp2 hybridized carbon atom at 184.7 ppm attributed to the aldehyde group. Besides, the mass spectrum of compound 4 presented the molecular ion peak [M+] at m/z = 331 (45%) and [M+ + 2] at m/z = 333 (14%) as assumed for compounds containing one chlorine.
3.2. Synthesis of the novel chitosan Schiff bases CS1 and CS2
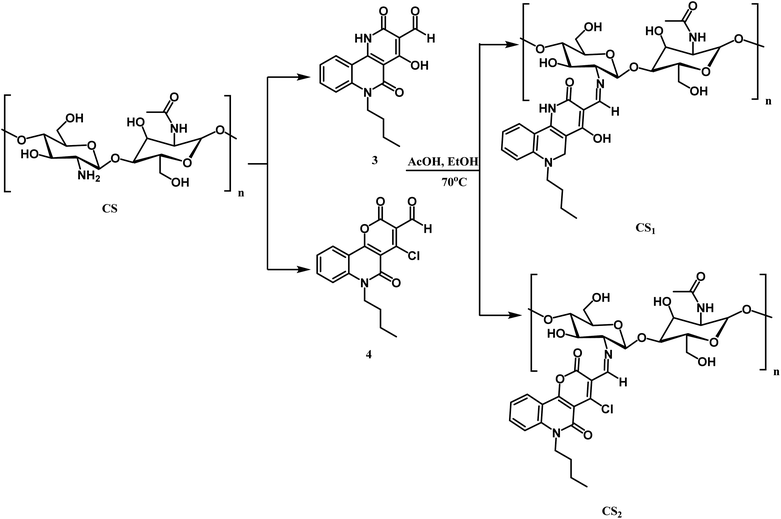
Scheme 4 illustrates the reaction of chitosan with the two carboxaldehydes 3, and 4 via the Schiff base condensation reaction. The chitosan amino group and aldehydic group of 3 or 4 reacted by nucleophilic attack, forming the azomethine group.3.3. Characterization of the prepared chitosan Schiff bases and their silver nanocomposites
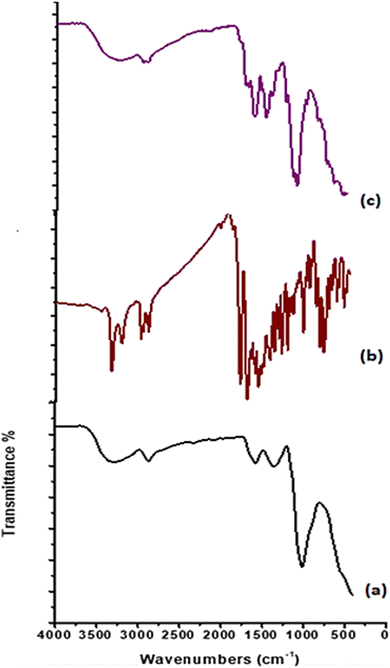
![[double bond, length as m-dash]](https://www.rsc.org/images/entities/char_e001.gif) O amide and NH amide bending. The band at 1418 cm−1 indicated the presence of NH2 bending. Otherwise, the peak at 1321 cm−1 is attributed to the stretching band C–N. An asymmetric stretching absorbance band at 1149 cm−1 is assigned to the C–O–C bridge. While bands at 1057, 1023, and 989 cm−1 are indicated to be C–O–H and C–O groups. After the formation of chitosan-based Schiff bases, new absorption bands appeared at 1662 cm−1 for CS1 and 1649 cm−1 for CS2, assigned to the imine bond –CH
O amide and NH amide bending. The band at 1418 cm−1 indicated the presence of NH2 bending. Otherwise, the peak at 1321 cm−1 is attributed to the stretching band C–N. An asymmetric stretching absorbance band at 1149 cm−1 is assigned to the C–O–C bridge. While bands at 1057, 1023, and 989 cm−1 are indicated to be C–O–H and C–O groups. After the formation of chitosan-based Schiff bases, new absorption bands appeared at 1662 cm−1 for CS1 and 1649 cm−1 for CS2, assigned to the imine bond –CH![[double bond, length as m-dash]](https://www.rsc.org/images/entities/char_e001.gif) N.56 Also, stretching vibration band was observed for CHaromatic at 1614 cm−1 for CS1 and 1618 cm−1 for CS2. Moreover, absorption bands at 3446 cm−1 (NH, OH), 2961 cm−1 (CHaliphatic), 1776 cm−1 (C
N.56 Also, stretching vibration band was observed for CHaromatic at 1614 cm−1 for CS1 and 1618 cm−1 for CS2. Moreover, absorption bands at 3446 cm−1 (NH, OH), 2961 cm−1 (CHaliphatic), 1776 cm−1 (C![[double bond, length as m-dash]](https://www.rsc.org/images/entities/char_e001.gif) Oα-pyridone), 1745 (C
Oα-pyridone), 1745 (C![[double bond, length as m-dash]](https://www.rsc.org/images/entities/char_e001.gif) Oquinolinone), 1558 (NHbending), and 1048 cm−1 (C–O str) are attributed to CS1. Vibration peaks at 3206 cm−1 (NH), 2925, 2873 cm−1 (CHaliphatic), 1700 cm−1 (C
Oquinolinone), 1558 (NHbending), and 1048 cm−1 (C–O str) are attributed to CS1. Vibration peaks at 3206 cm−1 (NH), 2925, 2873 cm−1 (CHaliphatic), 1700 cm−1 (C![[double bond, length as m-dash]](https://www.rsc.org/images/entities/char_e001.gif) Oα-pyrone), 1649 cm−1 (C
Oα-pyrone), 1649 cm−1 (C![[double bond, length as m-dash]](https://www.rsc.org/images/entities/char_e001.gif) Oquinolinone), 1552 (NHbending), and 1063 cm−1 (C–O str) corresponding to CS2.15
Oquinolinone), 1552 (NHbending), and 1063 cm−1 (C–O str) corresponding to CS2.15
3.4. Biological activities
4 Molecular docking study
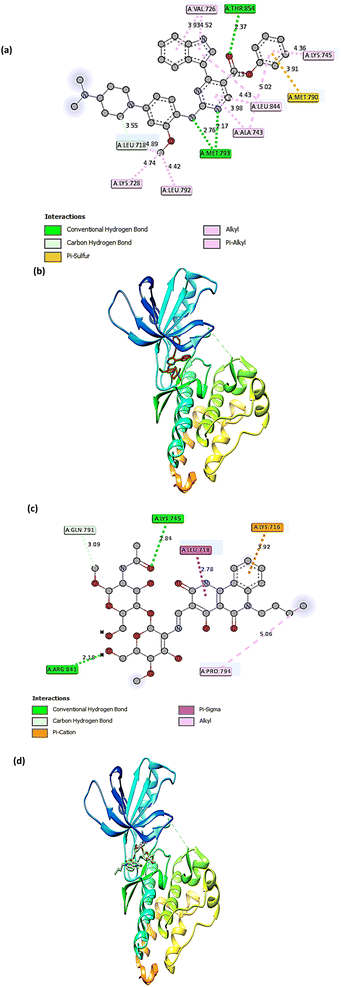
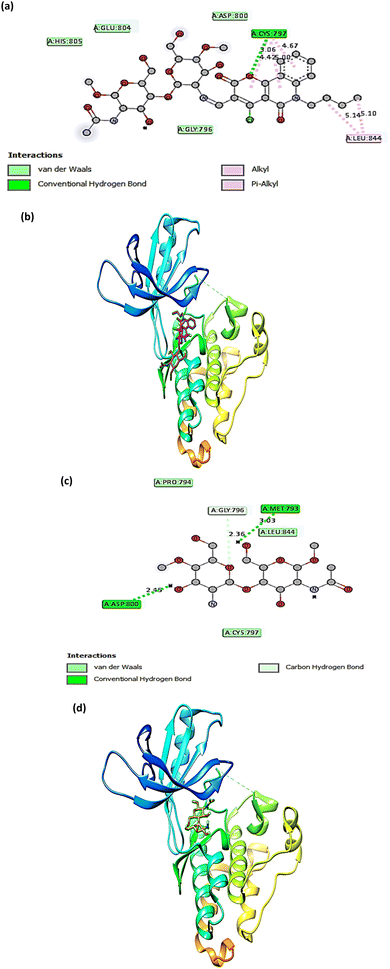
The molecular docking technique has emerged as a crucial strategy offering the most promising route for drug discovery.89 It is employed to predict the degree of binding affinity between a ligand molecule and a therapeutic target. Compared to traditional technologies, this computational tool is more affordable, efficient, and time-saving. This study was applied for CS, CS1, and CS2 to explore their binding mode towards the epidermal growth factor receptor kinase. The docking results revealed that our studied compounds occupy the same binding cavity as that occupied by the known potent EGFR inhibitor (V58,90 currently in the pre-clinical phase), as shown in Table 1. Through examination of the binding interactions of V58 to the active site of the EGFR, it showed strong bond interactions through two hydrogen bonds with key amino acids MET 793 and THR 854. In addition, it formed several Pi-interactions, including Pi-sulphur (MET 790) and six Pi–alkyl bonds (VAL 726, LYS 728, ALA 743, LYS 745, and LEU 844) (Fig. 8a and b). Compound CS1 displayed a better binding interaction with the enzyme active site among all compounds compared to the reference compound, as evidenced by the highest binding energy of −8 kcal mol−1 (Table 1). Compound CS1 disclosed several modes of interactions, including hydrogen bonds with LYS 745, ARG 841 through C![[double bond, length as m-dash]](https://www.rsc.org/images/entities/char_e001.gif) O, and the OH groups of the chitosan ring, respectively. Furthermore, some Pi-interactions were observed, including Pi-cation with LYS 716 through the benzo ring of the benzonaphthyridine compound, Pi-sigma with LEU 718 through the naphthyridine moiety, and Pi-alkyl with the butyl group of the naphthyridine ring through the amino acid PRO 794 as presented in Fig. 8c and d. The unique interaction of CS1, which comprises both hydrogen bonding and Pi interactions, indicates enhanced binding selectivity, which may describe its stronger inhibitory effect than CS and CS2 (Fig. 7). Although CS2 had a lower docking score than CS1, its performance is better than CS with the EGFR enzyme. Also, the proposed binding mode of CS2 demonstrated an affinity value of −6.5 kcal mol−1 with one hydrogen bond and 2Pi–alkyl bonds with CYS 797. Besides, it formed alkyl bonds through LEU 844 and van der Waals interactions with key residues ASP 800, GLY 796, GLU 804, and HIS 805 (Fig. 9a and b). Finally, the binding energy of CS (−6.1 kcal mol−1) (Fig. 9c and d) is slightly lower than that of CS1 and CS2. From the above results, the new synthesized Schiff base CS1 showed higher affinity towards EGFR kinase than CS2 and CS, which correlated well with the results obtained from experimental enzyme inhibition.
O, and the OH groups of the chitosan ring, respectively. Furthermore, some Pi-interactions were observed, including Pi-cation with LYS 716 through the benzo ring of the benzonaphthyridine compound, Pi-sigma with LEU 718 through the naphthyridine moiety, and Pi-alkyl with the butyl group of the naphthyridine ring through the amino acid PRO 794 as presented in Fig. 8c and d. The unique interaction of CS1, which comprises both hydrogen bonding and Pi interactions, indicates enhanced binding selectivity, which may describe its stronger inhibitory effect than CS and CS2 (Fig. 7). Although CS2 had a lower docking score than CS1, its performance is better than CS with the EGFR enzyme. Also, the proposed binding mode of CS2 demonstrated an affinity value of −6.5 kcal mol−1 with one hydrogen bond and 2Pi–alkyl bonds with CYS 797. Besides, it formed alkyl bonds through LEU 844 and van der Waals interactions with key residues ASP 800, GLY 796, GLU 804, and HIS 805 (Fig. 9a and b). Finally, the binding energy of CS (−6.1 kcal mol−1) (Fig. 9c and d) is slightly lower than that of CS1 and CS2. From the above results, the new synthesized Schiff base CS1 showed higher affinity towards EGFR kinase than CS2 and CS, which correlated well with the results obtained from experimental enzyme inhibition.
| Compound | Affinity (kcal mol−1) | Amino acid | Interaction types | Distance (Å) |
|---|---|---|---|---|
| CS | −6.1 | MET 793 | Hydrogen bond | 3.03 |
| 2.36 | ||||
| ASP 800 | Hydrogen bond | 2.45 | ||
| CYS 797 | van der Waals | — | ||
| PRO 794 | van der Waals | — | ||
| GLY 796 | Carbon hydrogen bond | — | ||
| CS1 | −8 | LYS 716 | Pi–cation | 3.92 |
| LEU 718 | Pi–sigma | 2.78 | ||
| LYS 745 | Hydrogen bond | 2.84 | ||
| PRO 794 | Pi–alkyl bonds | 5.06 | ||
| ARG 841 | Hydrogen bond | 2.18 | ||
| CS2 | −6.5 | CYS 797 | Hydrogen bond | 3.06 |
| CYS 797 | 2Pi–alkyl bonds | 4.42 | ||
| 4.67 | ||||
| LEU 844 | Alkyl bonds | 5.14 | ||
| 5.10 | ||||
| ASP 800 | van der Waals | — | ||
| GLY 796 | van der Waals | — | ||
| GLU 804 | van der Waals | — | ||
| HIS 805 | van der Waals | — | ||
| V58 | −9.9 | VAL 726 | Two Pi–alkyl bonds | 3.93 |
| 4.52 | ||||
| LYS 728 | Pi–alkyl bonds | 4.74 | ||
| ALA 743 | Pi–alkyl bond | 3.98 | ||
| LYS 745 | Pi–alkyl bond | 4.36 | ||
| MET 790 | Pi–sulfur | 3,91 | ||
| MET 793 | Hydrogen bond | 2.17 | ||
| 2.76 | ||||
| LEU 844 | Pi–alkyl bond | 4.43 | ||
| THR 854 | Hydrogen bond | 2.37 |
5 Conclusions
In the present study, new chemically modified chitosan with benzonaphthyridine and pyranoquinolinone motifs was synthesized. New chitosan Schiff bases decorated with silver nanoparticles to obtain new nanocomposite. The characterization of the target compounds was approved by FT-IR, XRD, SEM, TEM, EDX, XRF, TGA and DSC. The effect of chitosan modification with benzonaphthyridine and pyranoquinolinone on its antioxidant activity was estimated using the DPPH radical scavenging assay. As a result, an enhancement in the antioxidant activity was observed after the functionalization of chitosan with benzonaphthyridine and pyranoquinolinone, which are important scaffolds in pharmaceutical chemistry. Compound CS2/Ag showed a promising antioxidant activity with IC50 = 32.54 μg mL−1. Furthermore, all the synthesized Schiff bases were screened for their inhibitory profiles against EGFR kinase, utilizing sorafenib as a reference drug. Compound CS1/Ag displayed potent inhibitory activity towards EGFR (IC50 = 20.45 μg mL−1). Accordingly, CS2/Ag and CS1/Ag compounds can be considered as a hopeful template in the field of optimization and development of new drugs as antioxidant agents and EGFR inhibitors. The experimental enzyme inhibition results were further verified by the molecular docking study, which indicated that compound CS1 has a better binding with the EGFR receptor than chitosan alone and the other Schiff base CS2.Data availability
The data supporting this article have been included as part of the ESI.†Author contributions
Hany M. Hassanin: conceptualize the plan, and methodology. Shrouk M. Hassan and Mai A. Mostafa: performed the experiments, analyzed the experimental data, wrote the paper. Jehan M. Morsy and Elham S. Othman: revised the paper.Conflicts of interest
The authors declare that they have no competing interests.Acknowledgements
The authors extend their appreciation to the Deanship of Scientific Research at Ain Shams University for funding this work.Notes and references
- H. S. Adhikari and P. N. Yadav, Int. J. Biomater., 2018, 2018(1), 2952085, DOI:10.1155/2018/2952085.
- Q. Zhao, L. Fan, Y. Liu and J. Li, A review, Food Chem., 2022, 380, 131838, DOI:10.1016/j.foodchem.2021.131838.
- M. Z. Elsabee and E. S. Abdou, Mater. Sci. Eng., C, 2013, 33, 1819–1841, DOI:10.1016/j.msec.2013.01.010.
- X. Li, K. Chen, X. Ji, X. Yuan, Z. Lei, M. W. Ullah, J. Xiao and G. Yang, Eng. Sci., 2021, 13, 106–120, DOI:10.30919/es8d1159.
- M. Sun, L. Yuan, X. Yang and L. Shao, ES Mater. Manuf., 2020, 9, 40–47, DOI:10.30919/esmm5f780.
- K. Yao, J. Li, F. Yao and Y. Yin, Chitosan-based hydrogels, Taylor & Francis Group, LLC, 2012 Search PubMed.
- H. Xie, H. Yue, W. Zhang, W. Hu, X. Zhou, P. Prinsen and R. Luque, Catal. Commun., 2018, 104, 118–122, DOI:10.1016/j.catcom.2017.09.025.
- T. M. Tamer, M. M. ElTantawy, A. Brussevich, A. Nebalueva, A. Novikov, I. V. Moskalenko, M. M. Abu-Serie, M. A. Hassan, S. Ulasevich and E. V. Skorb, Int. J. Biol. Macromol., 2023, 234, 123687, DOI:10.1016/j.ijbiomac.2023.123687.
- Z. Zhou, Y. Liu, X. Jiang, C. Zheng, W. Luo, X. Xiang, X. Qi and J. Shen, Int. J. Biol. Macromol., 2023, 224, 797–809, DOI:10.1016/j.ijbiomac.2022.10.167.
- F. Bayat, M. Pourmadadi, M. M. Eshaghi, F. Yazdian and H. Rashedi, J. Cluster Sci., 2023, 34, 2565–2577, DOI:10.1007/s10876-023-02405-y.
- S. Maya, L. G. Kumar, B. Sarmento, N. S. Rejinold, D. Menon, S. V. Nair and R. Jayakumar, Carbohydr. Polym., 2013, 93(2), 661–669, DOI:10.1016/j.carbpol.2012.12.032.
- R. Antony, S. T. D. Manickam, K. Saravanan, K. Karuppasamy and S. Balakumar, J. Mol. Struct., 2013, 1050, 53–60, DOI:10.1016/j.molstruc.2013.07.006.
- A. B. Dos Santos, J. Traverse, F. J. Cervantes and J. B. van Lier, Biotechnol. Bioeng., 2005, 89, 42–52, DOI:10.1002/bit.20308.
- R. Verma, N. R. Peters, M. D'Onofrio, G. P. Tochtrop, K. M. Sakamoto, R. Varadan, M. Zhang, P. Coffino, D. Fushman, R. J. Deshaies and R. W. King, Science, 2004, 306, 117–120, DOI:10.1126/science.1100946.
- M. A. Ali, K. A. Aswathy, G. M. Ramanujam and V. Jaisankar, Int. J. Biol. Macromol., 2023, 225, 1575–1587, DOI:10.1016/j.ijbiomac.2022.11.214.
- A. G. Hamodin, W. E. Elgammal, A. M. Eid and A. G. Ibrahim, Int. J. Biol. Macromol., 2023, 243, 125180, DOI:10.1016/j.ijbiomac.2023.125180.
- C. A. Caro, L. Lillo, F. J. Valenzuela and G. Cabello, Chem.-Biol. Interact., 2017, 263, 81–87, DOI:10.1016/j.cbi.2016.12.021.
- N. Turan, K. Buldurun, F. Türkan, A. Aras, N. Çolak, M. Murahari, E. Bursal and A. Mantarcı, Mol. Diversity, 2022, 26, 2459–2472, DOI:10.1007/s11030-021-10344-x.
- K. Ramkumar, E. Serrao, S. Odde and N. Neamati, Med. Res. Rev., 2010, 30, 890–954, DOI:10.1002/med.20194.
- B. A. Johns, J. G. Weatherhead, S. H. Allen, J. B. Thompson, E. P. Garvey, S. A. Foster, J. L. Jeffrey and W. H. Miller, Bioorg. Med. Chem. Lett., 2009, 19, 1807–1810, DOI:10.1016/j.bmcl.2009.01.089.
- J. Y. Melamed, M. S. Egbertson, S. Varga, J. P. Vacca, G. Moyer, L. Gabryelski, P. J. Felock, K. A. Stillmock, M. V. Witmer, W. Schleif, D. J. Hazuda, Y. Leonard, L. Jin, J. D. Ellis and S. D. Young, Bioorg. Med. Chem. Lett., 2008, 18, 5307–5310, DOI:10.1016/j.bmcl.2008.08.038.
- M. S. Egbertson, H. M. Moritz, J. Y. Melamed, W. Han, D. S. Perlow, M. S. Kuo, M. Embrey, J. P. Vacca, M. M. Zrada, A. R. Cortes, A. Wallace, Y. Leonard, D. J. Hazuda, M. D. Miller, P. J. Felock, K. A. Stillmock, M. V. Witmer, W. Schleif, L. J. Gabryelski, G. Moyer, J. D. Ellis, L. Jin, W. Xu, M. P. Braun, K. Kassahun, N. N. Tsou and S. D. Young, Bioorg. Med. Chem. Lett., 2007, 17, 1392–1398, DOI:10.1016/j.bmcl.2006.11.080.
- G. Falardeau, H. Lachance, A. St-Pierre, C. G. Yannopoulos, M. Drouin, J. Bédard and L. Chan, Bioorg. Med. Chem. Lett., 2005, 15, 1693–1695, DOI:10.1016/j.bmcl.2005.01.050.
- L. Chan, H. Jin, T. Stefanac, J. F. Lavallée, G. Falardeau, W. Wang, J. Bédard, S. May and L. Yuen, J. Med. Chem., 1999, 42, 3023–3025, DOI:10.1021/jm9902483.
- A. M. Thompson, C. J. Connolly, J. M. Hamby, S. Boushelle, B. G. Hartl, A. M. Amar, A. J. Kraker, D. L. Driscoll, R. W. Steinkampf, S. J. Patmore, P. W. Vincent, B. J. Roberts, W. L. Elliott, W. Klohs, W. R. Leopold, H. D. Hollis Showalter and W. A. Denny, J. Med. Chem., 2000, 43, 4200–4211, DOI:10.1021/jm000161d.
- S. Vanlaer, A. Voet, C. Gielens, M. De Maeyer and F. Compernolle, Eur. J. Org Chem., 2009, 2009, 643–654, DOI:10.1002/ejoc.200800972.
- S. Bera, K. K. Pandey, A. C. Vora and D. P. Grandgenett, J. Mol. Biol., 2011, 410, 831–846, DOI:10.1016/j.jmb.2011.01.043.
- K. Prabha, R. Satheeshkumar, V. Nasif, J. Saranya, K. Sayin, J. Natarajan, C. Chandrasekar and K. J. Rajendra Prasad, ChemistrySelect, 2022, 7, e202200288, DOI:10.1002/slct.202200288.
- M. A. Mostafa, J. Phys. Org. Chem., 2023, 36, e4429, DOI:10.1002/poc.4429.
- K. D. Upadhyay, N. M. Dodia, R. C. Khunt, R. S. Chaniara and A. K. Shah, ACS Med. Chem. Lett., 2018, 9, 283–288, DOI:10.1021/acsmedchemlett.7b00545.
- H. M. Hassanin, W. R. Abd Elmoneam and M. A. Mostafa, Med. Chem. Res., 2019, 28, 28–38, DOI:10.1007/s00044-018-2259-9.
- S. M. Hassan, J. M. Morsy, H. M. Hassanin and E. S. Othman, J. Heterocycl. Chem., 2021, 58, 305–314, DOI:10.1002/jhet.4169.
- E. S. Othman, H. Hassan and M. Abass, J. Heterocycl. Chem., 2019, 56, 3257–3266, DOI:10.1002/jhet.3721.
- S. Jadhav, R. Patil, D. Kumbhar, A. Patravale, D. Chandam and M. Deshmukha, Int. J. Pharm. Sci. Rev. Res., 2015, 35, 75–82 Search PubMed.
- H. A. Abd El-Nabi, Pharmazie, 1997, 52, 28–32 CAS.
- I. S. Chen, S. J. Wu, I. L. Tsai, T. S. Wu, J. M. Pezzuto, M. C. Lu, H. Chai, N. Suh and C. M. Teng, J. Nat. Prod., 1994, 57, 1206–1211, DOI:10.1021/np50111a003.
- H. M. Hassanin, R. A. Serya, W. R. Abd Elmoneam and M. A. Mostafa, R. Soc. Open Sci., 2018, 5, 172407, DOI:10.1098/rsos.172407.
- A. M. Saeed, I. M. Abdou, A. A. Salem, M. A. Ghattas, N. Atatreh and S. S. AlNeyadi, Open Med. Chem. J., 2020, 10, 1–14, DOI:10.4236/ojmc.2020.101001.
- S. C. Boca, M. Potara, A. M. Gabudean, A. Juhem, P. L. Baldeck and S. Astilean, Cancer Lett., 2011, 311, 131–140, DOI:10.1016/j.canlet.2011.06.022.
- A. K. Mittal, S. Kumar and U. C. Banerjee, J. Colloid Interface Sci., 2014, 431, 194–199, DOI:10.1016/j.jcis.2014.06.030.
- J. Lin, Z. Huang, H. Wu, W. Zhou, P. Jin, P. Wei, Y. Zhang, F. Zheng, J. Zhang, J. Xu, Y. Hu, Y. Wang, Y. Li, N. Gu and L. Wen, Autophagy, 2014, 10, 2006–2020, DOI:10.4161/auto.36293.
- M. M. Abdel-Aziz, M. H. A. Elella and R. R. Mohamed, Int. J. Biol. Macromol., 2020, 142, 244–253, DOI:10.1016/j.ijbiomac.2019.09.096.
- J. Venkatesan, J. Y. Lee, D. S. Kang, S. Anil, S. K. Kim, M. S. Shim and D. G. Kim, Int. J. Biol. Macromol., 2017, 98, 515–525, DOI:10.1016/j.ijbiomac.2017.01.120.
- M. A. Mostafa, M. M. Ismail, J. M. Morsy, H. M. Hassanin and M. M. Abdelrazek, Polym. Bull., 2023, 80, 4035–4059, DOI:10.1007/s00289-022-04238-7.
- T. Kappe, R. Aigner, P. Hohengassner and W. Stadlbauer, J. Prakt. Chem./Chem.-Ztg., 1994, 336, 596–601, DOI:10.1002/prac.19943360707.
- S. M. Gomha, Z. A. Muhammad, M. R. Abdel-aziz, H. M. Abdel-aziz, H. M. Gaber and M. M. Elaasser, J. Heterocycl. Chem., 2018, 55, 530–536, DOI:10.1002/jhet.3088.
- G. C. Yen and P. D. Duh, J. Agric. Food Chem., 1994, 42, 629–632, DOI:10.1021/jf00039a005.
- E. A. Abdelsalam, A. A. Abd El-Hafeez, W. M. Eldehna, M. A. El Hassab, H. M. M. Marzouk, M. M. Elaasser, N. A. Abou Taleb, K. M. Amin, H. A. Abdel-Aziz, P. Ghosh and S. F. Hammad, J. Enzyme Inhib. Med. Chem., 2022, 37(1), 2265–2282, DOI:10.1080/14756366.2022.2104841.
- J. L. Nakamura, Expert Opin. Ther. Targets, 2007, 11(4), 463–472, DOI:10.1517/14728222.11.4.463.
- O. Trott and A. J. Olson, J. Comput. Chem., 2009, 31, 455–461, DOI:10.1002/jcc.21334.
- J. Eberhardt, D. Santos-Martins, A. F. Tillack and S. Forli, J. Chem. Inf. Model., 2021, 61, 3891–3898, DOI:10.1021/acs.jcim.1c00203.
- G. M. Morris, D. S. Goodsell, R. S. Halliday, R. Huey, W. E. Hart, R. K. Belew and A. J. Olson, J. Comput. Chem., 1998, 19, 1639–1662, DOI:10.1002/(SICI)1096-987X(19981115)19:14<1639:AID-JCC10>3.0.CO;2-B.
- R. Huey, G. M. Morris, A. J. Olson and D. S. Goodsell, J. Comput. Chem., 2007, 28, 1145–1152, DOI:10.1002/jcc.20634.
- G. M. Morris, R. Huey, W. Lindstrom, M. F. Sanner, R. K. Belew, D. S. Goodsell and A. J. Olson, J. Comput. Chem., 2009, 30, 2785–2791, DOI:10.1002/jcc.21256.
- E. F. Pettersen, T. D. Goddard, C. C. Huang, G. S. Couch, D. M. Greenblatt, E. C. Meng and T. E. Ferrin, J. Comput. Chem., 2004, 25, 1605–1612, DOI:10.1002/jcc.20084.
- X. Jin, J. Wang and J. Bai, Carbohydr. Res., 2009, 344, 825–829, DOI:10.1016/j.carres.2009.01.022.
- T. Baran, E. Açıksöz and A. Menteş, Carbohydr. Polym., 2016, 142, 189–198, DOI:10.1016/j.carbpol.2016.01.057.
- X. Wang, Y. Du, L. Fan, H. Liu and Y. Hu, Polym. Bull., 2005, 55, 105–113, DOI:10.1007/s00289-005-0414-1.
- M. Timur and A. Paşa, ACS Omega, 2018, 3, 17416–17424, DOI:10.1021/acsomega.8b01872.
- J. U. Shareef, M. N. Rani, S. Anand and D. Rangappa, Mater. Today: Proc., 2017, 4(11), 11923–11932, DOI:10.1016/j.matpr.2017.09.113.
- S. Hajji, R. B. S. B. Salem, M. Hamdi, K. Jellouli, W. Ayadi, M. Nasri and S. Boufi, Process Saf. Environ. Prot., 2017, 111, 112–121, DOI:10.1016/j.psep.2017.06.018.
- R. A. Abdel-Monem, A. M. Khalil, O. M. Darwesh, A. I. Hashim and S. T. Rabi, J. Macromol. Sci., Part A: Pure Appl. Chem., 2020, 57, 145–155, DOI:10.1080/10601325.2019.1674666.
- A. H. Doctorsafaei, S. B. Burujeny, H. A. Rudbari, N. Kordestani and S. A. A. Najafabadi, Chem. Eng. J., 2020, 381, 122776, DOI:10.1016/j.cej.2019.122776.
- S. Kumar, M. Kumari, P. K. Dutta and J. Koh, Int. J. Polym. Mater., 2014, 63, 173–177, DOI:10.1080/00914037.2013.812088.
- H. Ma, A. Kong, Y. Ji, B. He, Y. Song and J. Li, J. Cleaner Prod., 2019, 214, 89–94, DOI:10.1016/j.jclepro.2018.12.217.
- S. Pal, Y. K. Tak and J. M. Song, Environ. Microbiol., 2007, 73, 1712–1720, DOI:10.1128/AEM.02218-06.
- C. Karthik, S. Suresh, S. Mirulalini and S. Kavitha, Inorg. Nano-Met. Chem., 2020, 50, 606–612, DOI:10.1080/24701556.2020.1723025.
- A. A. Hamed, G. R. Saad, I. A. Abdelhamid, M. M. Abdel-Aziz, H. A. Taha, M. M. Abou El Dahab and M. Z. Elsabee, Polym. Bull., 2022, 79, 11259–11284, DOI:10.1007/s00289-021-03993-3.
- A. M. Omer, Z. M. Ziora, T. M. Tamer, R. E. Khalifa, M. A. Hassan and M. S. Mohy-Eldin, Molecules, 2021, 26, 449, DOI:10.3390/molecules26020449.
- P. Ferreira, J. F. J. Coelho, K. S. C. R. Dos Santos, E. I. Ferreira and M. H. Gil, J. Carbohydr. Chem., 2006, 25, 233–251, DOI:10.1080/07328300600734085.
- M. A. Hassan, T. M. Tamer, K. Valachová, A. M. Omer, M. El-Shafeey, M. S. M. Eldin and L. Šoltés, Int. J. Biol. Macromol., 2021, 166, 18–31, DOI:10.1016/j.ijbiomac.2020.11.119.
- R. A. Abdel-Monem, A. M. Khalil, O. M. Darwesh, A. I. Hashim and S. T. Rabie, J. Macromol. Sci., Part A: Pure Appl.Chem., 2020, 57, 145–155, DOI:10.1080/10601325.2019.1674666.
- A. M. Khalil, R. A. Abdel-Monem, O. M. Darwesh, A. I. Hashim, A. A. Nada and S. T. Rabie, J. Chem., 2017, 1, 1434320, DOI:10.1155/2017/1434320.
- L. Zeng, C. Qin, L. Wang and W. Li, Carbohydr. Polym., 2011, 83, 1553–1557, DOI:10.1016/j.carbpol.2010.10.007.
- E. Musellim, M. H. Tahir, M. S. Ahmad and S. Ceylan, Appl. Therm. Eng., 2018, 137, 54–61, DOI:10.1016/j.applthermaleng.2018.03.050.
- T. M. Tamer, M. A. Hassan, A. M. Omer, W. M. Baset, M. E. Hassan, M. E. El-Shafeey and M. S. M. Eldin, Process Biochem., 2016, 51, 1721–1730, DOI:10.1016/j.procbio.2016.08.002.
- J. Ma, C. Liu, R. Li and J. Wang, e-Polym., 2012, 12, 1–14, DOI:10.1515/epoly.2012.12.1.386.
- M. E. Ahmed, H. M. Mohamed, M. I. Mohamed and N. G. Kandile, Int. J. Biol. Macromol., 2020, 162, 1388–1397, DOI:10.1016/j.ijbiomac.2020.08.048.
- T. M. Tamer, K. Valachová, M. S. Mohyeldin and L. Soltes, J. Appl. Pharm. Sci., 2016, 6, 195–201, DOI:10.7324/JAPS.2016.60428.
- K. Chokshi, I. Pancha, T. Ghosh, C. Paliwal, R. Maurya, A. Ghosh and S. Mishra, RSC Adv., 2016, 6, 72269–72274, 10.1039/C6RA15322D.
- S. S. Alharthi, T. Gomathi, J. J. Joseph, J. Rakshavi, J. A. K. Florence, P. N. Sudha, P. N. Sudha, G. Rajakumar and M. Thiruvengadam, J. King Saud Univ., Sci., 2022, 34, 102177, DOI:10.1016/j.jksus.2022.102177.
- S. Hajji, S. B. Khedir, I. H. Mnif, M. Hamdi, I. Jedidi, R. Kallel, S. Boufi and M. Nasri, Subjects, 2019, 1863, 241–254, DOI:10.1016/j.bbagen.2018.10.010.
- J. Zhou, B. Wen, H. Xie, C. Zhang, Y. Bai, H. Cao, Q. Che, J. Guo and Z. Su, Food Funct., 2021, 12, 926–951, 10.1039/D0FO02768E.
- T. M. Tamer, H. Zhou, M. A. Hassan, M. M. Abu-Serie, S. Shityakov, S. M. Elbayomi, M. S. Mohy-Eldin, Y. Zhang and T. Cheang, Int. J. Biol. Macromol., 2023, 240, 124339, DOI:10.1016/j.ijbiomac.2023.124339.
- R. F. Elshaarawy, A. A. Refaee and E. A. El-Sawi, Carbohydr. Polym., 2016, 146, 376–387, DOI:10.1016/j.carbpol.2016.03.017.
- A. L. Fadli, A. Hanifah, A. Fitriani, A. Rakhmawati and W. S. B. Dwandaru, AIP Conf. Proc., 2018, 2014, 020017, DOI:10.1063/1.5054421.
- S. Govindan, E. A. K. Nivethaa, R. Saravanan, V. Narayanan and A. Stephen, Appl. Nanosci., 2012, 2, 299–303, DOI:10.1007/s13204-012-0109-5.
- I. Aranaz, A. R. Alcántara, M. C. Civera, C. Arias, B. Elorza, A. H. Caballero and N. Acosta, Polymers, 2021, 13, 3256, DOI:10.3390/polym13193256.
- Y. Gan, Y. Xu, X. Zhang, H. Hu, W. Xia, Z. Yu, T. Sun, J. Zhang, C. Wen and S. Zheng, Molecules, 2023, 28, 6962, DOI:10.3390/molecules28196962.
- T. Grabe, K. Jeyakumar, J. Niggenaber, T. Schulz, S. Koska, S. Kleinbölting, M. E. Beck, M. P. Müller and D. Rauh, ACS Med. Chem. Lett., 2023, 14, 591–598, DOI:10.1021/acsmedchemlett.2c00514.
Footnote |
| † Electronic supplementary information (ESI) available. See DOI: https://doi.org/10.1039/d4ra05117c |
| This journal is © The Royal Society of Chemistry 2024 |

