DOI:
10.1039/D4RA03178D
(Paper)
RSC Adv., 2024,
14, 18777-18786
Investigation on structure and photoluminescence properties of Ho3+ doped Ca3(VO4)2 phosphors for luminescent devices
Received
29th April 2024
, Accepted 30th May 2024
First published on 12th June 2024
Abstract
This study focuses on the synthesis and characterization of Ho3+ doped Ca3(VO4)2 phosphor for potential application in solid-state lighting technology. A citrate-based sol–gel process is optimized to achieve sheet-like morphologies in the phosphor material. The investigation reveals UV absorption at 371 nm, indicating a band gap of 3.28 eV. Emission transitions at (506, 541, and 651) nm are observed when excited at 451 nm, with an optimal Ho3+ concentration of 0.05 mol resulting in robust green emission at 541 nm. The concentration quenching in Ca3(VO4)2:xHo3+ phosphors is discussed in detail with Blesse's and Dexter's models. The concentration quenching effect found in the studied samples is due to the dipole–dipole interactions. Judd–Ofelt intensity parameters were calculated from the excitation bands, and for Ω2, Ω4, and Ω6 are (0.16, 0.17, and 0.36) × 10−20 cm2, respectively. The emission properties for the (5S2 + 5F4) → 5I8 and 5F5 → 5I8 transitions are also estimated with J–O parameters. The higher magnitude of branching ratios (83%) and emission cross-sections (1.6 × 10⁻²¹ cm2) suggest that the Ca3(VO4)2:0.05Ho3+ phosphor materials may be suitable for efficient green-emitting device applications. The CIE coordinates confirm the potential of Ho3+-doped phosphors for green emissions, making them suitable for solid-state lighting and display technology.
1. Introduction
Phosphors play a pivotal role in advancing various lighting and display technologies, with particular importance in developing efficient white light-emitting diodes (w-LEDs) and displays.1–4 The pursuit of ideal phosphor materials has been driven by the desire to efficiently generate a broad spectrum of colors, particularly in converting ultraviolet (UV) or blue light, which are common excitation sources, into visible light.5,6 This quest has led to extensive research in the field of phosphor materials, spanning a variety of chemical composition and structural characteristics.7,8 Among the diverse classes of phosphor materials, vanadate compounds have garnered considerable attention, and one standout candidate in this category is calcium orthovanadate, denoted as Ca3(VO4)2, which has piqued the interest of researchers and material scientists due to its unique luminescent properties.9,10 The choice of vanadate compounds is well-founded, as they offer several advantages. They exhibit tunable emission characteristics; hence the color and intensity of emitted light can be tailored for specific applications.11–13 This tunability is a crucial feature for creating phosphors that can complement the spectral sensitivity of human vision, resulting in optimal lighting and display quality. Ca3(VO4)2, a type of vanadate, has a crystalline structure that, when doped with certain rare-earth ions, can be customized to emit light in the visible spectrum.14 This feature makes Ca3(VO4)2 a compelling option for requiring green emissions, such as in w-LEDs and display technologies.15 The flexibility of Ca3(VO4)2 based phosphors stems from their adjustable emission properties, enabling the creation of materials that emit light in a controlled and effective manner. The development of white light-emitting diodes (LEDs) depends heavily on green-emitting phosphors. Among luminous activators, Tb3+ ions are renowned for their excellent quantum yield, radiation purity, and stability.16,17 To study green luminescence, Tb3+ ions have recently been added to host materials, such as BiOCl and SrAl2O4.18,19 The 4f8–4f75d1 transition is responsible for the wide excitation properties that Tb3+ ions display in the (220–300) nm region. Surprisingly, isolated VO43− moieties are also absorbed in this excitation range, possibly serving as Tb3+ ion sensitizers. Kuz’micheva et al. demonstrate the spectral-luminescent properties in Tm-doped Ca3(VO4)2.20 Voronina et al. describe the yellow emission in Mn-doped Ca3(VO4)2,21 while Kuz’micheva et al. show the presence of both Mn2+ and Mn3+ in manganese-doped Ca3(VO4)2,22 Chen et al. describe the strong absorption at the visible wavelength in Cr-doped Ca3(VO4)2,13 and Ivleva et al. report the optical homogeneity in Tm3+/Ho3+ co-doped Ca3(VO4)2.23
In recent years, the focus of research has extended to the doping of Ca3(VO4)2 with various rare-earth ions, including trivalent holmium (Ho3+). Incorporating Ho3+ ions into the crystal lattice of Ca3(VO4)2 has shown promise in generating strong green emissions. This is of great significance in the context of w-LEDs, where achieving a balanced and vibrant white light output depends on the efficient emission of various colors, including green. Vanadate phosphors may be synthesized using a variety of procedures that include co-precipitation,24 solid-state reaction,25 hydrothermal synthesis,26,27 combustion synthesis,28 and sol–gel approaches.29 The capacity to obtain phosphors in phase-pure form is critical for fundamental scientific research, as well as practical applications. In this context, the sol–gel methodology used in this work provides a more convenient path than typical solid-state procedures.30 Traditional procedures require extended preheating and high-temperature sintering, whereas the sol–gel process is a gentler and more efficient alternative. In this investigation, the sol–gel method has been adopted to prepare Ca3(VO4)2:Ho3+ phosphors. This study investigates Ca3(VO4)2:Ho3+ phosphors for use as green emitters in solid-state lighting. It examines their crystal structure, morphology, and photoluminescent properties to determine the optimal Ho3+ concentration for strong green emissions, showcasing their potential for high-quality green light output.
2. Material synthesis
The sol–gel method for the synthesis of Ca3(VO4)2:xHo3+ phosphors is a well-controlled and accurately designed process. Each step, from reagent selection to the final heat treatment, plays a critical role in determining the composition, structure, and properties of the phosphor material. The success of this method relies on the precise control of reaction conditions, temperature, and time to achieve the desired outcome, making it suitable for producing specialized materials with tailored characteristics. A suitable amount of initial reagents, such as Ca(NO3)2·4H2O, NH4VO3, Ho(NO3)3·6H2O, and citric acid (in molar ratio 2![[thin space (1/6-em)]](https://www.rsc.org/images/entities/char_2009.gif) :
:![[thin space (1/6-em)]](https://www.rsc.org/images/entities/char_2009.gif) 1 with metal ion), are mixed in a 150 mL glass beaker with 10 mL of deionized water. This step is key, as it initiates the formation of a sol, which is a colloidal suspension of solid particles in a liquid. The mixture is agitated at 500 rpm for up to 1 hour. During this time, the reagents react, and a yellow liquified solution is formed, ensuring a homogenous product is formed. Citric acid plays a key role in this process as a chelating agent, helping to control the gel formation. After stirring for one hour, the solution is transferred into the oven at 110 °C overnight. This step is important for removing the liquid component and forming a gel. The solution gradually transforms into a gel, which is a three-dimensional network of solid particles held within the liquid medium. The choice of 110 °C temperature and the duration of heating are crucial parameters for controlling the gel formation process. The dry gels obtained from the previous step are sintered at 400 °C for 120 min in the presence of air in a muffle furnace. The specific sintering temperature and duration are carefully selected to ensure that the desired phase is obtained. The last step involves further heating the resultant black powder samples in air at a higher temperature of 800 °C for 2 h in a muffle furnace. This additional heat treatment is likely to optimize the phosphor's properties. It could be necessary to enhance its luminescent characteristics and ensure the formation of the desired crystal structure. A series of Ca3(VO4)2:xHo3+ (0.01 ≤ x ≤ 0.11) phosphors were synthesized by this approach to understand the impact of Ho3+ on the crystal lattice of Ca3(VO4)2.
1 with metal ion), are mixed in a 150 mL glass beaker with 10 mL of deionized water. This step is key, as it initiates the formation of a sol, which is a colloidal suspension of solid particles in a liquid. The mixture is agitated at 500 rpm for up to 1 hour. During this time, the reagents react, and a yellow liquified solution is formed, ensuring a homogenous product is formed. Citric acid plays a key role in this process as a chelating agent, helping to control the gel formation. After stirring for one hour, the solution is transferred into the oven at 110 °C overnight. This step is important for removing the liquid component and forming a gel. The solution gradually transforms into a gel, which is a three-dimensional network of solid particles held within the liquid medium. The choice of 110 °C temperature and the duration of heating are crucial parameters for controlling the gel formation process. The dry gels obtained from the previous step are sintered at 400 °C for 120 min in the presence of air in a muffle furnace. The specific sintering temperature and duration are carefully selected to ensure that the desired phase is obtained. The last step involves further heating the resultant black powder samples in air at a higher temperature of 800 °C for 2 h in a muffle furnace. This additional heat treatment is likely to optimize the phosphor's properties. It could be necessary to enhance its luminescent characteristics and ensure the formation of the desired crystal structure. A series of Ca3(VO4)2:xHo3+ (0.01 ≤ x ≤ 0.11) phosphors were synthesized by this approach to understand the impact of Ho3+ on the crystal lattice of Ca3(VO4)2.
X-ray diffraction (XRD) analysis of the powders was conducted by diffractometry (RIGAKU, Miniflex-II). CuKα radiation (with λ = 1.5406 Å) was employed as the X-ray source. The patterns were collected at a fixed 5° min−1 scan rate ranging 2θ = (10 to 50)°. The morphology study was performed using an S-3400 (Hitachi, Japan) SEM. A Cary 5000, UV-vis instrument was used to record the UV-vis reflectance spectra. Luminescence studies were conducted via fluorescence spectrometry (Shimadzu, RF-5301PC), with an attached xenon flash lamp as the excitation source.
3. Results and discussion
3.1 X-ray diffraction (XRD)
The structure of Ca3(VO4)2:Ho3+ phosphors is crucial for customizing their properties for various applications, especially in luminescent devices. The X-ray diffraction patterns for holmium-doped calcium orthovanadate phosphors lie in a (10 to 50)° range, as shown in Fig. 1. The XRD peaks observed match well with the JCPDS card no. 46-0756, indicating the formation of Ca3(VO4)2:Ho3+ phosphor. As the percentage of dopant within Ca3(VO4)2 is increased, secondary peaks emerge in XRD patterns, indicative of secondary phase (marked by the symbol*) formation beyond optimal concentrations. The secondary peak most likely belongs to the CaV2O5 material, which is formed when Ho3+ is incorporated.12 This XRD peak most likely belongs to CaV2O5, which is the most prominent peak in JCPDS card no. 30-0286. With increasing Ho3+ ion concentration, the intensity of the secondary peak continuously increases. However, XRD did not reveal the presence of a dopant peak as an impurity. The successful incorporation of Ho3+ ions into the Ca3(VO4)2 host lattice is indicated by their substitution for Ca2+ ions, facilitated by their comparable ionic radius of Ho3+ (1.01 Å) and Ca2+ (1.12 Å) ions.20,23,31 Whereas the V5+ ionic radius is about 0.35 Å, which is smaller than the Ho3+ and Ca2+ ions, thus V5+ ions can't be facilitated as an interstitial atom for Ho3+ ions. Chauhan et al. have reported that in the host structure Ca3(VO4)2, the Sm3+ ion can replace the Ca2+ site.32 This substitution leads to a noticeable shift in the XRD patterns, with the shift towards higher angles. The difference in ionic radii between Sm3+ and Ca2+ ions accounts for this shift. Specifically, the larger size of the Sm3+ ion, compared to Ca2+, disrupts the regular lattice arrangement, resulting in alterations in the diffraction pattern.32 Ivleva et al. also reported the substitution of rare earth elements (Tm + Ho) into the Ca2+ site of Ca3(VO4)2.23 Li et al. found that Eu3+ ions were successfully substituted for Ca2+ ions in the rhombohedral phase of Ca3(VO4)2. This substitution was possible due to the similar ionic radii of Eu3+ and Ca2+.33 Kuz’micheva et al. propose that Mn5+ can replace V5+ ions in Ca3(VO4)2, a substitution supported by previous research.22 Based on the results, Ho3+ ions could potentially replace Ca2+ ions in the crystal lattice of Ca3(VO4)2, similar to Eu3+ ions. The XRD pattern justifies the presence of a hexagonal phase with the space symmetry of R3c. The average crystallite size is calculated using the Scherrer equation:34| |
D = 0.9λ/β![[thin space (1/6-em)]](https://www.rsc.org/images/entities/char_2009.gif) cos cos![[thin space (1/6-em)]](https://www.rsc.org/images/entities/char_2009.gif) θ θ
| (1) |
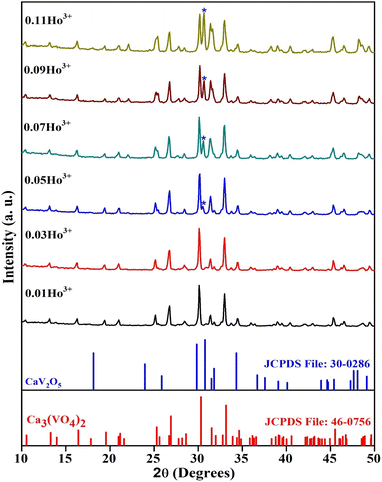 |
| | Fig. 1 XRD patterns of Ca3(VO4)2:xHo3+ phosphors along with standard JCPDS cards data of Ca3(VO4)2 and CaV2O5. | |
All the samples exhibit an average crystallite size of <50 nm, which provides evidence for the use of these materials in nanomaterial technology. The crystallite size can affect the peak shape, intensity, and broadening in XRD patterns. These changes can impact the ability to identify the phase of a nanomaterial. The crystallite size can influence the physical and chemical properties of nanomaterials, including their mechanical, electrical, and catalytic properties, making it a critical parameter to consider in nanoscience and materials research. It has been observed from Table 1 that all the samples exhibit uniform crystallite size, but the sample with optimal concentration of Ho3+ shows a slight decrease in crystallite size, because the initial introduction of dopants might have a more pronounced effect on crystallite size, as they have a significant impact on the crystal structure. As the dopant concentration increases, the effects may saturate or reach a maximum, and further doping does not have as significant an impact on the crystallite size. Fig. 2 shows the structure of the Ca3(VO4)2 and Ho3+-doped Ca3(VO4)2 crystal structures.
Table 1 Crystallite size and lattice strain of all samples
| S. no. |
Material composition |
Crystallite size (nm) |
Lattice strain |
| 1 |
Ca3(VO4)2:0.01Ho3+ |
42.98 |
0.0032 |
| 2 |
Ca3(VO4)2:0.03Ho3+ |
42.98 |
0.0032 |
| 3 |
Ca3(VO4)2:0.05Ho3+ |
40.93 |
0.0034 |
| 4 |
Ca3(VO4)2:0.07Ho3+ |
42.94 |
0.0034 |
| 5 |
Ca3(VO4)2:0.09Ho3+ |
42.98 |
0.0032 |
| 6 |
Ca3(VO4)2:0.11Ho3+ |
42.98 |
0.0032 |
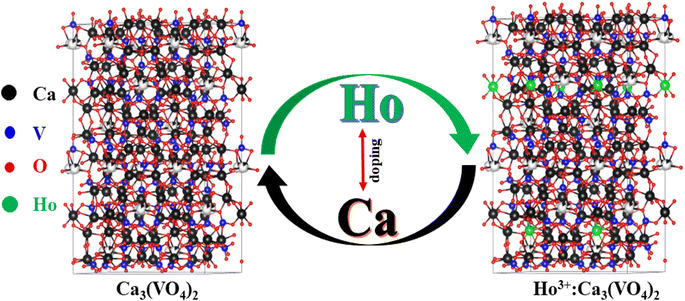 |
| | Fig. 2 General view of Ca3(VO4)2 and Ho3+ doped Ca3(VO4)2 crystal structure. | |
3.2 Scanning electron microscopy (SEM)
Morphological analysis can provide valuable insights into the physical properties and structure of Ca3(VO4)2, which is important for understanding its behavior and applications in various fields, such as materials science, chemistry, and solid-state physics. Fig. 3a represents the SEM micrographs of the Ca3(VO4)2:0.05Ho3+ phosphor. The morphology depicts the irregular sheet-like morphology formed throughout the whole sample and shows that there is no regularity in the particle size of the Ca3(VO4)2:0.05Ho3+ phosphor. The formation of irregular sheet-like morphology in materials like Ca3(VO4)2 can be influenced by various factors that include chemical composition, crystal structure, synthesis conditions, and growth mechanisms.35 The initial nucleation of crystals and their subsequent growth can lead to the formation of sheet-like structures if the growth rate in one dimension is much faster than in the others. This can result in the development of thin, plate-like crystals or sheets. Fig. 3b (enlarged view of zone (a′)) represents a magnified version of the Ca3(VO4)2:0.05Ho3+ phosphor material, in which both small and large particles can be observed. Note also that a few pores are present in the particles, which is due to the ejection of large amounts of hot gases while heating the xerogels.36 The presence of such pores in xerogels is not unusual and can affect the physical properties of the material. The size and distribution of the pores can vary depending on factors like the gel preparation method, type of solvent used, heating conditions, and gel composition.37 In some cases, these pores may be considered a desirable feature, such as in applications where a high surface area or improved adsorption properties are required.38 The control of pore size and distribution in xerogels is an important aspect of their synthesis, and adjusting the drying conditions and gel composition can be used to tailor the resulting porosity to meet specific application requirements.39 The presence of certain additives, impurities, or surfactants in the synthesis process can influence crystal growth and morphology. These substances can affect the rate of growth along different crystallographic directions, potentially leading to the formation of sheets.
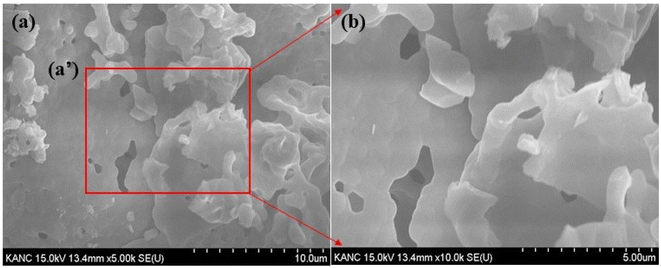 |
| | Fig. 3 SEM images of Ca3(VO4)2:0.05Ho3+ phosphor. | |
3.3 UV-vis reflectance spectroscopy
The reflection peaks of the synthesized Ca3(VO4)2:0.05Ho3+ phosphor serve as distinctive markers of energy transitions in Ho3+ ions. They offer a comprehensive perspective on the rich energy level structure of the 4f electron shell, and open exciting possibilities for exploiting these materials in advanced photonic and optoelectronic technologies. The observed reflection peaks in the Ca3(VO4)2:0.05Ho3+, spanning a broad wavelength ranging (200 to 2000) nm, provide valuable insights into the optical properties and energy level structure of the Ho3+ ions doped into the host material. Fig. 4a shows the diffuse reflectance spectrum of the Ca3(VO4)2:0.05Ho3+ phosphor. The distinctive peaks, appearing at approximately (420, 456, 487, 544, and 650) nm, correspond to energy absorption processes from the 5I8 ground state of the Ho3+ ions to various excited states within the 4f electron shell.40,41 These transitions are associated with the 4f10–4f10 electronic configuration of Ho3+ ions and carry significant implications for the study of rare earth-doped materials and their applications in optoelectronics and photonics. The absorption peak at around 420 nm is attributed to the 5G5 transition. This phenomenon involves the promotion of Ho3+ ions from their ground state (5I8) to the excited 5G5 state. This transition underscores the specificity of the electronic transitions within Ho3+ ions, while also serving as a key reference point for characterizing the material's optical behavior. The reflection peak at 456 nm is indicative of a more complex transition. At this wavelength, Ho3+ ions are undergoing simultaneous excitation to two different states, namely, the 5G6 and 5F1 states. This suggests that the absorption of energy leads to changes in the electron configuration of Ho3+ ions, including both 5G6 and 5F1 transitions. The peak at 487 nm corresponds to the 5F3 transition, which signifies the absorption of energy, enabling Ho3+ ions to transition from their ground state to the excited 5F3 state. This transition adds to the spectrum of energy levels accessible to Ho3+ ions and is a crucial factor in understanding their optical characteristics. At 544 nm, the spectral feature is associated with the simultaneous excitation of two states, 5F4 and 5S2. This points to the versatility of the electronic transitions within Ho3+ ions, allowing them to be promoted to multiple excited states with distinct energy levels. This transition, reflecting the rich energy level structure of the 4f shell, holds the key to the optical behavior of the material. The peak at 650 nm corresponds to the 5F5 transition, signifying the absorption of energy that leads to the transition of Ho3+ ions from their ground state to the 5F5 excited state. This transition offers further evidence of the intricate energy level structure present in the 4f electron shell of Ho3+ ions. The additional peak at 1200 nm is associated with the 5I6 transition. This transition entails the promotion of Ho3+ ions from their ground state, 5I8, to the 5I6 excited state.41 The observation of these well-defined reflection peaks both allows for the precise identification of Ho3+ ion transitions and contributes to our understanding of the optical properties of rare earth doped materials. These findings are of significant relevance to the development of novel photonic devices, such as lasers and amplifiers, and to the design of phosphors with tailored luminescent properties.
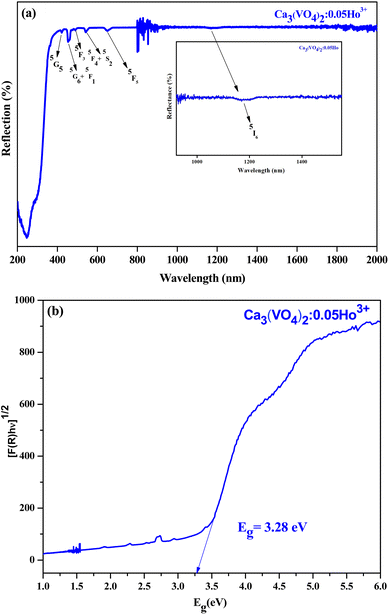 |
| | Fig. 4 (a) UV-vis spectrum of Ca3(VO4)2:0.05Ho3+ phosphor. (b) Band gap of Ca3(VO4)2:0.05Ho3+ phosphor. | |
The band gap estimation using the Kubelka–Munk equation and diffused reflectance spectroscopy (DRS) provides valuable information about the material's semiconducting properties and its suitability for specific optical and electronic applications.42 The determination of the band gap of the Ca3(VO4)2 doped with Ho3+ at a concentration of 0.05 using the Kubelka–Munk equation is a significant finding of this study. Fig. 4b shows the variation of plots of (F(R)hν)1/2 as a function of Eg (eV). The obtained direct band gap value of 3.28 eV carries important implications for the optical and electronic properties of the doped material. The incorporation of Ho ions into the material introduces energy levels associated with the 4f electron shell of Ho3+ ions. The specific electronic transitions within the 4f shell contribute to the observed band gap and influence the material's optical properties. The presence of rare earth ions like Ho is known to introduce complex energy-level structures, offering opportunities for tailored design in photonics and luminescence. The direct band gap value of 3.28 eV is of considerable significance and indicates that the doped material is a wide-band gap semiconductor. Wide-band gap materials typically have band gaps greater than 3 eV and are known for their suitability in applications where higher-energy photons, such as ultraviolet and blue light, are involved.43 This means that the material can absorb and emit light in the UV and visible regions of the electromagnetic spectrum.
3.4 Photoluminescence spectroscopy and radiative properties
Fig. 5a shows the holmium ion concentration-based excitation spectra of the Ca3(VO4)2 phosphors. The excitation spectra were observed at 545 nm, and exhibited some broad, double, and sharp bands in the UV and visible regions. In the UV region, the transitions are assigned as follows from the ground state: 5I8 to various excited states, 3H6 (361 nm), and 5G4 (382 nm). Similarly, in the visible region, 5G5 (420 nm), 5F1 (451 nm), 5G6 (458 nm) 3K8 (469 nm), 5F2 (476 nm), and 5F3 (500 nm).44 Of the five visible bands, a sharp and highly intense band was noticed at 451 nm (5I8 → 5F1); therefore, the transition wavelength (451 nm) was chosen for the investigation of visible emission spectra for various doping of Ho3+ in the calcium orthovanadate Ca3(VO4)2 phosphors. The emission spectra from various doping concentrations of Ho3+ in the calcium orthovanadate Ca3(VO4)2 phosphors were computed in the (500–750) nm range at a 451 nm excitation wavelength and are described in Fig. 5b. The spectra display three emission peaks, among them, a very weak peak around 506 nm, which is assigned to 5F3 → 5I8. There is another short peak in the red region at 650 nm (5F5 → 5I8).45–47 A third intense emission is in the green region at 545 nm and relates to the (5S2 + 5F4) → 5I8 transition.48 When excited at 451 nm, a non-radiative decay was observed from 5G5 to (5S2 + 5F4) and 5F5 levels, because of the tightly spaced higher energy levels. From these excitation levels, de-excitation leads to green emission. It has been observed that as the concentration of Ho3+ ion rises within the range (0.01 to 0.05) mol, the emission transition intensities exhibit a notable increase. However, when the concentration exceeds 0.05 mol, a critical turning point occurs, leading to a diminishing of emission intensities. This phenomenon is attributed to concentration quenching. Fig. 6 depicts the variation of emission intensity of the 5F3 → 5I8 transition as a function of the Ho3+ ions concentration. The observed luminescence quenching indicates that interactions and energy transfers occur among Ho3+ ions within various sites of the lattice, primarily through non-radiative relaxation processes. Normally, the excitation photon energy greatly depends on the concentration of Ho3+ ions and is exchanged between Ho–Ho ions. The increase in Ho3+ ion concentration leads to a shorter distance between the Ho–Ho ions, which promotes the non-radiative transfer of energy between them. Hence this leads to luminescence quenching, which often influences the luminescence efficiency of the Ho3+ phosphors. Fig. 7 presents the possible cross-relaxations in the Ho3+ doped phosphor with excitation and emission transitions. According to Blasse's model,49 the critical distance between Ho–Ho for energy transfer in the Ca3(VO4)2:0.05Ho3+ phosphor is estimated from the following expression:| |
 | (2) |
in which, V is the volume of the unit cell,  is the optimal ion concentration, and N is the number of Z ions per unit cell. In the present study, the critical distance Rc of 11.75 Å is obtained using the parameters, V = 3846.50 Å3,12 N = 21, and Xc = 0.05. The obtained Rc indicates that the non-radiative transfer of energy due to the resonance transfer between the Ho–Ho ions is efficient from the electric multipole–multipole interactions. On the other hand, the exchange interaction is inefficient (the multipole–multipole interaction is efficient) between Ho–Ho ions, since Rc is much greater than 5 Å.49
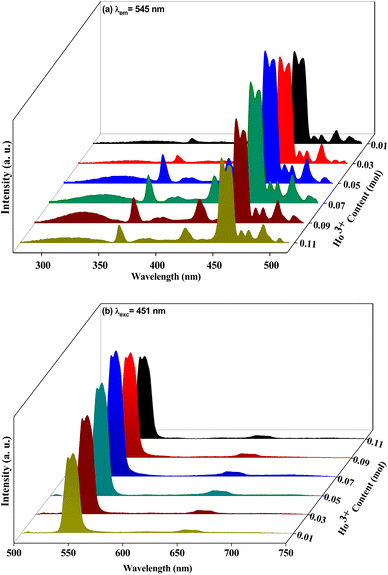 |
| | Fig. 5 Photoluminescence spectra of the Ca3(VO4)2:xHo3+ phosphor (a) excitation spectrum of Ca3(VO4)2:xHo3+ (λem = 545 nm) and (b) emission spectrum of Ca3(VO4)2:xHo3+ (λexc = 451 nm). | |
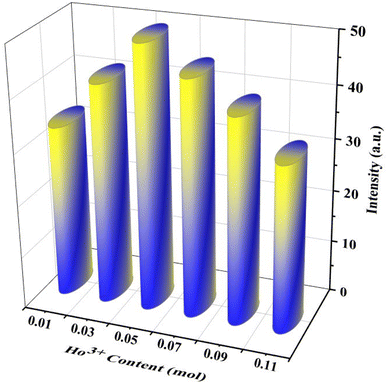 |
| | Fig. 6 Variation in the emission intensity of strong emission (545 nm) as a function of Ho3+ concentration. | |
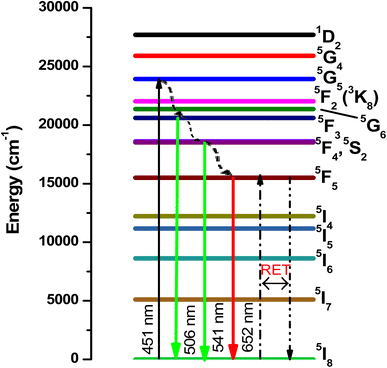 |
| | Fig. 7 Schematic energy level diagram for Ho3+ ions with possible radiative and non-radiative transitions with possible cross-relaxation. | |
It is known that dipole–dipole (d–d), dipole–quadrupole (d–q), and quadrupole–quadrupole (q–q) interactions are responsible for the transfer of energy between Ho–Ho ions, and therefore it is possible to identify the type of interaction with the measured emission intensity and ion concentration in the present study using the following formula:50
| |
 | (3) |
where,
K and
β are constants,
I is the intensity of emission at 506 nm,
x is the Ho
3+ ion concentration, and
Q indicates the multipolar character, where
Q = 6 for dipole–dipole (d–d),
Q = 8 for dipole–quadrupole (d–q), and
Q = 10 for quadrupole–quadrupole (q–q) interactions, respectively. The
Q can be obtained from the plot of log(
I/
x) as a function of log(
x) at 541 nm (
λexc = 451 nm), as shown in
Fig. 8. The variation between the log(
I/
x)
vs. log(
x) is linear, while the slope (−
Q/3) is found to be −1.02. The obtained
Q is 3.06, which is closer to 6, indicating that the resonance transfer of energy mechanism for the Ca
3(VO
4)
2:Ho
3+ phosphor is dipole–dipole interactions. Therefore, it can be inferred that the optimum concentration of Ho
3+ ions in the calcium orthovanadate (Ca
3(VO
4)
2) phosphors is around 0.05 mol.
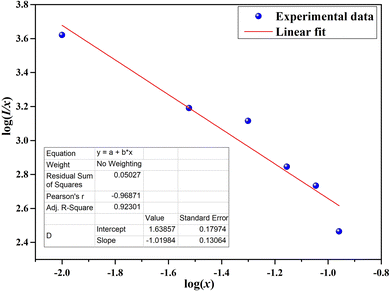 |
| | Fig. 8 Plot of log(I/x) as a function of log(x) of the Ca3(VO4)2:0.05Ho3+ phosphor. | |
According to ref. 51–54, using the photoluminescence excitation (PLE) spectrum of Ca3(VO4)2:0.05Ho3+ phosphor sample, the radiative properties, such as the radiative transition probabilities (AR), branching ratios (β), and radiative lifetimes (τR) for certain excited states of Ho3+, are estimated by applying the Judd–Ofelt theory.55,56 Based on the Judd–Ofelt (J–O) theory, the J–O intensity parameters Ωλ (λ = 2, 4, and 6) can be determined from the PLE spectrum by evaluating the measured and calculated spectral line strengths of excited 4f–4f electronic transitions using the least-square fit method. The relative expressions and theories for the measured and calculated spectral line strengths, radiative transition probabilities (AR), branching ratios (β), and radiative lifetimes (τR) are available elsewhere; therefore, we are presenting only the significant results. Table 2 shows the spectral line strengths for the observed excitation bands and Judd–Ofelt intensity parameters. The Ωλ parameters are important for the study of the local structure and bonding in the vicinity of rare earth ions. Peacock57 indicated that the Ω2 parameter is sensitive to both asymmetry and covalency at rare earth sites, while Oomen et al.58 observed that the rigidity or long-range effects of hosts were responsible for changes in Ω4 and Ω6. The obtained values of Ω2, Ω4, and Ω6 for the Ca3(VO4)2:0.05Ho3+ phosphor is (0.16, 0.17, and 0.36) × 10−20 cm2, respectively. The magnitude of Ω2 is comparable to that of the SrZrO3 (ref. 54) and Lu3Al5O12 (ref. 59) phosphors and has a higher covalency than the YAG60 host matrix.
Table 2 Doubly reduced matrix elements ∥U2∥λ (λ = 2, 4 and 6), relative line strengths and Judd–Ofelt intensity parameters for the observed excitation/absorption bands of Ho3+ doped Ca3(VO4)2:0.05Ho3+ phosphor
| Transitions |
Excitation band wavenumber (ν cm−1) |
∥U2∥2 |
∥U2∥4 |
∥U2∥6 |
Line strengths (×10−20 cm2) |
Judd–Ofet parameters (×10−20 cm2) |
| Sedmeas |
Sedcal |
Ω2 |
Ω4 |
Ω6 |
References |
| 5I8 → 3H6 + 3H5 |
27![[thin space (1/6-em)]](https://www.rsc.org/images/entities/char_2009.gif) 685 685 |
0.254 |
0.2337 |
0.1609 |
0.050 |
0.138 |
0.16 |
0.17 |
0.36 |
Present work |
| 5I8 →5G4 + 3K7 |
25![[thin space (1/6-em)]](https://www.rsc.org/images/entities/char_2009.gif) 846 846 |
0.0058 |
0.0361 |
0.0697 |
0.050 |
0.031 |
0.04 |
2.67 |
1.89 |
YAG60 |
| 5I8 → 5G5 |
23![[thin space (1/6-em)]](https://www.rsc.org/images/entities/char_2009.gif) 872 872 |
0 |
0.5338 |
0.0002 |
0.102 |
0.088 |
0.17 |
2.08 |
1.92 |
Lu3Al5O12 (ref. 59) |
| 5I8 → 5G6 |
22![[thin space (1/6-em)]](https://www.rsc.org/images/entities/char_2009.gif) 020 020 |
1.5201 |
0.8410 |
0.1535 |
0.441 |
0.426 |
1.16 |
1.38 |
0.88 |
LaF3 (ref. 61) |
| 5I8 → 5F2 + 3K8 |
21![[thin space (1/6-em)]](https://www.rsc.org/images/entities/char_2009.gif) 186 186 |
0.0208 |
0.0334 |
0.3576 |
0.132 |
0.138 |
0.41 |
0.16 |
0.19 |
SrZrO3 (ref. 54) |
| 5I8 → 5F3 |
20![[thin space (1/6-em)]](https://www.rsc.org/images/entities/char_2009.gif) 542 542 |
0 |
0 |
0.3464 |
0.162 |
0.125 |
1.01 |
1.71 |
1.21 |
LiYF4 (ref. 63) |
| δrms |
|
|
|
|
±0.161 |
|
|
|
|
Using Ωλ parameters, the emission properties, such as the radiative transition probabilities (Arad), radiative lifetimes (τrad), branching ratios (β), and emission cross-sections (σemi), for the observed emission transitions, 5S2 + 5F4 → 5I8 and 5F5 → 5I8, are calculated, and are reported in Table 3. The stimulated emission cross-section is an important feature for low threshold and high gain applications. The stimulated emission cross-section (σemi) can be determined using the formula:61
| |
 | (4) |
where,
λ is the emission peak wavelength, Δ
λeff is the effective line width,
c is the velocity of light,
n is the refractive index, and
Arad is the radiative transition probability of related emission transition that is calculated using the Judd–Ofelt theory. The emission cross-section, 1.60 × 10
−21 cm
2 at 541 nm for the Ca
3(VO
4)
2:0.05Ho
3+ phosphor, is lower than that of the Ho
3+:NaGd(WO
4)
2 crystal
62 and Ho
3+:LiYF
4 (ref.
63) at (2.70 and 8.0) × 10
−21 cm
2, respectively. The observed higher branching ratio (83.5%) and the reasonable emission-cross-section for the
5F
4 +
5S
2 →
5I
8 transition in the Ca
3(VO
4)
2:0.05Ho
3+ phosphor suggest that it is most useful for bright green emitting light for optoelectronic applications.
Table 3 Relative radiative properties such as spontaneous radiative transition probabilities (Arad), branching ratios (β) and radiative lifetimes, emission cross-sections for the emission transitions of Ca3(VO4)2:0.05Ho3+ phosphor
| Transition |
λ (nm) |
Arad (S−1) |
τrad (μs) |
β (%) |
σemi (cm2) |
| 5S2 + 5F4 → 5I8 |
541 |
1000.2 |
835 |
83.5 |
1.6 × 10⁻²¹ |
| 5F5 → 5I8 |
651 |
447.8 |
1642 |
73.5 |
0.3 × 10⁻²¹ |
3.5 Color coordinates and color purity analysis
The emission color and color purity of the synthesized Ca3(VO4)2:Ho3+ powders were determined by assessing their coordinates on the Commission Internationale de L'Eclairage (CIE) chromaticity diagram. Fig. 9 shows the CIE diagram for all the Ho3+-doped Ca3(VO4)2 samples, while Table 4 presents the specific CIE coordinates of Ca3(VO4)2:Ho3+, along with the color purity and CCT. It is worth noting that in all cases, the CIE coordinates for these samples consistently fall within the green region. The color purity of the synthesized phosphors is also an important characteristic, and another important parameter that can be calculated by the following formula:64,65| |
 | (5) |
where, (x, y) = sample point coordinates, (xd, yd) = (0.251, 0.737) at the dominant wavelength coordinates, and (xi (0.2815), yi (0.2971)) are the coordinates of the illuminant point. The color purity values of all the Ho3+-doped samples are also found to be in good agreement at around 67%. The Ca3(VO4)2:Ho3+ phosphor is suggested as an excellent candidate for use as the green-emitting component in white LED (w-LED) applications. The correlated color temperature (CCT) of the inorganic phosphor can be estimated using eqn (6):66| | |
CCT = −437n3 + 3601n2 − 6861n + 5514.31
| (6) |
where, with xe being equal to 0.3320, and ye being equal to 0.1858.67 The estimated CCT value for the inorganic phosphors lies in the range (5863–6079) K, which suggests that the phosphor is suitable for a work environment where bright illumination is needed. In w-LEDs, a combination of different phosphors is used to create white light, and having a high-quality green-emitting component is crucial to achieving a balanced and full-spectrum white light output.
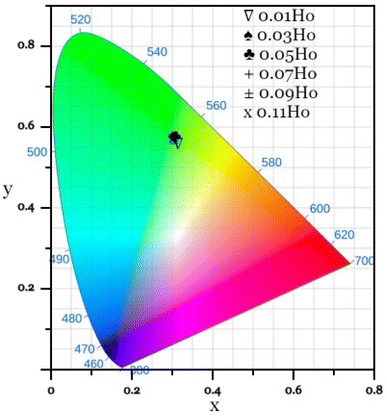 |
| | Fig. 9 CIE chromaticity diagram for Ca3(VO4)2:Ho3+ phosphor. | |
Table 4 CIE coordinates, color purity and CCT of Ca3(VO4)2:xHo3+ phosphor
| S. no. |
Ho3+ content (mol) |
x |
y |
Color purity (%) |
CCT (K) |
| 1 |
0.01 |
0.314 |
0.557 |
59.34 |
5863 |
| 2 |
0.03 |
0.301 |
0.578 |
63.81 |
6079 |
| 3 |
0.05 |
0.306 |
0.577 |
67.68 |
5994 |
| 4 |
0.07 |
0.305 |
0.576 |
67.42 |
6002 |
| 5 |
0.09 |
0.303 |
0.570 |
65.95 |
6056 |
| 6 |
0.11 |
0.303 |
0.574 |
66.91 |
6055 |
4. Conclusion
The investigation of a synthesized phosphor sample, calcium vanadate Ca3(VO4)2, doped with varying concentrations of Ho3+ ions, has yielded valuable insights into its optical properties and potential applications. The synthesis of these phosphors via a sol–gel procedure resulted in well-crystallized powders, ensuring the structural integrity of the material. The discovery of a partial porous structure within the developed phosphors, as revealed by SEM images, adds an intriguing dimension to their potential uses. Under excitation at 451 nm, we observed three emission peaks at around 506 nm (5F3 → 5I8), 545 nm (5S2 + 5F4) → 5I8, and 651 nm (5F5 → 5I8). Notably, the study identified a critical dopant concentration (0.05 mol) where quenching of Ho3+ emission occurs, likely due to the formation of dopant-ion clusters at higher concentrations. This observation underscores the importance of carefully controlling the dopant levels for optimal performance. The Judd–Ofelt intensity parameters were calculated from the excitation bands, and for Ω2, Ω4, and Ω6 are (0.16, 0.17 and 0.36) × 10−20 cm2, respectively. Furthermore, evaluation of the CIE chromaticity coordinates allowed for in-depth analysis of the color purity of the Ca3(VO4)2:Ho3+ phosphor emission. The present investigation on calcium vanadate-based phosphors doped with Ho3+ provides valuable insights into their potential use as green light-emitting materials in solid-state lighting technology. The well-crystallized structures, controllable dopant concentrations, and specific emission properties of these phosphors make them promising for future lighting and display technologies. Further research and practical applications are now possible based on the preliminary results presented.
Conflicts of interest
There are no conflicts to declare.
Acknowledgements
This work was supported by the National Research Foundation of Korea (NRF) grant funded by the Korea government (MSIT) (No. 2021R1A2C1092509). This paper was supported by the KU Research Professor Program of Konkuk University.
References
- G. B. Nair, H. C. Swart and S. Dhoble, Prog. Mater. Sci., 2020, 109, 100622–100658 CrossRef CAS.
- M. D. Mehare, C. M. Mehare, H. C. Swart and S. J. Dhoble, Prog. Mater. Sci., 2022, 133, 101067–101119 CrossRef.
- H. Lin, T. Hu, Y. Cheng, M. Chen and Y. Wang, Laser Photonics Rev., 2018, 12, 1700344–1700375 CrossRef.
- S. Aralekallu, R. Boddula and V. Singh, Mater. Des., 2023, 225, 111517–111550 CrossRef CAS.
- M. H. Fang, Z. Bao, W. T. Huang and R. S. Liu, Chem. Rev., 2022, 122, 11474–11513 CrossRef CAS PubMed.
- H. Terraschke and C. Wickleder, UV, blue, green, yellow, red, and small: newest developments on Eu2+ doped nanophosphors, Chem. Rev., 2015, 115, 11352–11378 CrossRef CAS PubMed.
- M. Akhtar, G. Anderson, R. Zhao, A. Alruqi, J. E. Mroczkowska, G. Sumanasekera and J. B. Jasinski, npj 2D Mater. Appl., 2017, 1, 5–18 CrossRef.
- W. P. Lustig, S. Mukherjee, N. D. Rudd, A. V. Desai, J. Li and S. K. Ghosh, Chem. Soc. Rev., 2017, 46, 3242–3285 RSC.
- M. Sharma, P. Singh, S. K. Singh and P. Singh, Opt. Mater., 2022, 133, 112925–112937 CrossRef CAS.
- L. Wu, P. Dai and D. Wen, ACS Sustain. Chem. Eng., 2022, 10, 3757–3765 CrossRef CAS.
- Q. Tang, K. Qiu, W. Zhang, Y. Shen and J. Wang, Opt. Mater., 2018, 75, 258–267 CrossRef CAS.
- V. Singh, M. Seshadri, M. S. Pathak and N. Singh, Spectrochim. Acta, Part A, 2019, 217, 315–321 CrossRef CAS PubMed.
- Z. Chen, D. Wang, L. Liu, F. Yuan, Y. Huang, L. Zhang and Z. Lin, J. Alloys Compd., 2023, 938, 168651–168658 CrossRef CAS.
- L. Jing, X. Liu, Y. Li and Y. Wang, J. Lumin., 2015, 162, 185–190 CrossRef CAS.
- A. K. Bedyal, V. Kumar and H. C. Swart, J. Alloys Compd., 2017, 709, 362–372 CrossRef CAS.
- H. M. Yang, J. X. Shi, H. B. Liang and M. L. Gong, Mater. Res. Bull., 2006, 41, 867–872 CrossRef CAS.
- L. Sun, J. Yao, C. Liu, C. Liao and C. Yan, J. Lumin., 2000, 87, 447–450 CrossRef.
- X. Huang, B. Li and H. Guo, J. Alloys Compd., 2017, 695, 2773–2780 CrossRef CAS.
- B. G. Zhai and Y. M. Huang, J. Mater. Sci., 2017, 52, 1813–1822 CrossRef CAS.
- G. M. Kuz’micheva, L. I. Ivleva, I. A. Kaurova, E. V. Khuramov, V. B. Rybakov and M. E. Doroshenko, J. Alloys Compd., 2021, 854, 155918–155928 CrossRef.
- I. S. Voronina, V. V. Voronov, E. E. Dunaeva, L. D. Iskhakova, A. G. Papashvili, M. E. Doroshenko and L. I. Ivleva, J. Cryst. Growth, 2021, 555, 125965–125972 CrossRef CAS.
- G. M. Kuz’micheva, L. I. Ivleva, I. A. Kaurova, E. V. Khramov, V. B. Rybakov and M. E. Doroshenko, Mater. Res. Bull., 2021, 140, 111300–111311 CrossRef.
- L. I. Ivleva, E. E. Dunaeva, I. S. Voronina, M. E. Doroshenko, A. G. Papashvili, J. Sulc, J. Kratochvíl and H. Jelinkova, J. Cryst. Growth, 2019, 513, 10–14 CrossRef CAS.
- K. Qiu, J. Li, J. Li, X. Lu, Y. Gong and J. Li, J. Mater. Sci., 2010, 45, 5456–5462 CrossRef CAS.
- H. Y. Lin, W. F. Chang and S. Y. Chu, J. Lumin., 2013, 133, 194–199 CrossRef CAS.
- A. A. Bhat, S. A. Khandy, A. M. Ali and R. Tomar, J. Phys. Chem. Lett., 2023, 14, 5004–5012 CrossRef CAS PubMed.
- A. A. Bhat and R. Tomar, J. Alloys Compd., 2021, 876, 160043–160052 CrossRef CAS.
- H. Zhang, M. Lü, Z. Xiu, S. Wang, G. Zhou, Y. Zhou, S. Wang, Z. Qiu and A. Zhang, Mater. Res. Bull., 2007, 42, 1145–1152 CrossRef CAS.
- V. Singh, S. Kaur and M. Jayasimhadri, Solid State Sci., 2020, 101, 106049–106054 CrossRef CAS.
- V. Singh, S. Kaur, C. B. A. Devi, A. S. Rao and J. B. Joo, Optik, 2022, 266, 169553–169562 CrossRef CAS.
- J. K. Lee, A. Nande, A. A. Bhat, S. Watanabe, T. G. Rao and V. Singh, Ceram. Int., 2024, 50, 17063–17074 CrossRef CAS.
- V. Chauhan, P. K. Pandey, P. Dixit and P. C. Pandey, Mater. Today: Proc., 2022, 67, 605–608 CAS.
- L. Li, Y. Pan, W. Wang, W. Zhang, Z. Wen, X. Leng and X. Liu, J. Alloys Compd., 2017, 726, 121–131 CrossRef CAS.
- A. A. Bhat, S. A. Khandy, I. Islam and R. Tomar, Sci. Rep., 2021, 11, 16473–16485 CrossRef CAS PubMed.
- V. Rajalingam, Synthesis and Characterization of BiVO4 nanostructured materials: application to photocatalysis, Doctoral dissertation, Université du Maine, 2014.
- M. A. Zaitoun, D. M. Goken, L. S. Bailey, T. Kim and C. T. Lin, J. Phys. Chem. B, 2000, 104, 189–196 CrossRef CAS.
- K. Nakanishi, R. Takahashi, T. Nagakane, K. Kitayama, N. Koheiya, H. Shikata and N. Soga, J. Sol-Gel Sci. Technol., 2000, 17, 191–210 CrossRef CAS.
- G. S. Grader, Y. De Hazan, D. Bravo-Zhivotovskii and G. E. Shter, J. Sol-Gel Sci. Technol., 1997, 10, 127–137 CrossRef CAS.
- N. Job, A. Théry, R. Pirard, J. Marien, L. Kocon, J. N. Rouzaud, F. Béguin and J. P. Pirard, Carbon, 2005, 43, 2481–2494 CrossRef CAS.
- V. Singh, G. Lakshminarayana, A. Wagh and N. Singh, Optik, 2020, 207, 164284–164290 CrossRef CAS.
- C. S. Rao, K. U. Kumar, P. Babu and C. K. Jayasankar, Opt. Mater., 2012, 35, 102–107 CrossRef.
- V. Singh, N. Singh, M. S. Pathak, P. K. Singh and V. Natarajan, Optik, 2018, 171, 356–362 CrossRef CAS.
- A. A. Bhat, N. Singh, R. V. Nair, E. Dujardin and J. Sharma, Opt. Mater., 2023, 141, 113937–113943 CrossRef CAS.
- S. Babu, M. Seshadri, A. Balakrishna, V. R. Prasad and Y. C. Ratnakaram, Phys. Rev. B: Condens. Matter Mater. Phys., 2015, 479, 26–34 CrossRef CAS.
- A. Dwivedi, A. K. Singh and S. B. Rai, Dalton Trans., 2014, 43, 15906–15914 RSC.
- T. Li, C. Guo, H. Suo and P. Zhao, J. Mater. Chem. C, 2016, 4, 1964–1971 RSC.
- A. Li, R. Lu, Y. Zhao, J. Yang, J. Wang and G. Zhao, J. Lumin., 2022, 248, 118962–118967 CrossRef CAS.
- D. K. Sardar, S. R. Chandrasekharan, K. L. Nash, J. B. Gruber, A. Burger and U. N. Roy, J. Appl. Phys., 2008, 103, 093112–093120 CrossRef.
- G. Blasse, J. Electrochem. Soc., 1968, 115, 738–742 CrossRef CAS.
- D. L. Dexter and J. H. Schulman, J. Chem. Phys., 1954, 22, 1063–1070 CrossRef CAS.
- W. Luo, J. Liao, R. Li and X. Chen, Phys. Chem. Chem. Phys., 2010, 12, 3276–3282 RSC.
- S. Dutta, S. Som and S. K. Sharma, RSC Adv., 2015, 5, 7380–7387 RSC.
- V. Singh, M. Seshadri, D. Taikar, S. J. Dhoble and R. S. Yadav, RSC Adv., 2023, 13, 3592–3601 RSC.
- V. Singh and M. Seshadri, RSC Adv., 2023, 13, 27782–27791 RSC.
- B. R. Judd, Phys. Rev., 1962, 127, 750–761 CrossRef CAS.
- G. S. Ofelt, J. Chem. Phys., 1962, 37, 511–520 CrossRef CAS.
- R. D. Peacock, Struct. Bonding, 1975, 22, 83–122 CrossRef CAS.
- E. W. J. L. Oomen and A. M. A. van Dongen, J. Non-Cryst. Solids, 1989, 111, 205–213 CrossRef CAS.
- D. N. Patel, B. R. Reddy and S. K. Nash-Stevenson, Opt. Mater., 1998, 10, 225–234 CrossRef CAS.
- M. Malinowski, Z. Frukacz, M. Szuflinskaa, A. Wnuk and M. Kaczkan, J. Alloys Compd., 2000, 300, 389–394 CrossRef.
- M. J. Weber, B. H. Matsinger, V. L. Dolan and G. Surratt, J. Chem. Phys., 1972, 57, 562 CrossRef CAS.
- H. Wang, J. Li, G. Jia, Z. You, F. Yang, Y. Wei, Y. Wang, Z. Zhu, X. Lu and C. Tu, J. Alloys Compd., 2007, 431, 277–281 CrossRef CAS.
- B. M. Walsh, G. W. Grew and N. P. Barnes, J. Phys.: Condens.Matter, 2005, 17, 7643–7665 CrossRef CAS.
- A. A. Bhat, I. Assadullah, A. Farooq, K. A. Malik, J. H. Malik, R. Tomar, I. Islam, A. M. Ali and S. A. Khandy, Mater. Chem. Phys., 2023, 306, 127993–128000 CrossRef CAS.
- M. Seshadri, L. C. Barbosa and M. Radha, J. Non-Cryst. Solids, 2014, 406, 62–72 CrossRef CAS.
- L. Wang, S. Jilili, A. Tuerxun, A. Sidike and Q. Wang, Jpn. J. Appl. Phys., 2022, 61, 062002–062009 CrossRef CAS.
- Y. Li, J. Chen and C. Chen, Optik, 2018, 174, 1–6 CrossRef CAS.
|
| This journal is © The Royal Society of Chemistry 2024 |
Click here to see how this site uses Cookies. View our privacy policy here.  Open Access Article
 *a,
Aadil Ahmad Bhata,
M. Radhab,
M. Seshadric,
Sooraj H. Nandyalad and
Ji Bong Jooa
![[thin space (1/6-em)]](https://www.rsc.org/images/entities/char_2009.gif) :
:![[thin space (1/6-em)]](https://www.rsc.org/images/entities/char_2009.gif) 1 with metal ion), are mixed in a 150 mL glass beaker with 10 mL of deionized water. This step is key, as it initiates the formation of a sol, which is a colloidal suspension of solid particles in a liquid. The mixture is agitated at 500 rpm for up to 1 hour. During this time, the reagents react, and a yellow liquified solution is formed, ensuring a homogenous product is formed. Citric acid plays a key role in this process as a chelating agent, helping to control the gel formation. After stirring for one hour, the solution is transferred into the oven at 110 °C overnight. This step is important for removing the liquid component and forming a gel. The solution gradually transforms into a gel, which is a three-dimensional network of solid particles held within the liquid medium. The choice of 110 °C temperature and the duration of heating are crucial parameters for controlling the gel formation process. The dry gels obtained from the previous step are sintered at 400 °C for 120 min in the presence of air in a muffle furnace. The specific sintering temperature and duration are carefully selected to ensure that the desired phase is obtained. The last step involves further heating the resultant black powder samples in air at a higher temperature of 800 °C for 2 h in a muffle furnace. This additional heat treatment is likely to optimize the phosphor's properties. It could be necessary to enhance its luminescent characteristics and ensure the formation of the desired crystal structure. A series of Ca3(VO4)2:xHo3+ (0.01 ≤ x ≤ 0.11) phosphors were synthesized by this approach to understand the impact of Ho3+ on the crystal lattice of Ca3(VO4)2.
1 with metal ion), are mixed in a 150 mL glass beaker with 10 mL of deionized water. This step is key, as it initiates the formation of a sol, which is a colloidal suspension of solid particles in a liquid. The mixture is agitated at 500 rpm for up to 1 hour. During this time, the reagents react, and a yellow liquified solution is formed, ensuring a homogenous product is formed. Citric acid plays a key role in this process as a chelating agent, helping to control the gel formation. After stirring for one hour, the solution is transferred into the oven at 110 °C overnight. This step is important for removing the liquid component and forming a gel. The solution gradually transforms into a gel, which is a three-dimensional network of solid particles held within the liquid medium. The choice of 110 °C temperature and the duration of heating are crucial parameters for controlling the gel formation process. The dry gels obtained from the previous step are sintered at 400 °C for 120 min in the presence of air in a muffle furnace. The specific sintering temperature and duration are carefully selected to ensure that the desired phase is obtained. The last step involves further heating the resultant black powder samples in air at a higher temperature of 800 °C for 2 h in a muffle furnace. This additional heat treatment is likely to optimize the phosphor's properties. It could be necessary to enhance its luminescent characteristics and ensure the formation of the desired crystal structure. A series of Ca3(VO4)2:xHo3+ (0.01 ≤ x ≤ 0.11) phosphors were synthesized by this approach to understand the impact of Ho3+ on the crystal lattice of Ca3(VO4)2.
![[thin space (1/6-em)]](https://www.rsc.org/images/entities/char_2009.gif) cos
cos![[thin space (1/6-em)]](https://www.rsc.org/images/entities/char_2009.gif) θ
θ


 is the optimal ion concentration, and N is the number of Z ions per unit cell. In the present study, the critical distance Rc of 11.75 Å is obtained using the parameters, V = 3846.50 Å3,12 N = 21, and Xc = 0.05. The obtained Rc indicates that the non-radiative transfer of energy due to the resonance transfer between the Ho–Ho ions is efficient from the electric multipole–multipole interactions. On the other hand, the exchange interaction is inefficient (the multipole–multipole interaction is efficient) between Ho–Ho ions, since Rc is much greater than 5 Å.49


![[thin space (1/6-em)]](https://www.rsc.org/images/entities/char_2009.gif) 685
685![[thin space (1/6-em)]](https://www.rsc.org/images/entities/char_2009.gif) 846
846![[thin space (1/6-em)]](https://www.rsc.org/images/entities/char_2009.gif) 872
872![[thin space (1/6-em)]](https://www.rsc.org/images/entities/char_2009.gif) 020
020![[thin space (1/6-em)]](https://www.rsc.org/images/entities/char_2009.gif) 186
186![[thin space (1/6-em)]](https://www.rsc.org/images/entities/char_2009.gif) 542
542


