 Open Access Article
Creative Commons Attribution 3.0 Unported Licence
A novel fluorescent probe with a phosphofluorene molecular structure for selective detection of hydrogen sulfide in living cells†
Shuntao Zhang,
Xingyong Liu,
Xiangjun Chen,
Jiefeng Tang and
Juan Wang *
*
College of Chemical Engineering, Sichuan University of Science & Engineering, Zigong 643000, China. E-mail: wangjuan2022@suse.edu.cn
First published on 2nd July 2024
Abstract
Hydrogen sulfide (H2S) gas plays a significant role in biological regulation. With advancements in technology, H2S has been discovered across diverse fields, necessitating a comprehensive understanding of its physiological functions through monitoring changes in H2S within complex environments and physiological processes. In this study, we designed a phosphofluorene-based conjugate probe PPF-CDNB with an asymmetric π-conjugated phosphine structure and utilized dinitrophenyl ether as the recognition site for H2S. PPF-CDNB exhibited exceptional resistance to interference and demonstrated stability over a broad pH range (3.0–10.0), making it suitable for various environmental conditions. Intracellular experiments revealed that PPF-CDNB effectively monitored both endogenous and exogenous levels of H2S.
1 Introduction
Hydrogen sulfide (H2S) is a gaseous compound characterized by an unpleasant odor reminiscent of rotten eggs. It is frequently encountered in heavy industrial processes, such as metal smelting and coal mining, as well as during the prolonged decay and fermentation of organic matter.1–4 H2S can induce sensory discomfort, stimulate the nervous system, and in severe cases lead to poisoning or even rapid death.5–7 Functioning as a signaling molecule, H2S plays a pivotal role in several crucial physiological processes including blood pressure regulation, nerve conduction, and oxidative stress inhibition.8–10 Elevated levels of H2S have been associated with various conditions including Alzheimer's disease, Down syndrome, Parkinson's disease, and diabetes.11,12 Hydrogen sulfide represents a bioactive molecule that assumes critical regulatory functions within biological systems.13,14 However, aberrant levels of H2S are closely associated with functional impairments and various diseases, prompting active development of small molecule chemical tools for investigating its diverse roles in biology and medicine.15 In addition to its lethal effects, H2S also modulates a wide range of physiological actions including vasodilation, anti-inflammatory effects, insulin release, neurotransmission, antioxidant properties, anti-apoptotic effects, and neuroprotection.16 Notably, H2S triggers S-sulfhydration of Keap1, activating Nrf2 and facilitating its nuclear translocation, which results in the production of antioxidant proteins.17 Numerous studies have demonstrated that H2S ranks as the third most crucial signaling molecule in organisms following CO and NO.18,19 Conventional methods for H2S detection, including electrochemical analysis, methylene blue assay, colorimetric assay, spectrophotometry, and chromatography, are often time-consuming and labor-intensive, limiting their effectiveness in providing accurate and efficient qualitative and quantitative analysis of H2S in cells.20–22 Thus, there is a pressing need for simple and rapid detection methods to measure H2S concentration accurately in various environments, including water phase, gas phase, and living cells (both exogenous and endogenous). Among the available detection methods, the fluorescence probe detection method has gained significant attention due to its high sensitivity, selectivity, cost-effectiveness, ease of operation, and real-time determination.In our study, we utilized the phosphofluorene (PPF) structure as the probe fluorophores.23–26 PPF, also known as dibenzo phosphocyclopentadiene, features a robust ring structure composed of two benzene rings and a phosphocyclopentadiene core.27–31 Similar to fluorene, PPF exhibits a wide energy gap, and its fluorescence spectrum is predominantly observed in the ultraviolet region (366 nm).32,33 The presence of two lateral benzene rings in PPF provides the system with several advantages over monocyclic phosphoheterocycles in binding molecular electronics.34,35 The synthesis and operation of the tricyclic system can modulate the overall electronic structure through the introduction and manipulation of benzene ring substituents.36,37 PPF exhibits excellent fluorescence and its rigid configuration ensures a high photoluminescence quantum yield.38–41 Despite these advantages, the use of PPF structures in fluorescent probes is relatively uncommon. Most commercially available H2S fluorescent probes rely on reduction and nucleophilic reactions for detection, which suffer from slow reaction rates leading to inefficient detection processes lasting tens of minutes or even hours. For instance, Kim's group designed the fluorescent probe BT-ITC, which showed emission at 447 nm and had a response time of 40 min to H2S.42 Fang's group designed the fluorescent probe Mito-GW, which has a response time of 80 min to H2S and displays emission at 447 nm.43 Zhong's group designed a fluorescent probe, THQ-L, that displayed emission at 650 nm with a response time of 45 min to H2S.44 While these results contribute to the advancement of fluorescent probes, they also have limitations, notably long response times (exceeding 20 minutes). Therefore, there is a critical need to design a fluorescent probe with rapid response, high selectivity, and sensitivity to H2S detection. In response to this need, we designed and synthesized a fluorescent probe, PPF-CDNB. The phosphomfluorene derivative of the probe was used as a fluorophore, while 2,4-dinitrophenyl was employed as a functional recognition group. PPF-CDNB exhibits a wide pH range (3.0–10.0), excellent sensitivity (LOD = 150 nM), and high selectivity for H2S detection, minimizing potential interference. Thus, PPF-CDNB offers a fast and efficient method for detecting H2S.
2 Experimental
2.1 Instruments and reagents
All reagents and solvents were purchased from commercial suppliers and used without further purification. Distilled water was utilized in the experiment after passing through a water superpurification system. Silica column chromatography was conducted using 200–300 mesh silica and an appropriate solvent. The reaction progress was monitored by thin-layer chromatography (TLC), and the reaction components were visualized using UV light. Fluorescence spectra and relative fluorescence intensities were measured using the Shimadzu RF-5301 fluorescence spectrometer. The excitation wavelength for all fluorescence measurements was 294 nm, with excitation and emission slit widths set to 2.5 nm. Ultraviolet-visible spectroscopy was performed using the Shimadzu UV-2700 spectrophotometer. The 1H-NMR and 13C-NMR spectra were recorded on the BRUKER600 spectrometer. pH measurements were conducted using a PHS-3C pH meter. Electrospray mass spectrometry (ESI-MS) data were acquired using the Agilent 1100 series instrument. Cell images were captured using a fluorescence microscope (Leica, Germany).2.2 Synthesis of probe PPF-CDNB
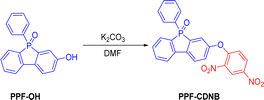
PPF-OH (200 mg, 0.68 mmol) and 2,4-dinitrophenyl chloride (166.4 mg, 0.82 mmol) were dissolved in 7 mL DMF and added to a round-bottom flask. Potassium carbonate (141 mg, 1.03 mmol) was then added, and stirred at 100 °C for 6 h. After the reaction, the mixture was extracted with ethyl acetate, and the ethyl acetate extract was passed through a column. The column was eluted with a mixture of ethyl acetate and petroleum ether to yield a yellow solid compound, PPF-CDNB (267 mg, 85.6%) (Fig. 1). 1H-NMR (600 MHz, CDCl3) δ 8.78 (d, J = 2.7 Hz, 1H), 8.28 (dd, J = 9.2, 2.7 Hz, 1H), 7.86 (dd, J = 8.4, 3.2 Hz, 1H), 7.78 (dd, J = 7.7, 2.8 Hz, 1H), 7.68 (dd, J = 9.8, 7.6 Hz, 1H), 7.57 (dt, J = 8.2,4.4 Hz, 4H), 7.47 (td, J = 7.4, 1.2 Hz, 1H), 7.41–7.34 (m, 5H), 7.29 (dd, J = 8.4, 2.2 Hz, 1H), 7.06 (d, J = 9.2 Hz, 1H). 13C-NMR (150 MHz, CDCl3) δ 154.04, 153.69, 153.59, 141.05, 139.68, 139.55, 138.81, 138.67, 132.88, 131.74, 130.04, 129.96, 129.28, 129.22, 128.85, 128.78, 128.05, 128.03, 127.94, 124.30, 122.44 (d, J = 11.5 Hz), 121.20, 120.36 (d, J = 10.0 Hz). HRMS (ESI): C24H15N2O6NaP for [M + Na]+, calculated 481.0565, found 481.0570.2.3 Fluorometric measurements
To further investigate the performance of the probe, spectral experiments were conducted. Initially, a detection solution was prepared by weighing an appropriate amount of probe PPF-CDNB and dissolving it in DMF solution to create a 1 mM stock solution. Subsequently, 100 μL of the probe stock solution was added to a volumetric flask containing PBS/DMF (v/v = 9![[thin space (1/6-em)]](https://www.rsc.org/images/entities/char_2009.gif) :
:![[thin space (1/6-em)]](https://www.rsc.org/images/entities/char_2009.gif) 1, pH = 7.4) buffer solution to achieve a concentration of 20 μM. Spectral measurements were then conducted in both the presence and absence of analytes Typically, the reaction between probe PPF-CDNB and NaHS occurs within the PBS/DMF (v/v = 9
1, pH = 7.4) buffer solution to achieve a concentration of 20 μM. Spectral measurements were then conducted in both the presence and absence of analytes Typically, the reaction between probe PPF-CDNB and NaHS occurs within the PBS/DMF (v/v = 9![[thin space (1/6-em)]](https://www.rsc.org/images/entities/char_2009.gif) :
:![[thin space (1/6-em)]](https://www.rsc.org/images/entities/char_2009.gif) 1, pH = 7.4) system followed by measuring the fluorescence intensity at 528 nm in the reaction solution.
1, pH = 7.4) system followed by measuring the fluorescence intensity at 528 nm in the reaction solution.
2.4 Selectivity and specificity
The probe stock solution (100 μL) was prepared in DMF. Various test substances (K+, Cu+, Ca2+, Na+, I−, F−, Cl−, CO32−, HCO3−, S2O82−, HSO4−, HSO3−, SCN−, S2O32−, S2O52−, SO32−, NO2−, L-Cys, D-Cys, GSH, Zn2+) were prepared in distilled water. All anions are prepared from their sodium salts, and all cations are prepared from their chloride salts. The resulting solution was stored at room temperature (25 °C), and then the fluorescence spectrum was recorded.2.5 Cell cultures and imaging
For exogenous imaging, A549 cells were incubated with PPF-CDNB (10 μM) at 37 °C for 30 minutes and then cultured with NaHS (50 μM) for 30 minutes. For endogenous imaging, the A549 cells were divided into three plates. One plate was incubated with cysteine (Cys, 50 μM) and PPF-CDNB (10 μM) for 30 minutes. The second plate was incubated with DL-propyl glycine (PAG, 100 μM) and PPF-CDNB (10 μM) for 30 min, and the third plate was incubated with DL-propyl glycine (PPG, 100 μM), cysteine (Cys, 50 μM) and PPF-CDNB (10 μM) for 30 min. The images were obtained under a fluorescence microscope.3 Discussion and experimental
3.1 Design idea
PPF and its derivatives have demonstrated strong fluorescence properties.45,46 This probe introduces 2,4-dinitrophenyl ether with dual functions: (a) inhibition of the intramolecular charge transfer (ICT) process of the fluorophores of PPF derivatives; (b) serving as a recognition site for H2S. By combining the ICT of the PPF derivative with the signal reporter mechanism of photoinduced electron transfer, we designed and synthesized a diaryl ether struct-based probe PPF-CDNB. The PPF-CDNB probe utilizes phosphofluorenine as the luminescence group, connected by a simple and rigid π-conjugated structure to the hydroxyl group of the electron donor group. It exhibits typical ICT luminescence characteristics, excellent photostability and high fluorescence quantum yield. The 2,4-dinitrophenyl ether group in the probe molecule serves as a potent electron-absorbing moiety, capable of quenching the fluorescence of the luminescent group via a photoinduced electron transfer process. The dinitrophenyl ether functions as the recognition site for H2S. Upon encountering H2S, a thiolysis reaction occurs, blocking the PET process and leading to the recovery of fluorescence from the fluorophore. This results in a reactive H2S fluorescent probe with significantly enhanced fluorescence.3.2 Photophysical properties of the PPF-CDNB probe
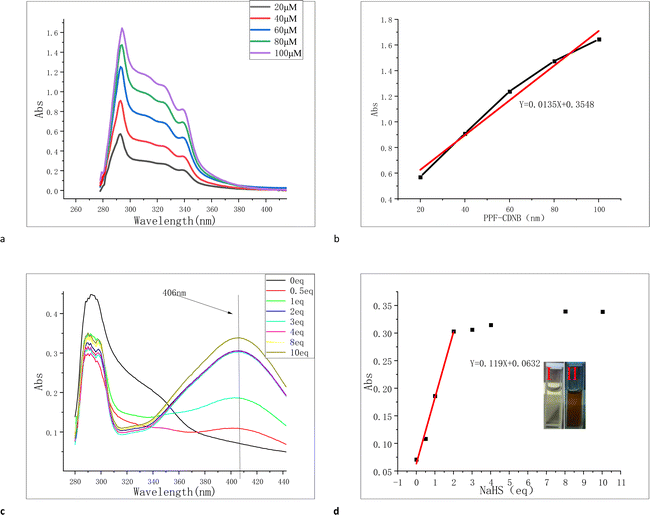
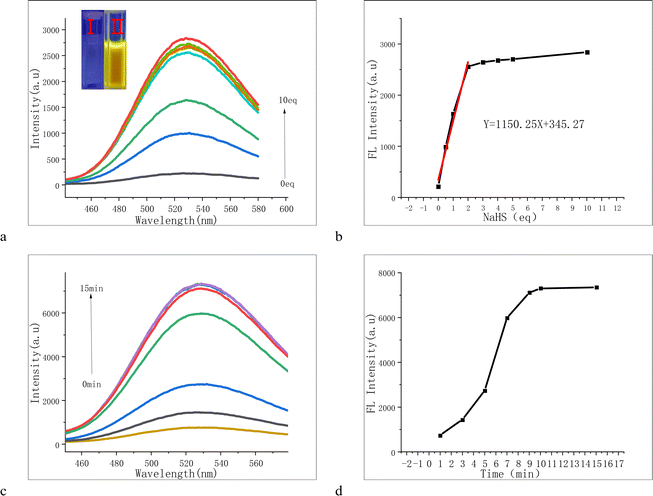
For probe PPF-CDNB, 10% DMF was added to PBS buffer solution to enhance its solubility and fluorescence (Fig. S1†). We investigated the interaction of probe PPF-CDNB (20 μM) with H2S in a PBS/DMF (V/V = 9/1, pH 7.4) system by UV absorption spectroscopy. As shown in the Fig. 2, the maximum UV absorption of PPF-CDNB probe is located at 294 nm. By increasing the concentration of PPF-CDNB probe (20–100 μM) (Fig. 2a), the absorbance coefficient at 294 nm increases linearly, according to the linear regression equation (R2 = 0.975) (Fig. 2b). When the PPF-CDNB probe concentration was 20 μM, the absorbance at 294 nm was obviously decreased and the UV absorbance at 406 nm was significantly increased by adding NaHS solution (0–10 eq.) (Fig. 2c). The color of the solution changed from colorless (Fig. 2d(I)) to brown-yellow (Fig. 2d(II)), and new compounds were formed.3.3 Effect of pH on H2S recognition by the PPF-CDNB probe
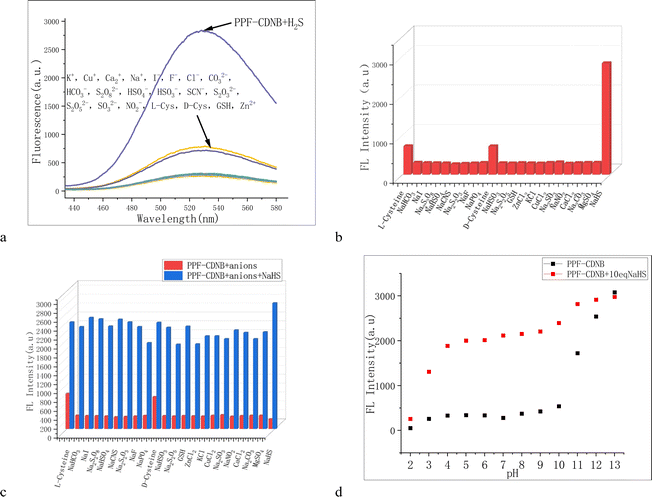
For successful bioluminescence imaging, the PPF-CDNB probe must be activated within the appropriate physiological pH range to investigate the effects of different pH conditions on its performance (Fig. 3d). It was observed that the PPF-CDNB probe was basically unaffected by pH in the pH range of 4.0–10.0. However, upon addition of H2S, the fluorescence intensity of the PPF-CDNB probe at 528 nm significantly increased. Within the pH range of 1.0–4.0, as the acidity increases, the fluorescence intensity of both PPF-CDNB probe and PPF-CDNB probe with H2S significantly decreases (Fig. S2†). It is speculated that the structure of the PPF of the PPF-CDNB probe is disrupted, which disrupts the ESIPT process in the PPF fluorophore. In contrast, within the pH range of 10.0–13.0, the fluorescence intensity of both the PPF-CDNB probe and the PPF-CDNB probe with H2S increased significantly with increasing alkalinity (Fig. S2†). It is speculated that disruption in the structure of the 2,4-dinitrophenyl ether moiety blocked the PET process, leading to restoration of fluorophore fluorescence. These findings indicate that the probe's response to H2S spans across acidic and alkaline conditions, enabling its applicability in various environments such as water phase, gas phase, and live cell measurements. This broad response range enhances its utility and value.3.4 The selectivity and competitiveness of PPF-CDNB probe for H2S
The detection system often comprises a variety of chemical substances, potentially interfering with the identification of target products. Therefore, the selectivity of PPF-CDNB probe with various ions was studied in PBS/DMF (V/V = 9/1, pH 7.4) system. In the dispersed system of PPF-CDNB (20 μM) buffer solution, 200 μM of K+, Cu+, Ca2+, Na+, I−, F−, Cl−, CO32−, HCO3−, S2O82−, HSO4−, HSO3−, SCN−, S2O32−, S2O52−, SO32−, NO2−, L-Cys, D-Cys, GSH, and Zn2+ were separately added, and the fluorescence spectra at 528 nm were measured after 10 minutes of incubation. Fluorescence spectra at 528 nm after 10 min of action (Fig. 3a and b). The addition of organic salt and inorganic salt had no significant effect on the fluorescence intensity of PPF-CDNB probe. Although the addition of L-Cys and D-Cys can enhance the fluorescence intensity of PPF-CDNB probe system, it was significantly lower than that caused by the addition of NaHS (Fig. 3c). Notably, when interfering ions were added to the probe, the fluorescence intensity was greatly enhanced upon the addition of NaHS, reaching a level comparable to the fluorescence intensity without interfering ions. Therefore, the PPF-CDNB probe exhibits good selectivity for H2S detection.47 The detection limit (LOD) of the fluorescence probe was calculated to be 0.15 μM (LOD = 3σ/k) after analysis (Fig. S3†). The PPF-CDNB probe can accurately recognize H2S even under very harsh conditions.3.5 Calculation of DFT
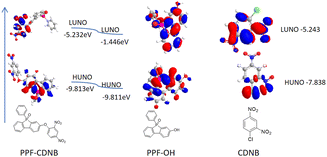
To comprehensively understand the fluorescence change mechanism of probes PPF-CDNB and PPF-OH, DFT calculations were performed using the B3LYP/6-311g(d) level in the Gauss 09 program. A polarizable continuum model (PCM) was employed to account for solvent effects in DMF. The LUMO energy of 1-chloro-2,4-dinitrobenzene (−5.243 eV) falls between the HOMO energy of compound PPF-OH (−9.811 eV) and its LUMO energy (−1.446 eV), indicating that PET can occur (Fig. 4).3.6 Study on the kinetics of H2S by PPF-CDNB probe
UV-visible and fluorescence titration experiments were conducted in PBS/DMF (V/V = 9/1, pH 7.4) buffer solution. As depicted in the figures, the fluorescence intensity at 528 nm gradually increased with the addition of NaHS, becoming notably enhanced at 2 equivalents (Fig. 5a and b). Concurrently, the solution transitioned from colorless to yellow, emitting strong yellow fluorescence under a 365 nm UV lamp (Fig. 5(I, II) and S5†). We also observed a time-dependent phenomenon with the PPF-CDNB probe (Fig. 5c and d). In the PBS/DMF system (V/V = 9/1, pH = 7.4), at a concentration of 20 μM, the fluorescence intensity of PPF-CDNB gradually rose within the first 10 minutes, reaching its peak at 10 minutes, and then stabilized. This experiment demonstrated that the fluorescence intensity of PPF-CDNB exhibited a linear relationship with the concentration of NaHS in the range of 0–2 equivalents, confirming the utility of PPF-CDNB as a tool for H2S detection (Fig. 5b).3.7 Sensing mechanism
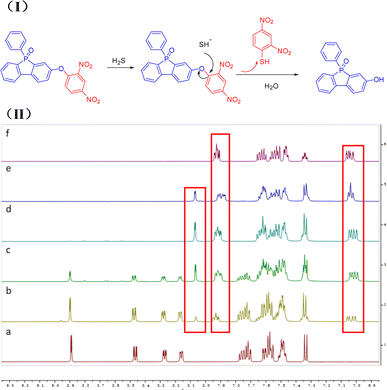
To further elucidate the reaction mechanism between PPF-CDNB and H2S, we conducted a 1H-NMR titration experiment. Confirmation of the conversion of PPF-CDNB to PPF-OH was achieved through 1H-NMR titration of PPF-CDNB in the presence of H2S in a DMSO-d6 solution (Fig. 6(II)). It was observed that the peak of 2,4-dinitrobenzene on PPF-CDNB gradually decreased with the increase of NaHS after the addition of 1 eq., 3 eq., 5 eq., and 10 eq. NaHS, respectively. Following the addition of 5 eq. NaHS, the bimodal proton signal at 8.89 ppm, 8.47 ppm, 8.27 ppm, and 8.16 ppm disappeared. It moved to the high-field region again, appearing at 8.07 ppm, 7.60–7.62 ppm and 7.33 ppm. Upon adding 10 equivalents of NaHS, the peak position remained essentially unchanged compared to adding 5 equivalents of NaHS, indicating that excess H2S did not affect the thiolysis reaction of PPF-CDNB. These findings support a sensing mechanism involving hydrogen sulfide-induced ether bond thiolysis (Fig. 6(I)). Additionally, the sensing mechanism was corroborated by HPLC analysis (Fig. S6†).3.8 Live cell fluorescence imaging
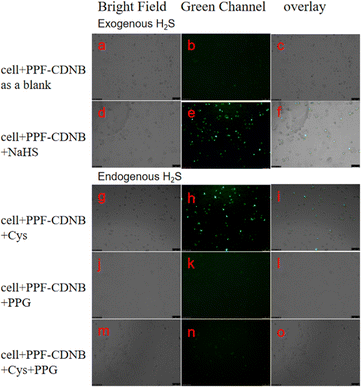
Inspired by the above experimental results, we further investigated the practicality of probes for detecting intracellular H2S. Initially, we conducted standard studies to evaluate the cytotoxicity of the probes. In preliminary experiments, the cytotoxicity of PPF-CDNB on A549 cells was examined using a CCK-8 assay (Fig. S7†). Our observations revealed that when treated with 10 μM PPF-CDNB for 12 hours, approximately 80% of A549 cells remained viable. The results indicate that the probe exhibited low toxicity to A549 cells (Fig. S7†).We utilized PPF-CDNB to detect both exogenous and endogenous H2S in living A549 cells, selecting a concentration of 10 μM based on cytotoxicity assays. Exogenous H2S detection was divided into two groups. In the first group, A549 cells were pre-incubated with PPF-CDNB for 30 minutes as a blank control, resulting in minimal fluorescence under fluorescence microscopy (Fig. 7b). In the second group, A549 cells were pre-incubated with PPF-CDNB followed by 50 μM NaHS, leading to pronounced green fluorescence in the cytoplasmic region of the cells (Fig. 7e). Demonstrate the decomposition of PPF-CDNB by exogenous H2S into PPF-OH, which emits dazzling fluorescence. Light field images of A549 cells incubated with PPF-CDNB and PPF-CDNB + H2S (Fig. 7a and d) showed no morphological changes in the cell structure, indicating the effectiveness of PPF-CDNB in detecting exogenous H2S.
The enzymes 3-mercaptopyruvate thiotransferase (3MST), cystathionine γ-lyase (CSE), and cystathionine β-synthase (CBS) present in the cytoplasm utilize Cys as a substrate to produce endogenous H2S.48 PPG is a potent H2S inhibitor of cystathionine γ-lyase (CSE) synthesis. For endogenous H2S detection, experiments were divided into three groups. In the first group, A549 cells were incubated with PPF-CDNB (10 μM) followed by the addition of cysteine (Cys) (50 μM), resulting in observable green fluorescence (Fig. 7h). As a control in the second group, A549 cells pretreated with PPF-CDNB (10 μM) were incubated with only 200 μM PPG, no fluorescence (Fig. 7k). In the third group, A549 cells were first incubated with PPF-CDNB (10 μM), followed by the addition of Cys (50 μM) and 200 μM PPG before imaging under light microscopy, confirming the absence of green fluorescence in the cytoplasm (Fig. 7n).
This highlights the role of PPG in inhibiting intracellular enzymes, thus preventing endogenous H2S production. In the absence of H2S in 2,4 dinitrobenzene ether will not cracking, PPF-CDNB remain inactive forms (no fluorescence). Bright-field images of A549 cells incubated with PPF-CDNB, PPF-CDNB + Cys, PPF-CDNB+ Cys + PPG, and PPF-CDNB + PPG showed no change in the morphology of the cellular structures (Fig. 7).
It should be noted that the weak fluorescence observed in PPF-CDNB treated A549 cells (Fig. 7b) may be due to the reaction of PPF-CDNB with a small amount of endogenous H2S present in the cytoplasm. Show that the PPF-CDNB endogenous H2S level is capable of detecting living cells.
4 Conclusions
We have established a novel molecular design strategy for fluorescent probes, which can target H2S and exhibit significant fluorescence enhancement. This design is based on asymmetric π-conjugated phosphine oxide, achieved through the creation of the large π-bond conjugated probe PPF-CDNB with a PPF structure. The diaryl ether structure on the synthesized PPF compound showed a blue shift of more than 100 nm when thiolated (Fig. S4a†), which could significantly reduce the interference of crosstalk signal and improve the accuracy of ratio measurement. Utilizing PPF-OH as a scaffold, we developed the PPF-CDNB fluorescence probe, which markedly amplified the fluorescence intensity of the H2S thiolysis reaction. Based on the complex environment in vivo, the selectivity experiment and anti-interference experiment of the probe were also conducted (Fig. 3b and c). These experiments revealed the probe's ability to distinguish H2S from other interfering substances, showcasing high selectivity and sensitivity. We believe that using this unique method of structural shift of PPF provides a flexible platform for the design of various fluorescent probes.The rapid transformation of the probe in the green channel observed during live cell imaging indicates the cellular response of PPF-CDNB to H2S. Given its relevance to a myriad of biological phenomena and conditions, including Alzheimer's disease and down syndrome, PPF-CDNB is expected to serve as a valuable research tool for detecting related biological processes and diseases.
Data availability
The data underlying this study are available in the published article and its ESI.†Author contributions
Shuntao Zhang: writing – manuscript, methodology, investigation, conceptualization. Xingyong Liu: resources. Xiangjun Chen: visualization. Jiefeng Tang: investigation. Juan Wang: writing – review editing, supervision, conceptualization.Conflicts of interest
There are no conflicts to declare.Acknowledgements
We appreciated the financial supports from the National Natural Science Foundation of China (no. 22377087).References
- L. Long, S. Cao, B. Jin, X. Yuan, Y. Han and K. Wang, Food Anal. Methods, 2019, 12, 852–858 CrossRef.
- G. Park, M. Jang and M. S. Han, RSC Adv., 2023, 13, 32137–32142 RSC.
- X. Tong, L. Hao, X. Song, S. Wu, N. Zhang, Z. Li, S. Chen and P. Hou, RSC Adv., 2022, 12, 17846–17852 RSC.
- K. Zhong, L. Deng, J. Zhao, X. Yan, T. Sun, J. Li and L. Tang, RSC Adv., 2018, 8, 23924–23929 RSC.
- T. Okada, H. Li, Y. Li, B. Gu, W. Su, X. Duan, H. Xu, Z. Huang and S. Yao, Anal. Methods, 2017, 9, 3290–3295 RSC.
- Z. Chan, Q. Bo, Y. Zeng, J. Chen, T. Yu and L. Yi, Chin. J. Org. Chem., 2017, 37, 92–96 CrossRef.
- H. Li, W. Peng, W. Feng, Y. Wang, G. Chen, S. Wang, S. Li, K. Wang and J. Zhang, Chem. Commun., 2016, 52, 4628–4631 RSC.
- H. Kimura, Amino Acids, 2010, 41, 113–121 CrossRef PubMed.
- Y. L. Pak, J. Li, K. C. Ko, G. Kim, J. Y. Lee and J. Yoon, Anal. Chem., 2016, 88, 5476–5481 CrossRef CAS PubMed.
- Q. Wang, Z. Chen, X. Zhang, Y. Xin, Y. Xia, L. Xun and H. Liu, Free Radical Biol. Med., 2021, 177, 287–298 CrossRef CAS PubMed.
- S. Peng, T. Zhong, T. Guo, D. Shu, D. Meng, H. Liu and D. Guo, New J. Chem., 2018, 42, 5185–5192 RSC.
- L. Long, F. Yuan, X. Yang, P. Ruan, X. Chen, L. Li, D. He, S. Yang, Y. Yang and K. Wang, Sens. Actuators, B, 2022, 369, 132211 CrossRef CAS.
- A. Kafle, S. Bhattarai, J. M. Miller and S. T. Handy, RSC Adv., 2020, 10, 45180–45188 RSC.
- Z. Chen, F. Chen, Y. Sun, H. Liu, H. He, X. Zhang and S. Wang, RSC Adv., 2017, 7, 2573–2577 RSC.
- M. Yang, J. Fan, J. Du and X. Peng, Chem. Sci., 2020, 11, 5127–5141 RSC.
- Q. Feng, Y. Song, Y. Ma, Y. Deng, P. Xu, K. Sheng, Y. Zhang, J. Li and S. Wu, Spectrochim. Acta, Part A, 2023, 296, 122658 CrossRef CAS PubMed.
- W. Chen, A. Pacheco, Y. Takano, J. J. Day, K. Hanaoka and M. Xian, Angew. Chem., Int. Ed., 2016, 55, 9993–9996 CrossRef CAS PubMed.
- D. Xue, R. Zhou, X. Lin, X. Duan, Q. Li and T. Wang, RSC Adv., 2019, 9, 4150–4156 RSC.
- O. Kabil and R. Banerjee, Antioxid. Redox Signaling, 2014, 20, 770–782 CrossRef CAS PubMed.
- S. G. Surya, S. Bhanoth, S. M. Majhi, Y. D. More, V. M. Teja and K. N. Chappanda, CrystEngComm, 2019, 21, 7303–7312 RSC.
- A. P. Jarosz, T. Yep and B. Mutus, Anal. Chem., 2013, 85, 3638–3643 CrossRef CAS PubMed.
- J. E. Doeller, T. S. Isbell, G. Benavides, J. Koenitzer, H. Patel, R. P. Patel, J. R. Lancaster, V. M. Darley-Usmar and D. W. Kraus, Anal. Biochem., 2005, 341, 40–51 CrossRef CAS PubMed.
- J. Wu, S.-X. Wu, Y. Wu, Y.-H. Kan, Y. Geng and Z.-M. Su, Phys. Chem. Chem. Phys., 2013, 15, 2351 RSC.
- Z.-L. Zhu, W.-C. Chen, S.-F. Ni, J. Yan, S. F. Wang, L.-W. Fu, H.-Y. Tsai, Y. Chi and C.-S. Lee, J. Mater. Chem. C, 2021, 9, 1318–1325 RSC.
- C. Combes-Chamalet, H.-J. Cristau, M. McPartlin, F. Plénat, I. J. Scowen and T. M. Woodroffe, J. Chem. Soc., Perkin Trans. 2, 1997, 15–18 RSC.
- K. Nishimura, K. Hirano and M. Miura, Org. Lett., 2020, 22, 3185–3189 CrossRef CAS PubMed.
- M. P. Duffy, W. Delaunay, P.-A. Bouit and M. Hissler, Chem. Soc. Rev., 2016, 45, 5296–5310 RSC.
- E. Si, P. Zhao, L. Wang, Z. Duan and F. Mathey, Eur. J. Org Chem., 2020, 2020, 697–701 CrossRef CAS.
- Y. Kuninobu, T. Yoshida and K. Takai, J. Org. Chem., 2011, 76, 7370–7376 CrossRef CAS PubMed.
- M. Onoda, Y. Koyanagi, H. Saito, M. Bhanuchandra, Y. Matano and H. Yorimitsu, Asian J. Org. Chem., 2017, 6, 257–261 CrossRef CAS.
- H. Fujimoto, M. Kusano, T. Kodama and M. Tobisu, Org. Lett., 2020, 22, 2293–2297 CrossRef CAS PubMed.
- K. Nishimura, K. Hirano and M. Miura, Org. Lett., 2019, 21, 1467–1470 CrossRef CAS PubMed.
- J. Cornforth, J. Chem. Soc., Perkin Trans. 1, 1996, 2889–2893 RSC.
- K. Nishimura, S. Xu, Y. Nishii and K. Hirano, Org. Lett., 2023, 25, 1503–1508 CrossRef CAS PubMed.
- K. Sarac, C. Orek, A. Cetin, T. Dastan, P. Koparir, S. D. Dastan and M. Koparir, Phosphorus, Sulfur Silicon Relat. Elem., 2016, 191, 1284–1289 CrossRef CAS.
- G. Bonetti, S. Arnaboldi, S. Grecchi, G. Appoloni, E. Massolo, S. Rossi, R. Martinazzo, F. Orsini, P. R. Mussini and T. Benincori, Molecules, 2020, 25, 2175 CrossRef CAS PubMed.
- Y. Dong, Y. Takata, Y. Yoshigoe, K. Sekine and Y. Kuninobu, Chem. Commun., 2019, 55, 13303–13306 RSC.
- J. Nishida, Y. Kawakami, S. Yamamoto, Y. Matsui, H. Ikeda, Y. Hirao and T. Kawase, Eur. J. Org Chem., 2019, 2019, 3735–3743 CrossRef CAS.
- P. Hibner-Kulicka, J. A. Joule, J. Skalik and P. Bałczewski, RSC Adv., 2017, 7, 9194–9236 RSC.
- R.-F. Chen, R. Zhu, Q.-L. Fan and W. Huang, Org. Lett., 2008, 10, 2913–2916 CrossRef CAS PubMed.
- D. Zhong, Y. Yu, D. Song, X. Yang, Y. Zhang, X. Chen, G. Zhou and Z. Wu, ACS Appl. Mater. Interfaces, 2019, 11, 27112–27124 CrossRef CAS PubMed.
- J. K. Kim, S. Y. Bong, R. Park, J. Park and D. O. Jang, Spectrochim. Acta, Part A, 2022, 278, 121333–121356 CrossRef CAS PubMed.
- B. Fang, J. Yang, L. Wang, H. Li, J. Guo, J. Zhang, Q. Guo, B. Peng, K. Liu, M. Xi, H. Bai, L. Fu and L. Li, Chin. Chem. Lett., 2024, 35, 108913 CrossRef CAS.
- K. Zhong, Y. He, L. Deng, X. Yan, X. Li, Y. Tang, S. Hou and L. Tang, Anal. Chim. Acta, 2020, 1127, 49–56 CrossRef CAS PubMed.
- A. Bhattacharyya and N. Guchhait, Chem. Phys., 2021, 541, 111032 CrossRef CAS.
- Y. Pan, Y. Li, X. Sun, L. Tang and X. Yan, Dyes Pigm., 2023, 210, 110985 CrossRef CAS.
- Y. Hoshino, K. Hanaoka, K. Sakamoto, M. Yasunaga, T. Kojima, D. Kotani, A. Nomoto, E. Sasaki, T. Komatsu, T. Ueno, H. Takamaru, Y. Saito, Y. Seto and Y. Urano, RSC Chem. Biol., 2022, 3, 859–867 RSC.
- R. Kaur, R. Kour, S. Kaur and P. Singh, J. Photochem. Photobiol., A, 2023, 444, 114995 CrossRef CAS.
Footnote |
| † Electronic supplementary information (ESI) available: Characterization data, photophysical properties, and experimental details for H2S sensing influorescence spectrophotometer and imaging instrument. See DOI: https://doi.org/10.1039/d4ra02979h |
| This journal is © The Royal Society of Chemistry 2024 |

