
 Open Access Article
 This Open Access Article is licensed under a Creative Commons Attribution-Non Commercial 3.0 Unported Licence
A sustainable methodology employing the extract of red dragon fruit peel as a fluorescence probe for detection of indigo carmine (E132) in food samples: evaluation of the method's greenness, whiteness, and blueness†
Huda Salem AlSalema,
Sara Naif Alharbia,
Soha Talal Al-Goulb,
Noha S. Katameshc and
Mohamed A. Abdel-Lateef *d
*d
aDepartment of Chemistry, College of Science, Princess Nourah bint Abdulrahman University, P.O. Box 84428, Riyadh 11671, Saudi Arabia
bDepartment of Chemistry, College of Sciences & Arts, King Abdulaziz University, Rabigh 21911, Saudi Arabia
cPharmaceutical Analytical Chemistry Department, Faculty of Pharmacy (Girls), Al-Azhar University, Cairo, Egypt
dDepartment of Pharmaceutical Analytical Chemistry, Faculty of Pharmacy, Al-Azhar University, Assiut Branch, Assiut 71524, Egypt. E-mail: mohamed_abdellateef@azhar.edu.eg; Tel: +201028136868
First published on 31st July 2024
Abstract
Indigo carmine dye is one of the most widely used dyes in various fields. In this study, the ethanolic extract of red dragon fruit peel (Ex-RDFP) was employed as a green fluorescence probe for measuring the synthetic dye indigo carmine. At a fluorescence excitation of 290.5 nm, the Ex-RDFP exhibits a fluorescence emission band at 341.5 nm. Meanwhile, the indigo carmine dye possesses an absorption spectrum at a maximum peak of 290 nm. Consequently, the fluorescence intensity of the Ex-RDFP was reduced upon the addition of indigo carmine solution due to the inner filter effect mechanism. This quenching in the fluorescence intensity of Ex-RDFP was substantially associated with the indigo carmine concentration at a linear scale of 1.0–7.0 μg mL−1 (r2 = 0.9993). Furthermore, the limit of detection and the limit of quantitation of the method were found to be 0.209 μg mL−1 and 0.635 μg mL−1, respectively. The optimal analytical conditions, such as solvent used for dilution, pH, reaction time, volume of the reagent, and temperature, were examined and carefully studied. In addition, the proposed method was successfully applied to detect indigo carmine dye in various natural syrup samples, including lemon syrup, apple syrup, cantaloupe syrup, pineapple syrup, and guava syrup, with acceptable recovery values. The method's beneficial sustainability footprint was found by using an extensive greenness analysis that incorporated the modified National Environmental Methods Index (NEMI), the complex Green Analytical Procedure Index (GAPI), and the Analytical Greenness Calculator (AGREE) prep algorithms. In addition, “whiteness” and “blueness” were also assessed with the newly released (Red Green Blue 12) RGB12 and Blue Applicability Grade Index (BAGI) computational methods, emphasizing the benefit of the proposed method in terms of analytical efficiency, sustainability, and economy. The suggested technique is the answer to the worldwide popularity of ecologically conscious solutions by providing a green-and-white substitute for traditional techniques and advancing towards creating more sustainable quality control procedures in the future.
1 Introduction
Indigo carmine dye, an acid blue dye, is an organic compound with the name of 5,5′-indigo disulfonic acid sodium salt (C16H8N2Na2O8S2), with four aromatic rings and two sulfonated groups (Fig. S1a†).1 Indigo carmine is not only one of the most extensively used synthetic dyes, but it is also naturally obtained from the Indigofera tinctoria plant.2 Indigo carmine finds widespread applications in a variety of industries, including the food and pharmaceutical industries, as well as in the textile, paper, leather, plastics, and cosmetics industries.3–9 It is also employed as a microscopic stain and in medical diagnostics, in biological applications and as a photometric detector and redox indicator in chemical experiments.1,2,10–12 Since 1975, researchers have conducted research on the harmful impacts of food coloring agents, specifically focusing on indigo carmine.2 This particular coloring has been found to be associated with various diseases, including allergies, asthma, hypersensitivity, migraines, reproductive problems, certain types of central tumors, and long-lasting damage to the cornea, as well as in irritations of the eyes and skin.2 Due to its detrimental impacts on human health, the recommended daily consumption is 0–5 mg kg−1 of the body weight of the individual.2,13 In light of the harmful health effects associated with synthetic food dyes, it is critical to ascertain the concentrations of the additives present in foods and to monitor their usage.13Spectrofluorometry is a low-cost and easy-to-use technique that is largely utilized in analytical laboratories and research. The substantial interest in this analytical approach can be succinctly summarized by emphasizing the benefits that fluorescence spectroscopy provides: (a) it exhibits an exceptionally high level of sensitivity, even in complex matrices, allowing for the detection of single molecules under particular conditions; (b) it can exhibiting a linear response in a wide variety of analyte concentration ranges; (c) it exhibits an exceptional degree of versatility.14
Green analytical chemistry techniques are receiving more and more consideration for advancing sustainability in analytical laboratories. To achieve the intended objectives of green analytical chemistry, minimizing the size of the laboratory equipment and substituting chemical reagents with more sustainable ones will be necessary. The red dragon fruit, sometimes called the red pitaya, is a colored fruit because it contains specific compounds known as betalains15 that include two subgroups called betaxanthins and betacyanins (Fig. S1b and c†).16,17 Approximately 30% of the overall fruit weight is attributed to its peel. Nevertheless, the peel is currently considered as waste and is disposed of during industrial processing.16 Considering this and aligning with global politics, it is imperative to revitalize underutilized resources, namely bio-residues lacking any significant purpose, while prioritizing circular economy and sustainability. This approach will foster socio-economic development and mitigate environmental harm.18
However, many widely used analytical methods depart from sustainable chemistry principles, because they use hazardous solvents, complex multi-step treatments, expensive equipment, and large numbers of buildings, which pose significant hazards to human health, the ecosystem, and the nation's financial stability. The immediate requirement to deal with these unsustainable habits necessitates the creation of creative analytical techniques that adhere to the principles of the newly developing specialties of white analytical chemistry (WAC) and green analytical chemistry (GAC).19,20 In addition, the betalain pigments possess a native fluorescence activity as an inherent characteristic.21,22
The current study aims to extract the red dragon fruit peel using an eco-friendly green solvent, explore its fluorescence characteristics, and then use the extract as an environmentally friendly fluorescence probe for developing an analytical method to detect indigo carmine dye. In addition, the study will extend to the optimization of different analytical conditions for detecting the indigo carmine dye. Furthermore, the study will extend to the validation of the proposed method regarding repeatability and intermediate precisions, linear range, detection and quantitation limits, and a selectivity study. Moreover, the study aims to detect the quantity of indigo carmine in various food samples using the proposed method. Finally, the work's greenness and sustainability will be evaluated using various tools.
2 Experimental process
2.1. Materials and reagents
The red dragon fruit was obtained from a local fruit and vegetable market in Assiut City, Egypt. Indigo carmine was manufactured by E. Merck, Darmstadt, Germany. Ethanol, sucrose, glucose, lactose, methanol, maltose, citric acid, ascorbic acid, magnesium chloride, calcium chloride, sodium chloride, potassium chloride, and sodium nitrate were purchased from the El-Gomhouria Company, Assiut, Egypt, and produced by El-Nasr Company, Cairo, Egypt. A 100 mL calibrated flask was used to make a stock solution of indigo carmine dye (200 μg mL−1) by dissolving 20.0 mg of the powder in 100 mL of pure water. The pH value of the environment was adjusted and regulated by adding Teorell and Stenhagen buffer.2.2. Preparation and extraction of red dragon fruit peel
Fresh red pitaya fruits were carefully cleaned to remove any dirt, and then washed, and manually peeled. A weight equal to 80 g of the fruit peel was sliced, mixed, and blended in a mixer with 150 mL of absolute ethyl alcohol. The contents were transferred into a beaker, and the beaker was warmed in a water bath at 55 °C for 5 h. Then, the mixture was filtered through filter paper, and the resulting solution was additionally filtered through a filter membrane of 0.45 μm.2.3. Instrumentation
A spectrofluorometer (Scinco Co., Korea) supplied with a 150 W Xe arc lamp and FluoroMaster Plus software was used in this study. A UV/vis spectrophotometer, (Optizen POP, Mecasys Co. Ltd, Korea) was also used. A pH meter (Jenway 350, Keison Products) was utilized in order to observe and track the necessary pH of the environment.2.4. Procedures for detection of indigo carmine by Ex-RDFP
Various concentrations of the indigo carmine standard solution ranging from 10 to 70 μg mL−1 were combined with 1.0 mL of Teorell and Stenhagen buffer (pH = 6.0) and 1.0 mL of ethanolic extract of the red dragon fruit peel in 10 mL volumetric flasks. The components were completely mixed, and after waiting for 5 min, and the solution was made up to the mark with methanol. The quenching of the intensity of the fluorescence emission at 341.5 nm was recorded and compared with the intensity of the blank under the same conditions (without the addition of indigo carmine) upon the fluorescence excitation of 290.5 nm for all the experiments.3 Results and discussion
3.1. Fluorescence spectra of Ex-RDFP and its fluorescence quantum yield
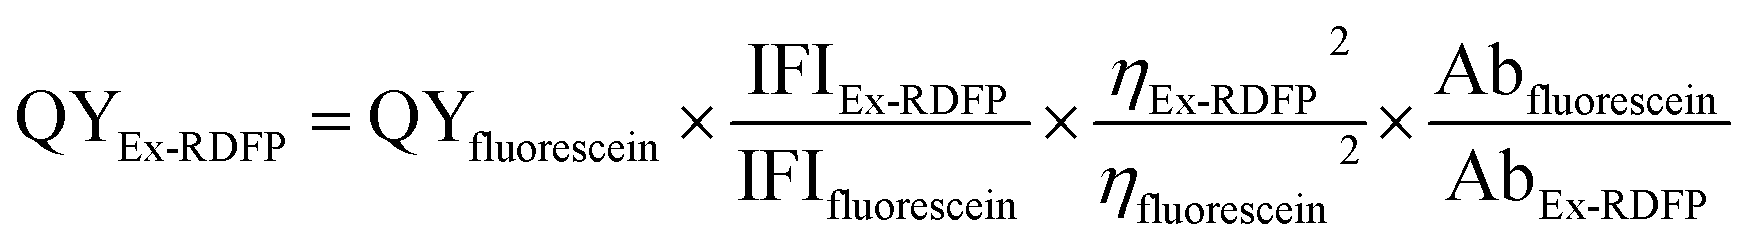
In the studies of extracting betalain pigments from the peel of red dragon fruit by Roriz et al.16 and Faridah et al.,17 ethanol was used as an efficient and environmentally friendly solvent for extracting the betalain pigments. Consequently, ethanol was employed in the current study as an extractant solvent. Furthermore, the Ex-RDFP was investigated in the current study using spectrofluorometry, and it exhibited an excitation fluorescence spectrum at 290.5 nm and a fluorescence emission spectrum at 341.5 nm, as shown in Fig. 1A. These results closely agreed with the reported spectrofluorometric investigation of the extracted betalain pigments from red beetroot, which exhibited an emission of 357 nm and an excitation of 305 nm.22 Furthermore, the inherent fluorescence of the Ex-RDFP (fluorophore brightness) can be identified by calculating its fluorescence quantum yield (QY) value using the equation:where, QYfluorescein is the quantum yield value of fluorescein as a reference material, IFI is the integrated fluorescence intensity for the Ex-RDFP and fluorescein, Ab is the absorbance for the Ex-RDFP and fluorescein, and η is the refractive index of the solvent. The Ex-RDFP was determined to have an estimated QY value of 7.2%.
 | ||
| Fig. 1 (A) Shows the fluorescence emission and excitation spectra for Ex-RDFP, (B) shows the absorbance spectrum of indigo carmine, and (C) is the fluorescence emission and excitation spectra, curves a & b are for Ex-RDFP alone, and c & d are for Ex-RDFP in the presence of indigo carmine (5.0 μg mL−1), respectively. | ||
3.2. Mechanism of quenching and the Stern–Volmer analysis
The inner filter effect (IFE) strategy is a practical approach for designing fluorescence sensors, offering flexibility, simplicity, and high sensitivity.23 This phenomenon is known to occur when absorbers (analyte) in the detecting system absorb the excited and/or emitted light of the reagent.23 Hence, the performance of IFE necessitates the existence of two dyes, one that is an absorbent and another that is an analyte-independent fluorophore. Consequently, modulation of the emission of the fluorophore occurs when the absorber (analyte) has a complementary overlap region with the emission spectrum or with the excitation spectrum of the reagent (fluorescent dye).23 In the current sensing system, Ex-RDFP functions as a fluorophore (fluorescent dye), and the indigo carmine dye functions as a fluorescence absorber.Fig. 1B shows that the UV-vis absorption spectrum of indigo carmine exhibited a prominent single absorption peak at a wavelength of 290 nm. An extensive and close spectral overlap was detected between the absorbance spectrum of the indigo carmine dye and the fluorescence excitation spectrum of the Ex-RDFP at 290.5 nm. Consequently, the presence of both substances effectively quenched or diminished the fluorescence intensity (FI) of Ex-RDFP. Practically, it was found that the emission intensity of Ex-RDFP diminished upon the addition of the indigo carmine dye, see Fig. 1C, and this proves that a sensing fluorescent approach for indigo carmine dye based on the IFE strategy has merit. Moreover, the quenching of Ex-RDFP's fluorescence by indigo carmine dye was analyzed using the Stern–Volmer equation:
![[thin space (1/6-em)]](https://www.rsc.org/images/entities/char_2009.gif) 117 M−1 with an intercept value of 0.9097.
117 M−1 with an intercept value of 0.9097.
3.3. The optimization of the developed sensing system
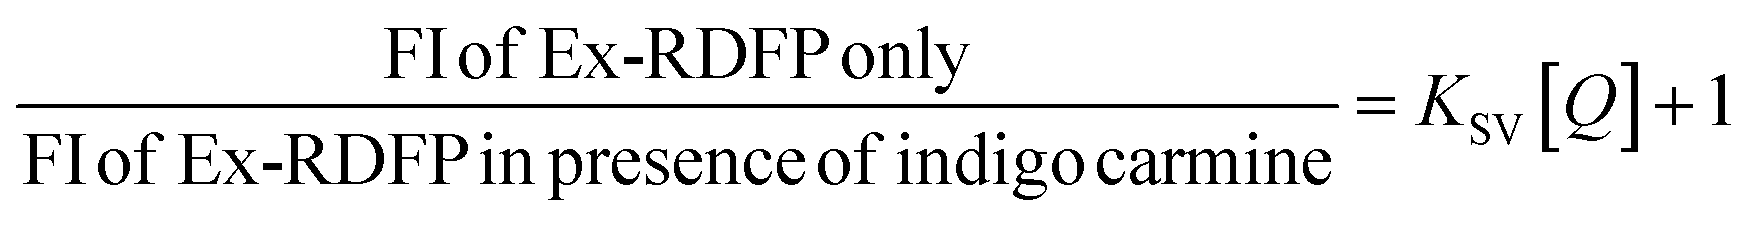
Factors affecting the native FI of Ex-RDFP, such as the solvent used for dilution, and the pH, were investigated and optimized. As shown in Fig. 2A, the native FI of Ex-RDFP was gradually increased with the rising value of pH, and the highest values of the native FI were achieved at the pH range of 5–7, and above this range, the native FI values gradually diminished with the increasing the alkalinity of the medium. So, the initial pH value selected was 6.0. To study the effect of the diluting solvent used on the native FI of Ex-RDFP, a fixed amount from Ex-RDFP was diluted with different organic solvents (acetone, acetonitrile, dichloromethane, DMF, ethanol, ethyl acetate, and methanol), distilled water, and the aqueous solution of different surfactants including a solution of 0.02 M hexadecyltrimethylammoniumbromide (HTAB) as a cationic surfactant, a solution of 0.02 M sodium dodecyl sulfate (SDS) as an anionic surfactant, a solution of Tween-20 (1% v/v) as a nonionic surfactant in addition to a 1.0 N HCl solution. As shown in Fig. 2B, the lowest values of the native FI were achieved with acetone, whereas the highest values were achieved with methanol, and the FI was not enhanced in a micellar medium. Therefore, methanol was selected as the diluting solvent in the current study. | ||
| Fig. 2 The optimization of the factors affecting the native fluorescence intensity of Ex-RDFP, (A) the effect of the pH, and (B) the effect of the diluting solvent. | ||
Furthermore, variable conditions, including the volume of Ex-RDFP, pH, and the required time that effects the quenching of the native FI of Ex-RDFP upon adding indigo carmine (5.0 μg mL−1) were investigated and optimized. As displayed in Fig. 3A, the fluorescence quenching (ΔFI) of Ex-RDFP in the presence of the indigo carmine dye is pH-dependent, which seems low under the high acidic medium and was markedly diminished in the alkaline environment. In contrast, the values of the fluorescence quenching attain the maximum and remain stable in a slightly acidic and neutral solution at a pH range of 4–7, which confirms to the selection of pH = 6 as an optimum pH value. Furthermore, the best fluorescence quenching values were obtained by using 1.0 mL of the Ex-RDFP solution as an optimum volume, see Fig. 3B. Furthermore, the incubation time and the incubation temperature were 5 min and room temperature (25 °C), respectively.
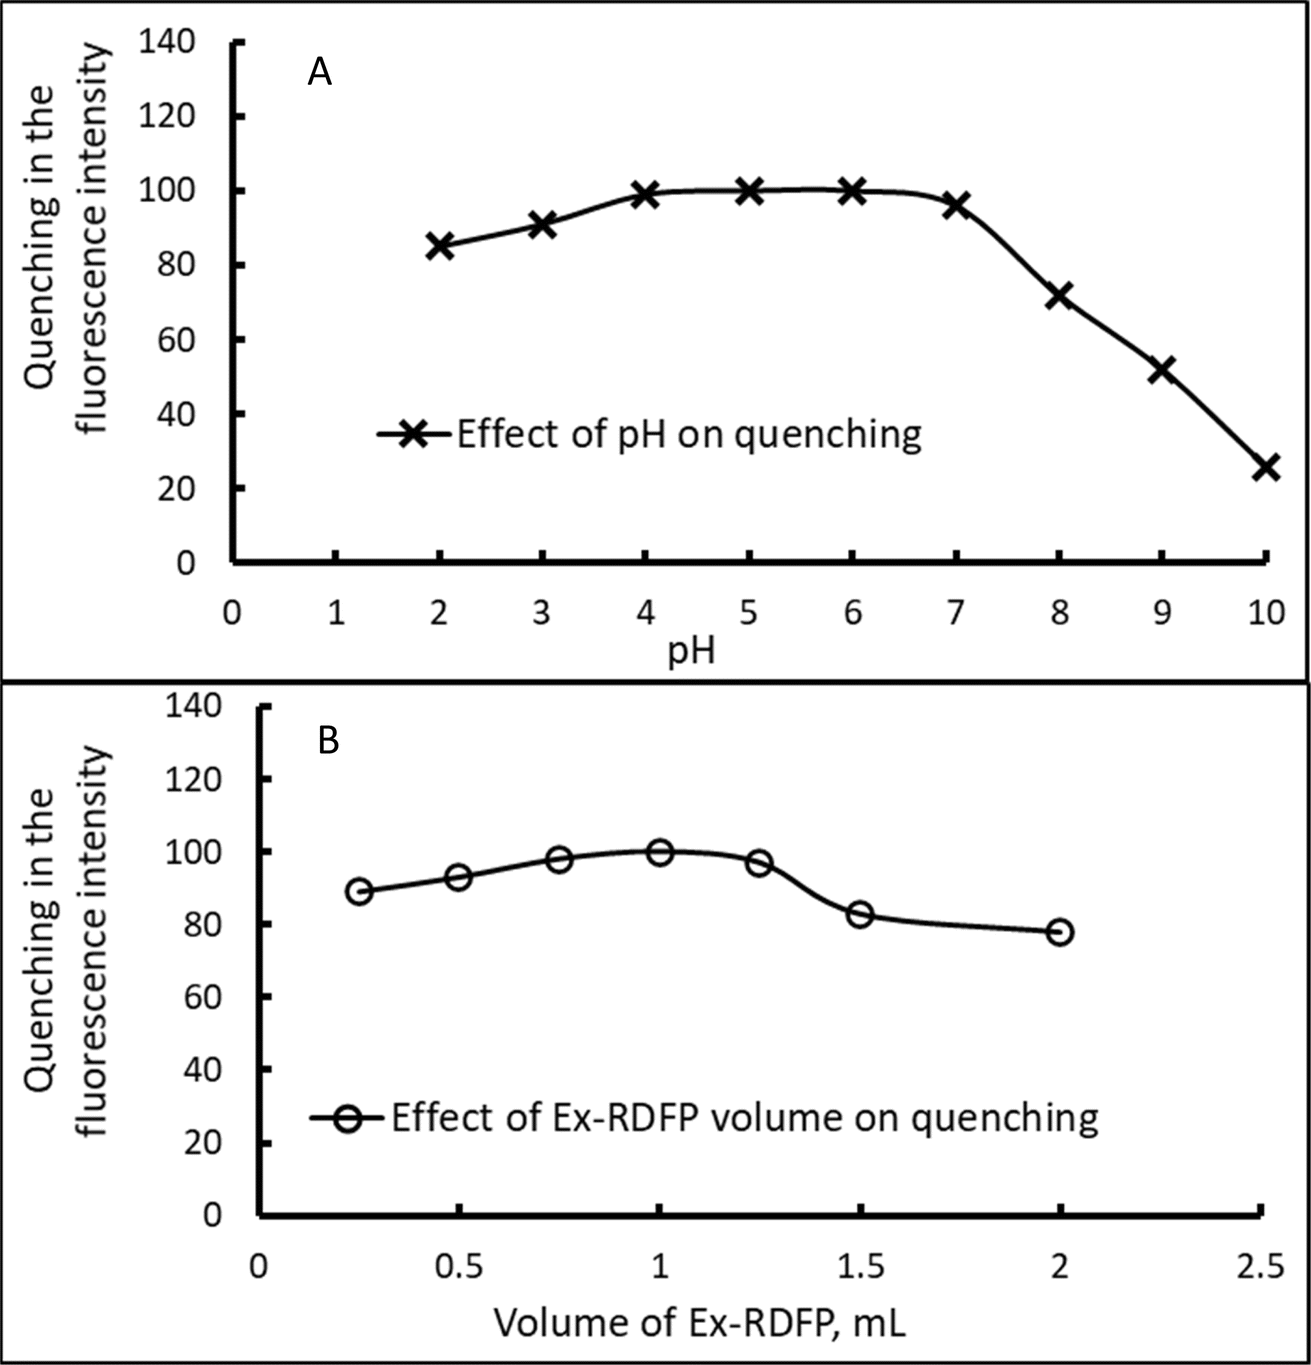 | ||
| Fig. 3 Factors affecting the quenching of the native fluorescence intensity of Ex-RDFP by indigo carmine (5.0 μg mL−1); (A) the effect of pH, and (B) the effect of the volume of Ex-RDFP. | ||
3.4. Analytical performance
Under the optimized analytical conditions, different known concentrations of indigo carmine dye were mixed with Ex-RDFP to investigate and evaluate the analytical performance of the suggested method. It was found that the FI of Ex-RDFP was gradually decreased with the gradual increase in the concentration of indigo carmine, and the quenching of the fluorescence intensity of Ex-RDFP (ΔF = Fo − F) for the indigo carmine dye was found to be linear at a concentration between 1.0 and 7.0 μg mL−1 with a R2 of 0.9993, Table 1. In addition, the calculated limit of detection value (LOD) was 0.209 μg mL−1 at 3.3 × SD/slope. Moreover, the calculated limit of quantitation (LOQ) was 0.635 μg mL−1 at 10 × SD/slope.| Parameter | Result |
|---|---|
| Linear range (μg mL−1) | 1.0–7.0 |
| Slope | 19.52 |
| SD of slope | 0.32 |
| Intercept | 1.22 |
| SD of intercept | 1.24 |
| r2 | 0.9993 |
| LOQ (μg mL−1) | 0.635 |
| LOD (μg mL−1) | 0.209 |
3.5. Repeatability and intermediate precision
Repeatability and intermediate precision studies were determined by measuring the indigo carmine dye at three concentration levels three times during the day and on three days. The optimized procedures described above were followed by adding standard solutions of indigo carmine dye at 2.0 μg mL−1, 4.0 μg mL−1, and 6.0 μg mL−1 concentration levels. Concerning the two forms of precision, the RSD values were found to fall in ranges of 0.86–3.82% and 1.31–4.97% for both repeatability and intermediate precision, respectively, which proved the precision of the proposed method for determining indigo carmine dye concentration.3.6. Selectivity study
To investigate the selectivity of the Ex-RDFP sensor towards indigo carmine dye, the impacts of certain interfering substances such as ascorbic acid, citric acid, glucose, lactose, maltose, starch, sucrose, and some ions (Ca2+, Cl−, K+, Mg2+, Na+, and NO3−) were also evaluated. Excess amounts from the interfering substances were added to solutions containing a fixed concentration of indigo carmine dye. Interfering substances expected to be found naturally in fruits in large quantities, such as glucose, lactose, starch, and sucrose, were studied at a concentration of 10.0 μg mL−1, whereas other interfering substances that are expected to be naturally present in a small percentage, such as ascorbic acid, citric acid, and metal ions, were studied at a concentration of 5.0 μg mL−1. Then, the optimized procedures were applied to these solutions, and the calculated results are shown in Table 2 and Fig. S2.† As shown in Table 2, the proposed method has low SD values and a good recovery, which means that the method possessed good selectivity for the determination of indigo carmine dye. The reason for this may be due to the fact that all of the previously mentioned interfering substances are colorless and the UV-absorption curve for each of them did not show interference either with the excitation or emission fluorescence spectra of Ex-RDFP.| Substance | Amount (μg mL−1) | Recovery ± SD |
|---|---|---|
| Sucrose | 10 | 98.08 ± 2.83 |
| Glucose | 10 | 99.19 ± 1.33 |
| Lactose | 10 | 100.36 ± 3.16 |
| Maltose | 5 | 98.98 ± 3.33 |
| Citric acid | 5 | 98.29 ± 3.92 |
| Soluble starch | 10 | 98.98 ± 2.15 |
| Ascorbic acid | 5 | 98.63 ± 3.11 |
| Mg2+ | 5 | 101.39 ± 3.16 |
| Ca2+ | 5 | 97.6 ± 2.07 |
| Na+ | 5 | 104.16 ± 2.61 |
| K+ | 5 | 94.15 ± 1.58 |
| NO3– | 5 | 100.19 ± 2.37 |
3.7. Application to syrup samples
To assess the analytical suitability of the suggested method, various natural syrup samples, including apple syrup, cantaloupe syrup, guava syrup, lemon syrup, and pineapple syrup, were filtered, centrifugated, and spiked with a known concentration of indigo carmine dye and then thoroughly mixed. The suggested fluorometric procedures were used to analyze the natural samples. The calculated values of recovery ± SD were 104.5 ± 2.61, 98.29 ± 4.89, 100.5 ± 2.99, 94.63 ± 3.11 101.05 ± 2.61, and for apple syrup, cantaloupe syrup, lemon syrup, guava syrup, and pineapple syrup, respectively, (see Fig. S3† for the spectra). These values were acceptable and refer to the reliability and applicability of the suggested method for determining indigo carmine dye in syrup samples.3.8. Assessment of the sustainability characteristic of the method
According to the Green Analytical Chemistry (GAC) guidelines, using natural extracts as chemical reagents for flow evaluation and scale-down techniques offers an additional option for lowering the hazards to consumers and the surroundings, and thus serves as a more sustainable advance for chemical assessment approaches. Within the past two centuries, various green metric algorithms have been established to evaluate the greenness of analytical techniques. They offer an extensive assessment of a method's compliance with Green Chemistry principles, thereby assisting researchers in adopting more sustainable activities. To assess a methodology's ecological sustainability, each environmental metric device has its own set of guidelines and factors to take into consideration.24 The parameters used in the assessment and evaluation of greenness for the suggested method are given in Table S1.†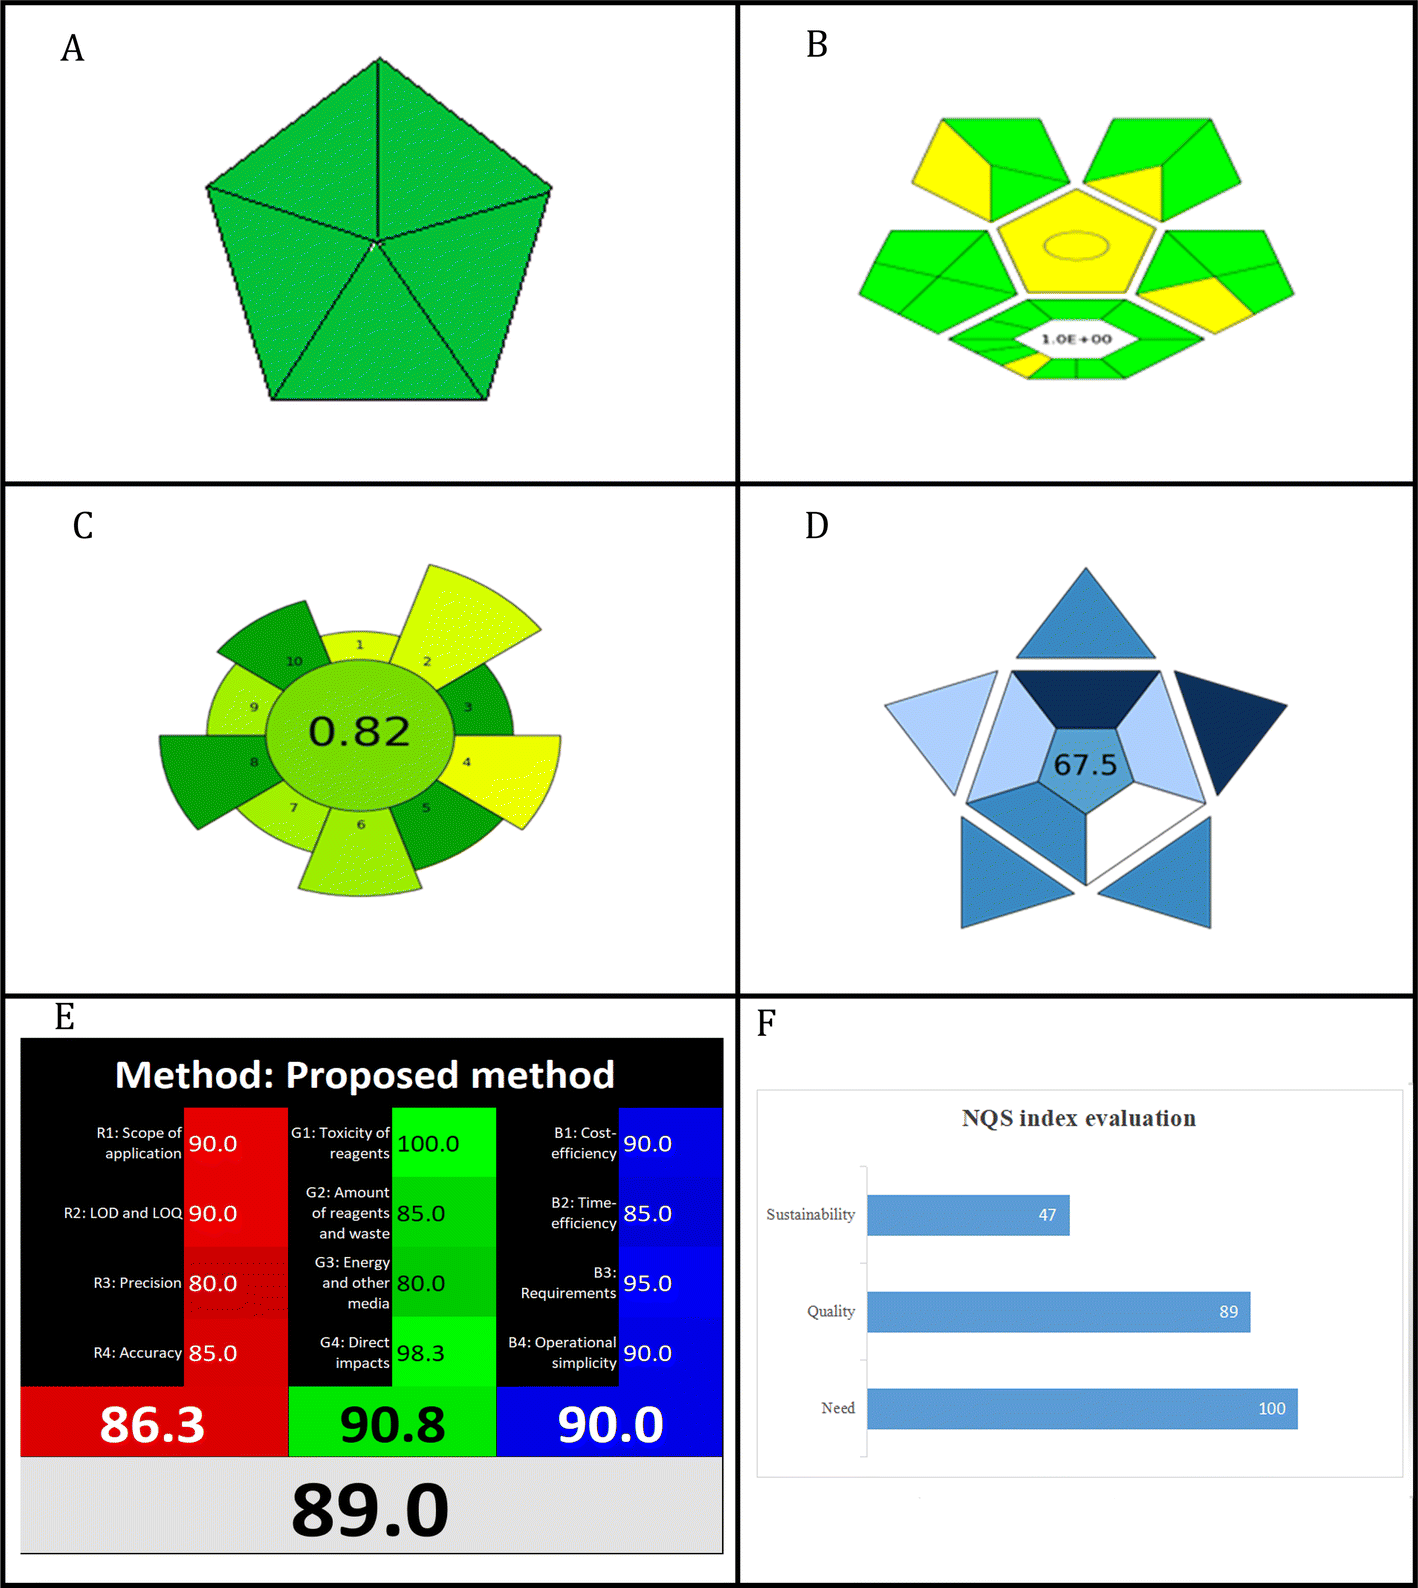 | ||
| Fig. 4 Assessment of greenness for the suggested method: (A) for the modified NEMI, (B) for the complex GAPI tool, (C) for the AGREEprep, (D) for the BAGI tool, (E) for the RGB12 evaluation, and (F) for the NQS index. | ||
4 Conclusion
In this work, the extract of dragon fruit peel was utilized as a fluorescence probe for detecting indigo carmine dye. The extract of dragon fruit peel had fluorescence excitation at 290.5 nm, which closely overlaps with the UV absorption spectrum of the indigo carmine dye, producing an effective inner filter effect on the fluorescence emission of Ex-RDFP at 341.5 nm. Consequently, a rapid, simple, selective methodology has been developed for the detection of indigo carmine. From the perspective of the goals of green and white analytical chemistry, minimizing risks and waste, and utilization of energy, the analytical method developed was found to be innovative and to achieve the goals of sustainability. Whereas the proposed method offers a green-blue-and-white alternative to traditional techniques, enhancing analytical efficiency, sustainability, and economy. Furthermore, it incorporates modified NEMI, GAPI, AGREEprep algorithms, and RGB12, and BAGI computational methods, thus responding to the global trend for ecologically conscious solutions.Data availability
The data supporting this article have been included as part of the ESI.†Author contributions
Huda AlSalem: visualization, investigation, data curation, project administration, funding acquisition, writing – review & editing. Sara Alharbi: methodology, formal analysis, validation, resources, writing – review & editing. Soha Al-Goul: conceptualization, visualization, software, writing – review & editing. Noha Katamesh: writing – original draft, assessment of greenness & sustainability, writing – review & editing. Mohamed Abdel-Lateef: investigation, methodology, resources, formal analysis, writing – review & editing, conceptualization, validation, data curation, writing – original draft, supervision, visualization, software, project administration.Conflicts of interest
There is no conflict of interest to declare.Acknowledgements
Princess Nourah bint Abdulrahman University Researchers Supporting Project number (PNURSP2024R185), Princess Nourah bint Abdulrahman University, Riyadh, Saudi Arabia.References
- F. A. Adam, M. Ghoniem, M. Diawara, S. Rahali, B. Y. Abdulkhair, M. Elamin, M. A. B. Aissa and M. Seydou, RSC Adv., 2022, 12, 24786–24803 RSC.
- N. Kizil, D. Erkmen Erbilgin, M. L. Yola and M. Soylak, Opt. Quantum Electron., 2023, 56, 341 CrossRef.
- L. Quintero and S. Cardona, Dyna, 2010, 77, 371–386 Search PubMed.
- I. Karapanagiotis, V. de Villemereuil, P. Magiatis, P. Polychronopoulos, K. Vougogiannopoulou and A. L. Skaltsounis, J. Liq. Chromatogr. Relat. Technol., 2006, 29, 1491–1502 CrossRef CAS.
- G. Pan, X. Jing, X. Ding, Y. Shen, S. Xu and W. Miao, J. Alloys Compd., 2019, 809, 151749 CrossRef CAS.
- M. F. Chowdhury, S. Khandaker, F. Sarker, A. Islam, M. T. Rahman and M. R. Awual, J. Mol. Liq., 2020, 318, 114061 CrossRef CAS.
- M. El-Kammah, E. Elkhatib, S. Gouveia, C. Cameselle and E. Aboukila, Sustainable Chem. Pharm., 2022, 29, 100753 CrossRef CAS.
- S. Tabti, A. Benchettara, F. Smaili, A. Benchettara and S. E. Berrabah, J. Appl. Electrochem., 2022, 52, 1207–1217 CrossRef CAS.
- F. Farsaci, E. Tellone, M. Cavallaro, A. Russo and S. Ficarra, J. Mol. Liq., 2013, 188, 113–119 CrossRef CAS.
- U. R. Lakshmi, V. C. Srivastava, I. D. Mall and D. H. Lataye, J. Environ. Manage., 2009, 90, 710–720 CrossRef CAS PubMed.
- P. C. Genázio Pereira, R. V. Reimão, T. Pavesi, E. M. Saggioro, J. C. Moreira and F. Veríssimo Correia, Ecotoxicol. Environ. Saf., 2017, 143, 275–282 CrossRef PubMed.
- D. S. S. Edwin, J. G. Manjunatha, C. Raril, T. Girish, D. K. Ravishankar and H. J. Arpitha, J. Electrochem. Sci. Eng., 2021, 11, 87–96 CAS.
- T. Güray, Int. J. Chem. Stud., 2019, 7, 17–23 Search PubMed.
- L. Prodi and A. Credi, in The Exploration of Supramolecular Systems and Nanostructures by Photochemical Techniques, ed. P. Ceroni, Springer Netherlands, Dordrecht, 2012, pp. 97–129, DOI:10.1007/978-94-007-2042-8_5.
- N. Martins, C. L. Roriz, P. Morales, L. Barros and I. C. Ferreira, Food Funct., 2017, 8, 1357–1372 RSC.
- C. L. Roriz, S. A. Heleno, M. J. Alves, M. B. P. Oliveira, J. Pinela, M. I. Dias, R. C. Calhelha, P. Morales, I. C. Ferreira and L. Barros, Food Chem., 2022, 372, 131344 CrossRef CAS PubMed.
- A. Faridah, R. Holinesti and D. Syukri, Pak. J. Nutr., 2015, 14, 976–982 CrossRef CAS.
- J. Bakar, S. Ee, K. Muhammad, D. M. Hashim and N. Adzahan, Food Bioprocess Technol., 2013, 6, 1332–1342 CrossRef CAS.
- C. M. Hussain, C. G. Hussain and R. Keçili, TrAC, Trends Anal. Chem., 2023, 159, 116905 CrossRef CAS.
- K. M. Kelani, E. S. Elzanfaly, A. S. Saad, M. K. Halim and M. B. El-Zeiny, Microchem. J., 2021, 171, 106826 CrossRef CAS.
- M. A. Guerrero-Rubio, J. Escribano, F. García-Carmona and F. Gandía-Herrero, Trends Plant Sci., 2020, 25, 159–175 CrossRef CAS PubMed.
- S. T. Al-Goul, H. S. AlSalem, M. S. Binkadem, M. A. El Hamd, W. T. Alsaggaf, S. F. Saleh, S. Sallam and M. A. Abdel-Lateef, J. Photochem. Photobiol., A, 2023, 445, 115028 CrossRef.
- C. Yang, X. Wang, H. Liu, S. Ge, M. Yan, J. Yu and X. Song, Sens. Actuators, B, 2017, 248, 639–645 CrossRef CAS.
- G. Peris-Pastor, C. Azorín, J. Grau, J. L. Benedé and A. Chisvert, TrAC, Trends Anal. Chem., 2023, 117434 Search PubMed.
- D. Raynie and J. Driver, Green assessment of chemical methods, 13th Green Chemistry Conference, Maryland-USA ASC, USA, 2009 Search PubMed.
- J. Płotka-Wasylka and W. Wojnowski, Green Chem., 2021, 23, 8657–8665 RSC.
- W. Wojnowski, M. Tobiszewski, F. Pena-Pereira and E. Psillakis, TrAC, Trends Anal. Chem., 2022, 149, 116553 CrossRef CAS.
- N. Manousi, W. Wojnowski, J. Płotka-Wasylka and V. Samanidou, Green Chem., 2023, 25, 7598–7604 RSC.
- P. M. Nowak, R. Wietecha-Posłuszny and J. Pawliszyn, TrAC, Trends Anal. Chem., 2021, 138, 116223 CrossRef CAS.
- K. Kiwfo, S. Suteerapataranon, I. D. McKelvie, P. M. Woi, S. D. Kolev, C. Saenjum, G. D. Christian and K. Grudpan, Microchem. J., 2023, 109026 CrossRef CAS.
Footnote |
| † Electronic supplementary information (ESI) available. See DOI: https://doi.org/10.1039/d4ra02613f |
| This journal is © The Royal Society of Chemistry 2024 |