 Open Access Article
New information about the cyclable capacity fading process of a pouch cell with Li-rich layered oxide cathodes†
Jinhong Luoab,
Jinghao Liuab,
Zilong Suab,
Hangfan Dongab,
Zhimin Renabc,
Guohua Liab,
Xiaopeng Qiabc,
Bo Hu *ab,
Wei Quan
 *ab and
Jiantao Wang*abc
aChina Automotive Battery Research Institute Co., Ltd, No. 11 Xingke Dong Street, Huairou District, Beijing, 101407, China. E-mail: quanwei@glabat.com
bGRINM Group Corporation Limited (GRINM Group), No. 2 Xinjiekou Wai Street, Xicheng District, Beijing, 100088, China
cGeneral Research Institute for Nonferrous Metals, No. 2 Xinjiekou Wai Street, Xicheng District, Beijing, 100088, China
First published on 17th July 2024
Abstract
Most studies investigate the cyclable capacity fading mechanism of Li-rich layered oxides (LLOs) from the microscopic structure level, lacking discussions about how the structure degradation influences the performance of the pouch cell precisely and quantitatively. Based on the analysis of the evolution of key parameters during the whole cycling period, a new transition-type fading mechanism is proposed. From the early-to-middle stage of the cycling period, polarization increases, most of which is interface-related, causing about 67% of the whole capacity loss. From the middle-to-late stage of the cycling period, active material losses turn out to be the dominating factor, inducing about 61% of the total capacity loss. Diffusion-related polarization, replacing the interface type, is responsible for most of the increased overpotential. Relative analysis confirms that during the early stage, the increase of the charge transfer resistance, induced by CEI (cathode electrolyte interface) growth and initial surface layered-structure degradation, is the main source of interface polarization. As the cycling evolves to the late stage, severe bulky structure degradation, including lattice-oxygen release, Li/Ni mixture and generation of a new spinel phase, turns out to be the major factor, causing further capacity fading.
Electrification of transportation is recognized as a key measure for decreasing the release of greenhouse gases and reducing the dependence on fossil fuels.1 However, the widespread adoption of electric vehicles (EVs) still faces challenges, of which range anxiety is one of the biggest.2 Developing lithium-ion batteries (LIBs) with novel high-energy density cathode materials is an important technological route to solve this problem.3 Right now, LLO is considered as one of the most promising cathode materials, due to its ultra-high specific capacity.4–8 Unfortunately, poor cycling stability has become one of the major obstacles restricting its practical applications. Abundant efforts have been devoted to analyzing the fading mechanism, but mostly from the perspective of intrinsic structure.5,9–11 Theories of how the structure degradation influences the cycling stability of full pouch cells precisely and quantitively are not clear. Whether the fading mechanism is always unchanged during the whole cycle life is still a mystery. Therefore, this article will employ LLO-based full pouch cells with practical design parameters and particularly focus on key parameters related to cycling stability, which are often neglected by former research studies, including detailed polarization evolution, exact cyclable capacity loss caused by different factors, and gas production, to improve the recognitions of the fading mechanism of LLO-based cells.
Cell preparation and characterization methods are described in the ESI.† The cycling performances of the pouch cells are presented in Fig. 1. Fig. 1a illustrates a typical S-type fading curve, with about 85% capacity left after cycling 500 times. Fig. 1b describes discharge curves during cycling. A constant voltage fading is observed, which is a typical characteristic feature of LLOs.9 Relative dQ/dV curves are presented in Fig. 1c. Peaks correspond to different reductions of the energy conversion process,12 with On−/O2− for P1, Ni4+/3+/2+ and Co4+/3+ for P2, and Mn4+/3+ for P3. P1 first shifts to the low-voltage region and later decreases sharply after the 250th, due to the increase of polarization or lattice oxygen evolution.6 P2 decreases significantly without position change, while P3 experiences a fast increase in peak intensity, regarded as a symbol of the phase change from a layered structure to spinel and rock-salt phases.9,10 According to the evolution of the dQ/dV curves, three cycle times, namely 1st, 200th, and 500th cycles, are selected to represent the early, middle, and late stages of the cycling period.
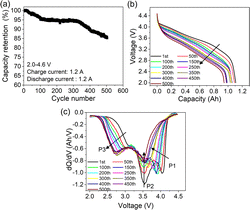 | ||
| Fig. 1 Capacity retention (a), discharge (b) and relative dQ/dV curves (c) with varying cycle numbers for the pouch cell. | ||
Polarization, as a significant feature related to cycling stability, is extracted and analyzed quantitively according to different responding time scales.13 One part that relaxes immediately after switching from the titration step to the relaxation step is termed “instant loss”, which typically involves more electrode-level transport such as electron percolation, Li+ transport in the soaked electrolyte and charge transfer resistance, with a response time of hundreds of milliseconds. The other part that relaxed slowly until the new equilibrium is established is termed “non-instant loss”, which includes the relaxation of concentration polarization in the electrolyte and more Li+ lattice diffusion inside the LLO particles, with a response time of more than hours. The “whole voltage loss” is defined as the sum of the instant loss and non-instant loss, representing the whole polarization degree. Relative characterization methods are introduced in the ESI.† The distribution of the whole voltage loss with SOC (state of charge) is shown in Fig. 2a. Instant loss and non-instant loss are manifested in Fig. 2b and c. All the curves presented are U-type, consistent with the recognition that the middle voltage range normally corresponds to the fast-kinetic region.12 Besides, the increasing extent is quite different. From the 1st to 200th cycle, the average of the whole voltage loss increases from 0.41 to 0.57 V, with an increase of about 0.16 V. As cycling proceeds, it further increases up to about 0.53 V, implying a dramatic increase of polarization in the late stage of the cycling period. Fig. 2b and c illustrate the contributions of instant and non-instant loss, respectively. The average value of instant-loss is about 0.13 V for the 1st, 0.25 V for the 200th and 0.43 V for the 500th cycle. Thus, from the 1st to the 200th cycle, the average increase of instant loss is about 0.12 V, contributing to about 75% of the whole polarization added, while from the 200th to the 500th cycle, the increase of the non-instant loss is about 0.36 V, representing about 68% of the whole overpotential increase. This trend can also be proved by the evolution of the contributing proportions of instant and non-instant loss in the whole voltage loss during cycling, as is shown in Fig. S1 (ESI†). It should be noted that after cycling over 500 times, values may appear slightly exaggerated due to the influence of the anode, which cannot be entirely disregarded. Therefore, it can be deduced that from the early-to-middle stage of the cycling period that interface-related polarization is the main source of the whole polarization increase. As the cycling proceeds to the late stage, diffusion-related polarization, replacing instant polarization, turns out to be dominant the overpotential increase.
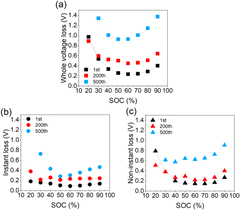 | ||
| Fig. 2 (a) Whole voltage loss, (b) instant loss, and (c) non-instant loss of the cells with different cycle numbers. | ||
To refine and support the polarization analysis, impedance and diffusion coefficients were characterized. The impedance results of the pouch cells in Fig. 3a show that all of the curves consist of two semicircles and a subsequent straight line. The equivalent circuit is described inside the picture, and fitting values are listed in Table S1 (ESI†). Although these kinetical parameters involve contributions of the cathode and anode, it is rational to infer that the change of the values is mainly due to the cathode, as the graphite anode is relatively stable compared to the LLO cathode.14 The results in Table S1 (ESI†) prove that the increase of Rct (charge transfer resistance) is the main source of the inner resistance added during the whole cycle life. Furthermore, the increasing rate is larger for the first 200 cycles compared to the last 300 cycles, which is consistent with the polarization analysis. Deep analysis of the increase of Rct will be discussed next combined with further characterizations. The diffusion coefficients of Li+ are calculated with the method described in the ESI.† The results in Fig. 3b show that from the 1st to the 200th cycle, the diffusion coefficient has dropped from an average of about 1.75 × 10⁻¹¹ to 1.30 × 10⁻¹¹ cm2 s−1 between 40% and 90% SOC. We also notice that when the SOC is below 40%, the coefficients even increase a bit, in agreement with Fig. 1c. From the 200th to 500th cycle, the diffusion coefficients experience a significant drop to an average of about 3.0 × 10⁻¹¹ cm2 s−1, corresponding to the dramatic increase of the non-instant polarization.
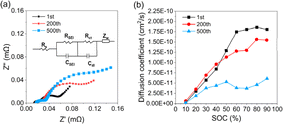 | ||
| Fig. 3 (a) EIS of the pouch cells; (b) the diffusion coefficients of the cathodes cycled 1 200 and 500 times. | ||
Aside from kinetical factors, active material loss during the cycling process can also induce capacity fading. Coin cells with electrodes retrieved from the pouch cells are assembled to assess accurate residual active materials. The current density of 0.16 mA cm−2 is used in the test to eliminate polarization interference as much as possible. The results in Fig. 4a show that the specific capacity of the electrode cycled 200 times has recovered to about 98.3% of that of the fresh one, while the electrode cycled 500 times has recovered about 91.1%. Thus, it can be roughly deduced that the ratio of cyclable capacity loss attributed to the active material loss is about 1.7% for the 200th and 8.9% for the 500th cycle, respectively. Relative dQ/dV curves are presented in Fig. 4b. An interesting phenomenon is observed that P1 that disappeared in Fig. 1b has reappeared. Besides, the position of the three peaks is almost the same, different from Fig. 1c. These changes imply that the reduction of O2−/On− in the high-voltage range is still active, but limited by sluggish kinetics after cycling 500 times. P2 and P3 present the same trend as in Fig. 1b, confirming again the occurrence of a phase change inside the layered structure. Surprisingly, a new slight peak, P0, at about 4.3 V emerges, which is likely a sign of newly generated spinel Li4Mn5O12.15,16 Based on the quantitative analysis of polarization and active material loss, the contributing proportions of different factors inducing the cyclable capacity fading can be derived, as listed in Table 1. From the early-to-middle stage of the cycling period, kinetics polarization causes about 3.4% capacity loss, approaching 67% of the whole capacity loss. From the middle-to-late stage of the period, active material loss induces about 8.9% capacity loss, occupying nearly 61% of the total loss.
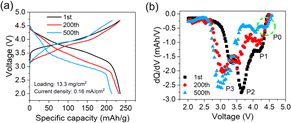 | ||
| Fig. 4 (a) Charge and discharge and (b) dQ/dV curves of coin cells with electrodes retrieved from the cycled pouch cell. | ||
| Cycle number | Capacity loss | Polarization loss | Active material loss | |
|---|---|---|---|---|
| Interface-related | Diffusion-related | |||
| 1 | 0% | 0% | 0% | 0% |
| 200 | 5.1% | 2.6% | 0.8% | 1.7% |
| 500 | 14.6% | 1.8% | 3.9% | 8.9% |
Inconspicuous gas production of the pouch cell during cycling is also characterized. The gas volume versus time is manifested in Fig. 5a. For the first 100 cycles, the gas volume accumulates rapidly, reaching about 7.2 mL. Then, it increases slowly until the end of cycling, with a total volume of about 8.8 mL. Some gases are consumed when the cell is cycled about 50 times, which can be attributed to the cross-talk effects of the gases.17,18 As the gases are mainly produced from side reactions at the cathode,19 it can be inferred that the early stage of cycling is the main period when the side reactions occur and the CEI grows, releasing over 80% of the total gases, while during the latter period, the rate of CEI growth becomes slower due to self-limiting effects.20 Fig. 5b compares the proportional change of the gas component during cycling. The ratio of CO2 reaches about 46% after the cell is cycled 200 times and adds up to about 64% at the end of the period, meaning successive oxidative reactions on the cathode and the decrease of the CO2 consumption at the anode.18 O2, the direct signal of the lattice-oxygen emission process, is also tested. The results show that the ratio increases from about 2.9% to 4.4%, proving that oxygen release or layered structure degradation occurs throughout the whole cycling period and becomes more severe during the late stage of cycling.
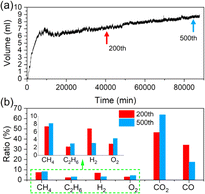 | ||
| Fig. 5 (a) Gas volume produced from the pouch during the whole cycling period. (b) Component ratios of the gas produced from the cells cycled 200 and 500 times. | ||
To obtain more information about the evolution of the cathode interface, we conducted scanning electron microscopy (SEM) and X-ray photoelectron spectroscopy (XPS) tests. SEM images in Fig. S2 (ESI†) reveal that the surface becomes more rough with thick deposits covering the surface during cycling, due to the decomposition of electrolytes.21 Fig. 6a–c present the fitting peaks of C 1s orbit spectra. The peak at a binding energy of 288.5 eV corresponds to the O–C![[double bond, length as m-dash]](https://www.rsc.org/images/entities/char_e001.gif) O of carbonate products. Its intensity increased during the whole cycling period, meaning the continuous decomposition of the electrolytes. Fig. 6d–f illustrate O 1s orbit signals. The peak at a binding energy of 529 eV represents lattice oxygen in O–M. Its position shifted gradually to lower binding energy during cycling, implying that lower valence of transition metals is generated during phase changes.11,22 Besides, the intensity of O–M decreased significantly for the electrodes cycled 500 times, which may be ascribed to the limited detection depth of XPS that cannot penetrate the thicker CEI.23 Further evidence of the surface structure degradation can be obtained from the XPS peaks of Mn 2p and Ni 2p in Fig. S3 and S4 (ESI†). The constant increase of the Mn3+ peak during the whole cycling period demonstrates the generation of spinel phase. The significant decrease of the Ni2+ peak observed, especially during the late stage, suggests a severe Li/Ni mixture problem at the end of the cycle life,24 which is also consistent with our previous work.25
O of carbonate products. Its intensity increased during the whole cycling period, meaning the continuous decomposition of the electrolytes. Fig. 6d–f illustrate O 1s orbit signals. The peak at a binding energy of 529 eV represents lattice oxygen in O–M. Its position shifted gradually to lower binding energy during cycling, implying that lower valence of transition metals is generated during phase changes.11,22 Besides, the intensity of O–M decreased significantly for the electrodes cycled 500 times, which may be ascribed to the limited detection depth of XPS that cannot penetrate the thicker CEI.23 Further evidence of the surface structure degradation can be obtained from the XPS peaks of Mn 2p and Ni 2p in Fig. S3 and S4 (ESI†). The constant increase of the Mn3+ peak during the whole cycling period demonstrates the generation of spinel phase. The significant decrease of the Ni2+ peak observed, especially during the late stage, suggests a severe Li/Ni mixture problem at the end of the cycle life,24 which is also consistent with our previous work.25
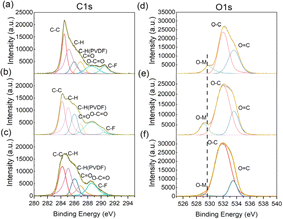 | ||
| Fig. 6 XPS spectra of the CEI from cathode electrodes with different cycle numbers ((a and d) for the 1st, (b and e) for the 200th, (c and f) for the 500th cycle). | ||
Based on all discussions above, a new transition-type cyclable capacity fading mechanism of the pouch cells with the LLOs is concluded. From the early-to-middle stage of the cycling period, the increase of the polarization is the main factor causing capacity fading, contributing to nearly 67% of the whole capacity loss. Particularly, interface-related polarization is responsible for most of the total overpotential increase, approaching about 75%. Meanwhile, it is the period when most gas production occurs, releasing over 80% of the total gases. Combined with XPS signals, it can be deduced that interface CEI growth from electrolyte oxidations and surface layered-structure degradation induced by the generation of a new spinel phase during the early stage are two reasons for the increase of Rct and interface polarization. From the middle-to-late stage of the cycling period, active material loss induced by inner structure degradation becomes the dominating factor for further capacity fading, contributing to about 61% of the whole loss. Accordingly, diffusion-related polarization, replacing interface reaction polarization, becomes the major source of the whole overpotential increase, with a ratio of about 68%. Significantly, the increased ratio of O2 in gas production and left-shifting of the XPS peak of lattice-oxygen and signals of more severe Li/Ni mixing, together confirm this transition process. These new findings will not only inspire novel material modifications but also accelerate practical application via locating specific scenarios that meet the special features of the LLO-based cells.
Data availability
The data that support the findings of this study are available upon request from the corresponding author (Wei Quan, E-mail: quanwei@glabat.com). The data supporting this article have been included as part of the ESI.† Part of the raw data and processed data generated during the study are not publicly available due to privacy concerns related to participant confidentiality but are stored securely in the China Automotive Battery Research Institute Co., Ltd. For readers interested in accessing the data, please provide a brief description of the requested data, the research purposes, and the intended use. Requests will be reviewed, and subject to any legal or ethical considerations, the data may be shared under a data-sharing agreement that complies with the policies of China Automotive Battery Research Institute Co., Ltd. Please note that due to the nature of the study, certain data collected from human participants cannot be shared. However, all methods and summary statistics necessary to understand and replicate the study findings are included in the article.Author contributions
Jinhong Luo: investigation, formal analysis. Jinghao Liu: resources. Zilong Su: resources. Hangfan Dong: investigation. Zhimin Ren: resources. Guohua Li: resources. Xiaopeng Qi: resources, editing. Bo Hu: investigation, formal analysis, editing. Wei Quan: conceptualization, formal analysis, writing-review & editing. Jiantao Wang: supervision.Conflicts of interest
There are no conflicts to declare.Acknowledgements
This work was supported by Low Cost Cathode Material (TC220H06P) and the National Natural Science Foundation of China (Grant No. 22005264).Notes and references
- A. Mahmoudzadeh Andwari, A. Pesiridis, S. Rajoo, R. Martinez-Botas and V. Esfahanian, Renewable Sustainable Energy Rev., 2017, 78, 414–430 CrossRef.
- P. Chakraborty, R. Parker, T. Hoque, J. Cruz, L. Du, S. Wang and S. Bhunia, Sci. Rep., 2022, 12, 5588 CrossRef CAS PubMed.
- S. Dühnen, J. Betz, M. Kolek, R. Schmuch, M. Winter and T. Placke, Small Methods, 2020, 4, 2000039 CrossRef.
- M. H. Rossouw, D. C. Liles and M. M. Thackeray, J. Solid State Chem., 1993, 104, 464–466 CrossRef CAS.
- D.-H. Seo, J. Lee, A. Urban, R. Malik, S. Kang and G. Ceder, Nat. Chem., 2016, 8, 692–697 CrossRef CAS PubMed.
- J.-H. Song, G. Yoon, B. Kim, D. Eum, H. Park, D.-H. Kim and K. Kang, Adv. Energy Mater., 2020, 10, 2001207 CrossRef CAS.
- A. Grimaud, W. T. Hong, Y. Shao-Horn and J. M. Tarascon, Nat. Mater., 2016, 15, 121–126 CrossRef CAS.
- J. Xu, M. Sun, R. Qiao, S. E. Renfrew, L. Ma, T. Wu, S. Hwang, D. Nordlund, D. Su, K. Amine, J. Lu, B. D. McCloskey, W. Yang and W. Tong, Nat. Commun., 2018, 9, 947 CrossRef PubMed.
- T. Liu, J. Liu, L. Li, L. Yu, J. Diao, T. Zhou, S. Li, A. Dai, W. Zhao, S. Xu, Y. Ren, L. Wang, T. Wu, R. Qi, Y. Xiao, J. Zheng, W. Cha, R. Harder, I. Robinson, J. Wen, J. Lu, F. Pan and K. Amine, Nature, 2022, 606, 305–312 CrossRef CAS PubMed.
- K. A. Jarvis, Z. Deng, L. F. Allard, A. Manthiram and P. J. Ferreira, Chem. Mater., 2011, 23, 3614–3621 CrossRef CAS.
- T. Lin, T. U. Schulli, Y. Hu, X. Zhu, Q. Gu, B. Luo, B. Cowie and L. Wang, Adv. Funct. Mater., 2020, 30, 1909192 CrossRef CAS.
- N. Hu, Y. Yang, L. Li, Y. Zhang, Z. Hu, L. Zhang, J. Ma and G. Cui, Energy Environ. Mater., 2024, 7, e12610 CrossRef CAS.
- T. DuBeshter and J. Jorne, J. Electrochem. Soc., 2017, 164, E3539 CrossRef CAS.
- D. Andre, M. Meiler, K. Steiner, C. Wimmer, T. Soczka-Guth and D. U. Sauer, J. Power Sources, 2011, 196, 5334–5341 CrossRef CAS.
- Y. Liu, G. Liu, H. Xu, Y. Zheng, Y. Huang, S. Li and J. Li, Chem. Commun., 2019, 55, 8118–8121 RSC.
- W. Zhu, Z. Tai, C. Shu, S. Chong, S. Guo, L. Ji, Y. Chen and Y. Liu, J. Mater. Chem. A, 2020, 8, 7991–8001 RSC.
- B. Rowden and N. Garcia-Araez, Energy Rep., 2020, 6, 10–18 CrossRef.
- D. J. Xiong, L. D. Ellis, R. Petibon, T. Hynes, Q. Q. Liu and J. R. Dahn, J. Electrochem. Soc., 2017, 164, A340 CrossRef CAS.
- S. L. Dreyer, A. Kondrakov, J. Janek and T. Brezesinski, J. Mater. Res., 2022, 37, 3146–3168 CrossRef CAS.
- P. Peljo and H. H. Girault, Energy Environ. Sci., 2018, 11, 2306–2309 RSC.
- J. Li, L. Xing, L. Zhang, L. Yu, W. Fan, M. Xu and W. Li, J. Power Sources, 2016, 324, 17–25 CrossRef CAS.
- H. Peng, S.-X. Zhao, C. Huang, L.-Q. Yu, Z.-Q. Fang and G.-D. Wei, ACS Appl. Mater. Interfaces, 2020, 12, 11579–11588 CrossRef CAS.
- M. J. Powell, I. J. Godfrey, R. Quesada-Cabrera, D. Malarde, D. Teixeira, H. Emerich, R. G. Palgrave, C. J. Carmalt, I. P. Parkin and G. Sankar, J. Phys. Chem. C, 2017, 121, 20345–20352 CrossRef CAS.
- J. Zheng, M. Gu, J. Xiao, P. Zuo, C. Wang and J.-G. Zhang, Nano Lett., 2013, 13, 3824–3830 CrossRef CAS.
- G. Li, Z. Ren, A. Li, R. Yu, W. Quan, C. Wang, T. Lin, D. Yi, Y. Liu, Q. Zhang, J. Wang, H. Yu and X. Sun, Nano Energy, 2022, 98, 107169 CrossRef CAS.
Footnote |
| † Electronic supplementary information (ESI) available: Details of experimental procedures. See DOI: https://doi.org/10.1039/d4ra02472a |
| This journal is © The Royal Society of Chemistry 2024 |
