 Open Access Article
Preparation of hydroxyapatite and its elimination of excess fluoride from aqueous solution†
Yiming Zouabcd,
Yaoting Wangabcd,
Junfu Wangabcd,
Song Wangabcd,
Li Chenabcd,
Yu Xiabcd,
Ruliang Xie*abcd,
Jie Yang*bc and
Xin Xiao *cd
*cd
aJiangsu Key Laboratory of Marine Bioresources and Environment, Jiangsu Ocean University, Lianyungang 222005, China. E-mail: xieruliang2007@163.com
bSchool of Ocean Food and Biological Engineering, Jiangsu Ocean University, Lianyungang 222005, China. E-mail: yangjie@jou.edu.cn
cJiangsu Institute of Marine Resources Development, Lianyungang 222005, China. E-mail: xiaoxin@njust.edu.cn
dJiangsu Key Laboratory of Function Control Technology for Advanced Materials, Jiangsu Ocean University, Lianyungang 222005, China
First published on 19th August 2024
Abstract
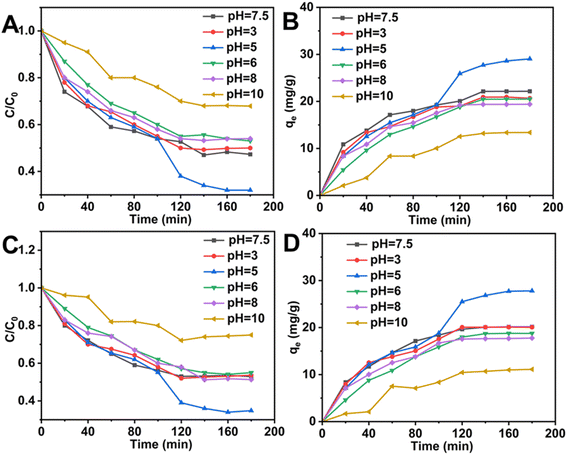
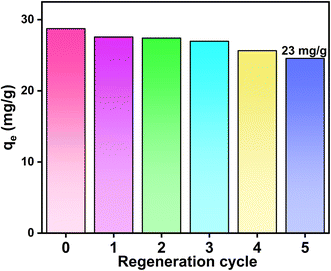
Excess fluoride in aqueous solutions can significantly affect dental and bone health. This study used two methods to prepare hydroxyapatite to remove fluoride ions from water. The experiments showed that the adsorption capacity and removal rate of hydroxyapatite (Xq-HAP) prepared by the novel method were higher than for the hydroxyapatite (Yt-HAP) prepared by the conventional method. The maximum fluoride ion trapping capacity of Xq-HAP could reach 29.04 mg g−1 under the conditions of pH = 5 and an F ion concentration of 10 mg L−1. The materials were characterized by SEM, XRD, BET, XPS, and FTIR. An investigation was conducted to examine the impact of contact time, adsorbent dosage, fluoride concentration, solution pH, temperature, and several other parameters on the removal of fluoride. Adsorption equilibrium was reached in approximately 3 h at an initial fluoride concentration of 10 mg L−1. It can be seen that the adsorbent has a faster ability to trap fluoride ions. The adsorption kinetics and Langmuir isotherm indicated that fluoride ion adsorption is a monolayer chemisorption process. Further characterization and kinetic studies indicated that the removal mechanism involves ion exchange, electrostatic interactions, and complexation. After five adsorption cycles, the adsorption capacity reaches 23 mg g−1.
1. Introduction
Heavy metals discharged into water bodies through industrial operations and human activities, even at trace levels, are considered a significant risk with long-term effects.1 Fluorine is an element widely found in nature and is a trace element essential for human growth. The World Health Organization (WHO) has stipulated the maximum permissible concentration of fluoride as 1.0 mg L−1 in the Hygienic Standard for Drinking Water for Domestic Use (GB 5749-2022).2 Fluoride contamination of natural water has become a global problem because the semiconductor, electroplating, metallurgical, and ceramic industries discharge high concentrations of fluoride-containing wastewater. Some domestic factories involved in fluoride wastewater treatment have imperfect technology and equipment, resulting in the concentration of fluoride ions in the discharged wastewater being much higher than the national emission standards.3 Groundwater has been reported to be contaminated with high fluoride concentrations in some parts of the world, including Asia, Africa, Europe, and the Americas.4 Fluoride-containing wastewater discharged more than the standard enters surface water through the scouring of surface runoff, and the long-term intake of excessive fluoride can cause the chronic disease fluorosis,5 which has a significant impact on the structure and function of the human skeletal system, teeth, skeletal muscles, brain, and spinal cord,6 and is hazardous to human health.Therefore, rapid and effective technologies for treating excess fluoride in water are urgently needed.7 Fluoride removal methods include the precipitation method,8 ion exchange method,9 membrane separation method10, and adsorption method.11 The adsorption method has excellent potential for fluoride removal because of its advantages of low cost, simple operation, high removal rate, and reusable adsorbents.12 From the classification of adsorbents, various adsorbents have been used in fluoride removal treatment, including apatite, activated carbon, activated alumina, biosorbent, nano-sorbent, and so on.13 However, conventional adsorbents have disadvantages, such as few activation sites, poor treatment effect, weak affinity, low adsorption capacity, and their applications are limited.14 Hydroxyapatite (Ca10(PO4)6(OH)2), which has low water solubility, low cost, high stability, easy accessibility, and good adsorption capacity, has now become a suitable material for the adsorption of fluoride ions in water.15 The main adsorption mechanisms of hydroxyapatite are electrostatic interactions, ion exchange, acid–base interactions, surface complexation, and dissolution16/precipitation.17 Related experiments showed that the adsorption of fluoride ions decreases under acid–base conditions, and therefore, the study of solution pH is of great significance in the process of fluoride removal.18 Furthermore, HAP has demonstrated exceptional efficacy in various catalytic applications, including environmental catalysis, energy catalysis, chemical synthesis catalysis, biocatalysis, and photocatalysis.19,20 HAP is a catalyst that can fulfill these requirements. In organic synthesis, it can serve as a bifunctional acid–base catalyst for various organic reactions, such as esterification, amidation, and dehydration condensation. The acidity and basicity of its surface can regulate the reaction pathway, improving selectivity and yield.21 A method was devised to gently remove the protective layer from alkylthio-gold nanoclusters (Au NCs) on hydroxyapatite (HAP) using hydrogen peroxide (H2O2) as the oxidizing agent. After oxidation, the thiol ligands on the supported Au NCs were removed, and the size and integrity of the supported Au were well preserved.22 By pyrolyzing chicken bone waste at different temperatures (400 °C, 500 °C, 650 °C, and 800 °C), the influence of carbon residues in the bone marrow on the dispersion of Cu species introduced via impregnation with Cu(NO3)2 solution was investigated. The results indicated that the hydroxyapatite formed after the pyrolysis of chicken bones was relatively stable, making the catalyst exhibit good activity and reusability.23
Most mussel shells are calcium carbonate with a content of up to 95% and contain small amounts of protein and polysaccharide substances.24 The shell structure exhibits aragonite, calcite, spherical aragonite, and amorphous calcium carbonate,25 which can be categorized in order of their stability from low to high: spherical aragonite, aragonite, and calcite.26 Therefore, it can be used as an excellent green calcium source for the preparation of hydroxyapatite. Currently, the utilization of shellfish is limited to the edible portion, whereas the shell portion is seldom processed or utilized.27 In 2012, the annual production of mussels in China amounted to 5 × 10⁵ tons, and the shells of mussels, which accounted for more than 1/3 of the weight of mussels, were discarded, and only one year could produce 1.5 × 10⁵ to 1.8 × 10⁵ tons.28 The accumulation of large quantities of shells has caused severe pollution of land and air, and owing to the difficulty of natural decomposition, it has become a severe environmental problem in some areas of the southeastern coast of China. At the same time, the accumulated shells are a waste of resources. Owing to its robust ion exchange and biocompatibility,29 HAP is regarded as a potential adsorbent. Therefore, using hydroxyapatite for wastewater treatment is essential for environmental protection and human health.
This study presents a process for preparing rod-shaped hollow hydroxyapatite using mussel shells as a template and adjusting the reaction time. This study aimed to synthesize HAP particles with fluoride ion adsorption performance. The effects of the contact time, adsorbent dosage, initial concentration, reaction temperature, and solution pH on the adsorption of fluoride ions by HAP were examined. The suitability of rod-shaped HAP as an adsorbent was investigated by determining the adsorption isotherms and kinetic parameters. This study reveals that the adsorption of fluoride ions from aqueous solutions by rod hydroxyapatite particles paves the way for future research on more efficient and economical means of wastewater pollution purification.
2. Experimental
2.1 Materials
(NH4)2HPO4 (99%), HCl (99%), NaOH (99%), C3COOH (99%), and NaF (99%) were purchased from Shanghai McLean Co. All chemicals were of analytical grade and were used without further purification. Mussel shells were collected from the coastal edge of Lianyungang.2.2 The synthesis of Xq-HAP and Yt-HAP
2.3 Characterizations
The phase structure was determined via powder X-ray diffraction (XRD) using a RINT 2000 diffractometer (Rigaku) with Cu Kα radiation. The morphology of the product was determined using a Hitachi S-4800 field-emission scanning electron microscope (SEM) and a JEOL JEM 2100F transmission electron microscope (TEM). The Brunauer–Emmett–Teller (BET) surface areas were determined using a Micromeritics ASAP 2460 instrument. X-ray photoelectron spectra (XPS) were recorded using a Thermo ESCALAB 250XI instrument. The specific surface areas and porosities of the samples were measured at 77 K using an N2 adsorption analyzer (Micromeritics ASAP 2020 Plus). Fourier-transform infrared spectroscopy (FT-IR, nanoIR3-s) was used to analyze the characteristic functional groups on the HAP surface.2.4 Adsorption experiments
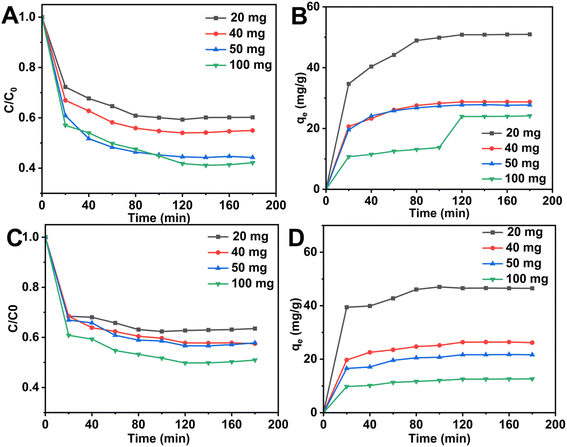
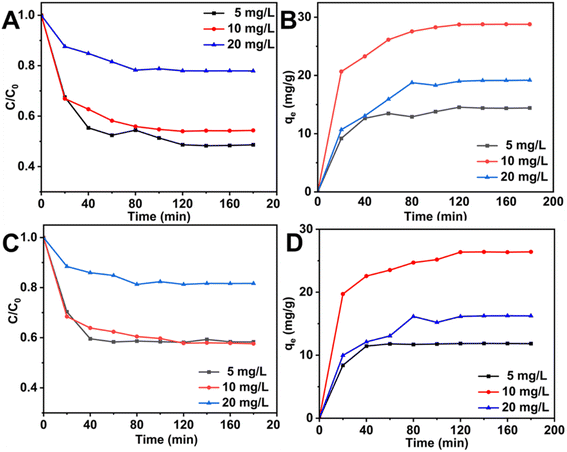
All adsorption experiments were carried out in 100 mL conical flasks containing 50 mL of NaF solution and 50 mg of HAP adsorbent. The relationship between time and adsorption capacity was investigated using adsorption experiments at an initial fluorine concentration of 10 mg L−1. The fluoride ion concentration in the samples was measured using a PXSJ-226T ion meter and the adsorption capacity was calculated. The adsorption primary kinetics, secondary kinetics, and internal diffusion adsorption models were plotted to conduct a kinetic study. Adsorption isotherms were simulated at initial NaF concentrations of sodium fluoride ranging from 10 to 100 mg L−1. These conical flasks were placed in a shaker at temperatures (25 °C, 35 °C, and 45 °C) and a rotational speed of 150 rpm. Moreover, the residual fluoride ion concentration was measured after a certain period, and the adsorption capacity was calculated by fitting curves through Langmuir and Freundlich models. To investigate the effects of pH on the effectiveness of the adsorbent in removing fluorine, the pH was adjusted using 0.1 mol of HCl and NaOH solution. In the cyclic adsorption experiment, 0.5 mol L−1 NaOH and 0.5 mol L−1 NaCO3 solution was selected as the desorption liquid, and its adsorption capacity was calculated after five experiments to judge its recycling capacity. The adsorption capacity (qe, mg g−1) was calculated using the following equation:where C0 (mg L−1) and Ce (mg L−1) are the initial and equilibrium concentrations of the fluoride solution, respectively; V (L) is the volume of the solution, and m (g) is the mass of the adsorbent.
3. Results and discussion
3.1 Characterization
Fig. 2 shows the XRD patterns of Xq-HAP and Yt-HAP. The prominent diffraction peaks of hydroxyapatite appear at 2θ = 22.8°, 25.9°, 28.9°, 31.7°, 32.3°, 32.9°, 34.04°, and 35.4°, corresponding to the (111), (002), (210), (211), (112), (300), (202), and (301) crystal planes, respectively. All intensity peaks in the XRD spectrum of the hydroxyapatite powder are in perfect agreement with the structural data of hydroxyapatite, and the pattern is consistent with the hexagonal crystal structure of hydroxyapatite (JCPDS No. 09-0432).The morphology of the Xq-HAP is shown in Fig. 3(A–D), a rock structure with a rough surface. A rough surface makes the adsorption performance more stable, and fluoride is less likely to come off. The diameters of these structures range from about 25–50 nm, with an average value of approximately 35 nm. As shown in Fig. 3(E and F), Yt-HAP exhibited an irregular clustered structure, and some clusters and agglomerates with rod-like structures were also observed. The EDS elemental surface sweep of Xq-HAP is shown in Fig. 3(G–J), and C, O, P, and Ca were uniformly distributed on the surface of Xq-HAP. The point-scan plot of the EDS elements of Xq-HAP is shown in Fig. 3(k), and C, O, P, and Ca were also distributed on the surface of Xq-HAP.
 | ||
| Fig. 3 (A–D) Xq-HAP SEM images, (E and F) Yt-HAP SEM images, (G–J) EDS elemental mapping for C, Ca, O and P respectively. (K) EDS spectrum of Xq-HAP. | ||
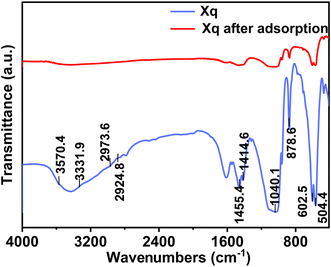
Infrared spectroscopy is an essential way to study the changes in functional groups before and after adsorption. As shown in Fig. 4, the phosphate PO43− vibrational modes typically exhibit absorption peaks at 900–1200 cm−1. The stretching vibration of the P–O bond may cause the peak to appear at approximately 1040 cm−1. There is a possibility of ion exchange between the phosphate ion PO43− in Xq-HAP and fluoride ions in the solution. Since fluoride ions have a smaller ionic radius and a higher charge density, they are more likely to bind to Ca2+ on the surface of hydroxyapatite, thereby replacing some of the phosphate ions and generating a CaF2 precipitate. The broad peak at 3570.4 cm−1 is the absorption peak of the stretching vibration of the O–H bond in Xq-HAp, and the characteristic peak of the hydroxyl group almost disappeared after adsorption, which suggests that F− was ion-exchanged with OH−. During the adsorption process, the hydroxyl groups on the surface of hydroxyapatite may react chemically with fluoride ions to form new chemical bonds, leading to changes in the characteristic peaks of the hydroxyl groups and the appearance of new peaks. Through the analysis of infrared spectrograms, the characteristic peaks of phosphate ions and hydroxyl groups changed before and after the adsorption of Xq-HAP, indicating that the adsorption process was a chemical reaction dominated by ion exchange, revealing the mechanism of the fluoride ions adsorbed by hydroxyapatite.
XPS characterization was used to analyze the chemical states of three elements, Ca, O, and P, on the surface of Xq-HAP. The XPS spectrum of Xq-HAP is shown in Fig. S1.† The two peaks of elemental carbon correspond to 284.97 eV and 289.52 eV, respectively, and the binding energies correspond to the chemical bonding of C–C or C![[double bond, length as m-dash]](https://www.rsc.org/images/entities/char_e001.gif) C or C
C or C![[double bond, length as m-dash]](https://www.rsc.org/images/entities/char_e001.gif) O, respectively. The two characteristic peaks are located at 347.39 eV and 350.98 eV, attributed to the 2p3/2 and 2p1/2 orbitals of Ca, respectively, which coincide with the typical binding energies of the Ca element. The single peak of P corresponds to a binding energy of 133.45 eV, which is the characteristic binding energy of the P element in Xq-HAP. In addition, the binding energy of O 1s is 531.38 eV, which is attributed to OH−, and the ratio of the peak areas of Ca and P elements is approximately 1.67, indicating that the prepared Xq-HAP material is pure, well-structured, and hard.
O, respectively. The two characteristic peaks are located at 347.39 eV and 350.98 eV, attributed to the 2p3/2 and 2p1/2 orbitals of Ca, respectively, which coincide with the typical binding energies of the Ca element. The single peak of P corresponds to a binding energy of 133.45 eV, which is the characteristic binding energy of the P element in Xq-HAP. In addition, the binding energy of O 1s is 531.38 eV, which is attributed to OH−, and the ratio of the peak areas of Ca and P elements is approximately 1.67, indicating that the prepared Xq-HAP material is pure, well-structured, and hard.
Fig. 5(A and B) shows the N2 adsorption and desorption curves of the two adsorbent materials, and it can be seen that the adsorption curves of the two materials conform to the IV-type curves, which indicates that the pore columns in the materials are micropores. As shown in Table 1, the specific surface area of Yt is 42.6 m2 g−1, which is higher than that of Xq (35.3 m2 g−1 and the pore volume of Yt (0.122 m3 g−1) was also higher than that of Xq (m3 g−1). However, Xq possesses a larger average pore size, indicating that Xq mediates more pore structure than Yt material. Fig. 5(B) shows the pore-size distributions of the two materials. Both exhibit multistage pore structures, and mediator pore structures play a significant role in adsorption. These multistage pore structures facilitate the adsorption of pollutant molecules.
 | ||
| Fig. 5 (A) Nitrogen adsorption–desorption isotherms and (B) the BJH pore-size distribution curve of Xq-HAP and Yt-HAP at different reaction time. | ||
| Sample | SBET (m2 g−1) | Smicr (m2 g−1) | Vtotal (m3 g−1) | Daverage (nm) |
|---|---|---|---|---|
| Yt | 42.6 | 1.8 | 0.122 | 13.5 |
| Xq | 35.3 | 1.6 | 0.115 | 14.8 |
3.2 Adsorption property
| Sample | Adsorption capacity (mg g−1) | Adsorption condition | References |
|---|---|---|---|
| Carbonaceous materials | 0.8–3.5 | 20 mg L−1, 20 mL, 200 mg, shake, 3 h | 30 |
| Chitosan beads | 1.8 | 10 mg L−1, 50 mL, 250 mg, shake, 1 h | 31 |
| Shell@fluorapatite nanoarray | 15 | 10 mg L−1, 50 mL, 10 mg, shake, 20 min | 32 |
| CeO2@SiO2 microspheres | 32.24 | 50 mg L−1, 100 mL, 150 mg, shake, 2 h | 33 |
| Highly activated alumina media | 7.47 | 10 mg L−1, 10 mL, 10 mg, shake, 24 h | 34 |
| Xq-HAP | 29.04 | 10 mg L−1, 50 mL, 50 mg, shake, 2 h | This work |
ln(qe − qt) = ln![[thin space (1/6-em)]](https://www.rsc.org/images/entities/char_2009.gif) qe − k1t qe − k1t |
| qt = k3t0.5 + c |
As shown in Fig. 7(A), during the first 60 min, the adsorbent material had sufficient and available active sites, the adsorption drive was high, and the adsorption rate was high. The adsorption rate slowed slightly from 60 to 120 min, which is attributed to the diffusion of fluoride ions on the surface of the adsorbent into the pores, resulting in a large number of active sites exposed on the adsorbent surface being occupied by fluoride. After 180 min, the adsorption capacity gradually reached equilibrium and the maximum adsorption capacity reached 28.74 mg g−1. As shown in Fig. 7B, C and Table 3, Xq-HAP was more in line with the model of the proposed second-order dynamics, where the model correlation coefficient of the proposed second-order dynamics (R2) was 0.9975. The correlation coefficients were all higher than the corresponding value of 0.9763 for the proposed one-level kinetic model, and it can be inferred that the adsorption of fluorine by Xq-HAP is mainly a chemisorption effect. As shown in Fig. 7(D), the effect of the internal diffusion model fitting indicates that adsorption on the adsorbent surface of Xq-HAP and the diffusion process into the pores jointly affect the adsorption efficiency during the adsorption process. This finding agrees with the results reported in numerous studies.
 | ||
| Fig. 7 (A) Adsorption capacity curve with time, (B) the quasi first-order dynamics, (C) the pseudo-second order kinetic, and (D) internal diffusion model. | ||
| Adsorbent | Quasi first-order dynamics | Pseudo-second order kinetic | ||||
|---|---|---|---|---|---|---|
| K1 | Qe (mg g−1) | R2 | K2 | Qe (mg g−1) | R2 | |
| Xq | 0.036 | 19.95 | 0.9763 | 0.0316 | 31.65 | 0.9975 |
Langmuir adsorption isotherms:
Freundlich adsorption isotherm:
Temkin adsorption isotherm:
qe = b![[thin space (1/6-em)]](https://www.rsc.org/images/entities/char_2009.gif) ln ln![[thin space (1/6-em)]](https://www.rsc.org/images/entities/char_2009.gif) a + b a + b![[thin space (1/6-em)]](https://www.rsc.org/images/entities/char_2009.gif) ln ln![[thin space (1/6-em)]](https://www.rsc.org/images/entities/char_2009.gif) ce ce |
As shown in Fig. 10 and Table 4, the Langmuir model fit of Xq-HAP had correlation coefficients as high as 0.9978, and the maximum adsorption capacity was calculated to be 47.16 mg g−1 according to the theoretical. The Langmuir model is closer to the actual adsorption process than the Freundlich model, which has a correlation coefficient of 0.9611, and 1/n < 1 is considered as a measure of favorable or unfavorable adsorption in the Freundlich model. Therefore, it can be concluded that the Xq-HAP material exhibits significant advantages in fluoride adsorption, and its adsorption process exhibits homogeneous surface properties. Careful analysis revealed that the Xq-HAP material exhibited monolayer adsorption when fluoride was adsorbed. The Temkin adsorption isotherm model was used to study the effects of high fluoride concentrations, and the Xq-HAP correlation coefficient was 0.9152, suggesting that the vast majority of the process was chemisorption, with electrostatic adsorption in the physical adsorption serving as a supporting effect. Due to their comparable ionic radii, F− can engage in ion exchange with OH− and Ca2+. This results in the formation of a complex fluorine-based apatite.
| Adsorbent | Langmuir model | Freundlich model | ||||
|---|---|---|---|---|---|---|
| qmax (mg g−1) | KL (L mg−1) | R2 | KF (mg1−n Ln g−1) | 1/n | R2 | |
| Xq-HAP | 47.16 | 0.2294 | 0.9978 | 0.133 | 0.331 | 0.997 |
3.3 Stability of materials
Fig. 12(A–C) reveals that the material maintained its rod-like shape even after adsorption, suggesting a high level of stability. Fig. 12(D–H) indicates the presence of elemental fluorine, together with Ca, P, and O elements, confirming the successful capture of fluoride ions. | ||
| Fig. 12 (A–C) SEM images, (D–H) EDS elemental mapping for C, O, Ca, P and F respectively, (I) EDS spectrum of Xq-HAP after adsorption. | ||
X-ray photoelectron spectroscopy (XPS) analysis can be used to assess the chemical valence changes of the materials before and after the reaction with fluoride ions following Xq-HAP adsorption. The existence of C 1s, O 1s, Ca 2p, and P 2p peaks in Fig. 13(A–D) shows the presence of Xq-HAP including C, O, Ca, and P components. A comparison of the spectra of Xq-HAP after the adsorption of fluoride ions with those before adsorption revealed some changes in the peaks, confirming the successful adsorption of fluoride ions by Xq-HAP. In X combined with the spectrum before adsorption, the analysis shows that the Ca 2p spectrum can be decomposed into the spectra of two pairs of spin–orbitals, the Ca 2p3/2 located at 347.39 eV and the located at 350.98 eV of Ca 2p1/2. The peak area of Ca decreased dramatically after adsorption of fluoride ions by Xq-HAP. The percentage of Ca2+ decreased from 16.12% to 15.27%, which was hypothesized that it might be due to the fact that Ca2+ was released into the solution or replaced by fluoride ions. Whereas, in combination with the O 1s exhibited before adsorption, it can be seen that the O 1s is located near the peak at 531.38 eV belonging to the OH− of Xq-HAP before the adsorption reaction. After the adsorption reaction, the oxygen fraction peak of adsorbed water was observed at 531.26 eV. The material maintained an extremely high stability after the adsorption of fluoride ions, and the doping of fluoride ions did not change its surface chemical state, which provided a strong guarantee for its recycling performance. Essentially, the primary processes responsible for the attachment of fluoride ions to Xq-HAP involve electrostatic interactions and surface complexation. Moreover, the resulting surface complexes formed following the attachment exhibit remarkable stability.
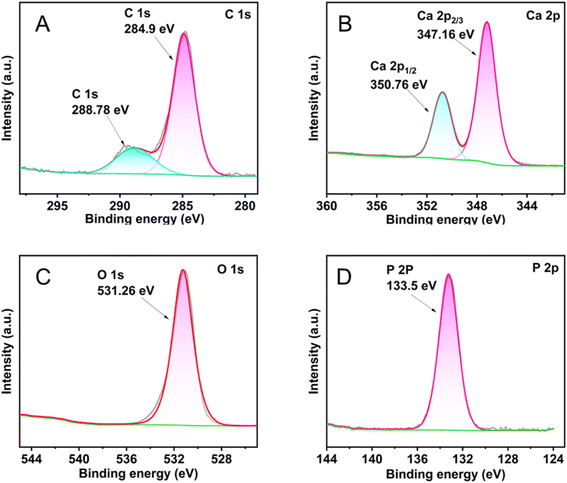 | ||
| Fig. 13 XPS spectra of the Xq-HAP after fluoride adsorption: (A) C 1s, (B) Ca 2p, (C) O 1s, and (C) P 2p. | ||
4. Conclusion
The study involved the preparation of Xq-HAP adsorbent material using discarded mussel shells from the coastal area of Lianyungang. This material was used to remove fluoride ions from aqueous solution. Compared to hydroxyapatite (Yt-HAP) prepared using traditional methods, Xq-HAP demonstrated a higher adsorption capacity and removal rate. XRD analysis showed that Xq-HAP had a well-defined hexagonal structure and cubic phase. The fluoride removal effect of Xq-HAP as an adsorbent was investigated, and the results showed that the optimum pH for the adsorption of fluoride ions by Xq-HAP was 5, and equilibrium was reached after 180 min of contact. The kinetic analysis also showed that the adsorption efficiency of Xq-HAP was higher than that of Yt-HAP, and the proposed second-order equation was the best way to describe the adsorption of fluoride ions by Xq-HAP, suggesting that adsorption is a surface phenomenon as well as a rate-limiting process. SEM revealed that Xq-HAP had a rod-like structure and there was no substantial difference in the morphology of the material before and after adsorption. Overall, the adsorbent has excellent potential for applications in fluoride removal.Data availability
The authors confirm that the data supporting the findings of this study are available within the article.Conflicts of interest
There are no conflicts to declare.Acknowledgements
This work was supported by Lianyungang Postdoctoral Research Foundation (LYG20230017) the Research Program of “521 Project” of Lianyungang City of China.References
- D. B. Adamu, L. T. Tufa, J. Lee, E. Zereffa, T. A. Segne and M. H. Razali, J. Environ. Chem. Eng., 2023, 11, 111196 CrossRef CAS.
- A. Angelin, M. Kalpana, K. Govindan and S. Kavitha, Environ. Sci. Pollut. Res., 2021, 30, 71614–71627 CrossRef PubMed.
- V. E. Badillo-Almaraz, J. Armando Flores, H. Arriola, F. A. López and L. Ruiz-Ramirez, J. Radioanal. Nucl. Chem., 2007, 271, 741–744 CrossRef CAS.
- L. Cheng, Z. Guan, L. Si, C. Mang, X. Weng, Q. Zhang and Z. Ma, J. Water Reuse Desalin., 2018, 8, 479–489 CrossRef.
- G. Choudhary, M. Yadav, B. Saini, P. R. Sharma, S. Pandey, V. Kant and R. K. Sharma, Desalination, 2024, 574, 133355 CrossRef.
- L. L. Dai, F. Nudelman, C. H. Chu, E. C. M. Lo and M. L. Mei, J. Dent., 2021, 105, 103581 CrossRef CAS PubMed.
- M. Gao, W. Wang, H. Yang and B.-C. Ye, Microporous Mesoporous Mater., 2019, 289, 109620 CrossRef CAS.
- J. J. García-Sánchez, V. Martínez-Miranda and M. Solache-Ríos, J. Fluorine Chem., 2013, 145, 136–140 CrossRef.
- J. J. García-Sánchez, M. Solache-Ríos, J. M. Martínez-Gutiérrez, N. V. Arteaga-Larios, M. C. Ojeda-Escamilla and I. Rodríguez-Torres, J. Fluorine Chem., 2016, 186, 115–124 CrossRef.
- A. Jeyaseelan, I. Aswin Kumar, M. Naushad and N. Viswanathan, J. Mol. Liq., 2022, 354, 118830 CrossRef CAS.
- A. Jeyaseelan, N. Viswanathan, I. A. Kumar and M. Naushad, J. Mol. Liq., 2023, 383, 122125 CrossRef CAS.
- M. Jiménez-Reyes and M. Solache-Ríos, J. Hazard. Mater., 2010, 180, 297–302 CrossRef PubMed.
- M. Jiménez-Reyes and M. Solache-Ríos, Water, Air, Soil Pollut., 2013, 224, 1499 CrossRef.
- P. Liang, R. An, R. Li and D. Wang, Int. J. Biol. Macromol., 2018, 111, 255–263 CrossRef CAS PubMed.
- W. Liang, L. Zhan, L. Piao and C. Rűssel, Mater. Res. Bull., 2011, 46, 205–209 CrossRef CAS.
- X.-R. Ma, X.-Y. Wei, R. Dang, W. Guo, Y.-H. Kang, X. Li, Y. Gao, J.-J. Bai, Y. Zhang, Z.-F. Zhang, Y.-J. Ma and Z.-M. Zong, Appl. Clay Sci., 2021, 211, 106191 CrossRef CAS.
- E. E. Merodio-Morales, H. E. Reynel-Ávila, D. I. Mendoza-Castillo, C. J. Duran-Valle and A. Bonilla-Petriciolet, Int. J. Environ. Sci. Technol., 2019, 17, 115–128 CrossRef.
- S. Mohan, D. K. Singh, V. Kumar and S. H. Hasan, J. Fluorine Chem., 2017, 194, 40–50 CrossRef CAS.
- N. Sangiorgi, R. Bendoni, A. Sangiorgi, L. Aversa, R. Tatti, R. Verucchi, A. Adamiano, M. Sandri, A. Tampieri and A. Sanson, Ceram. Int., 2021, 47, 9701–9710 CrossRef CAS.
- V. Russo, A. D'Angelo, C. Salvi, R. Paparo, M. E. Fortunato, E. M. Cepollaro, O. Tarallo, M. Trifuoggi, M. Di Serio and R. Tesser, J. Environ. Chem. Eng., 2024, 12, 111973 CrossRef CAS.
- X. Song, F. Zhou, H. Ma, Y. Liu and G. Wu, Mol. Catal., 2023, 542, 113105 CrossRef CAS.
- B. Zhang, J. Fang, J. Li, J. J. Lau, D. Mattia, Z. Zhong, J. Xie and N. Yan, Chem.–Asian J., 2016, 11, 532–539 CrossRef CAS PubMed.
- K. Zhang, Y. Shao, Y. Jiang, L. Zhang, S. Zhang, Y. Wang, S. Hu, J. Xiang and X. Hu, Mol. Catal., 2024, 555, 113887 CrossRef CAS.
- S. Samatya, H. Mizuki, Y. Ito, H. Kawakita and K. Uezu, React. Funct. Polym., 2010, 70, 63–68 CrossRef CAS.
- T. Sani, M. Adem, G. Fetter, P. Bosch and I. Diaz, Water, Air, Soil Pollut., 2016, 227, 90 CrossRef.
- M. Yi, K. Wang, H. Wei, D. Wei, X. Wei, B. Wei, L. Shao, T. Fujita and X. Cui, J. Hazard. Mater., 2023, 442, 130027 CrossRef CAS PubMed.
- S. Zhang, Y. Lyu, X. Su, Y. Bian, B. Yu and Y. Zhang, Environ. Earth Sci., 2016, 75, 401 CrossRef.
- X. Zhang, Y. Qi, Z. Chen, N. Song, X. Li, D. Ren and S. Zhang, Appl. Surf. Sci., 2021, 543, 148727 CrossRef CAS.
- M. Zhou, H. Yang, Z. Wang, J. Ren, R. Wang and Y. He, Environ. Sci. Pollut. Res., 2022, 30, 32641–32654 CrossRef PubMed.
- I. Abe, S. Iwasaki, T. Tokimoto, N. Kawasaki, T. Nakamura and S. Tanada, J. Colloid Interface Sci., 2004, 275, 35–39 CrossRef CAS PubMed.
- N. Viswanathan, C. Sairam Sundaram and S. Meenakshi, J. Hazard. Mater., 2009, 167, 325–331 CrossRef CAS PubMed.
- Y. Xia, X. Huang, W. Li, Y. Zhang and Z. Li, J. Hazard. Mater., 2019, 361, 321–328 CrossRef CAS PubMed.
- F. Wang, K. Wang, Y. Muhammad, Y. Wei, L. Shao and X. Wang, ACS Sustain. Chem. Eng., 2019, 7, 14716–14726 CrossRef CAS.
- A. Z. Haddad, C. D. Pilgrim, A. M. Sawvel, J. N. Hohman and A. J. Gadgil, Adv. Sustainable Syst., 2019, 3, 1900005 CrossRef.
Footnote |
| † Electronic supplementary information (ESI) available. See DOI: https://doi.org/10.1039/d4ra02147a |
| This journal is © The Royal Society of Chemistry 2024 |


