 Open Access Article
Naturally based pyrazoline derivatives as aminopeptidase N, VEGFR2 and MMP9 inhibitors: design, synthesis and molecular modeling†
Rasha Z. Batran a,
Eman Y. Ahmed
 *a,
Hanem M. Awad
 b and
Nehad A. Abdel Latif*a
aChemistry of Natural Compounds Department, Pharmaceutical and Drug Industries Research Institute, National Research Centre, Dokki, Cairo, 12622, Egypt. E-mail: eyam_ha@yahoo.com; nehad_km@yahoo.com
bTanning Materials and Leather Technology Department, National Research Centre, Dokki, Cairo, 12622, Egypt
First published on 15th July 2024
Abstract
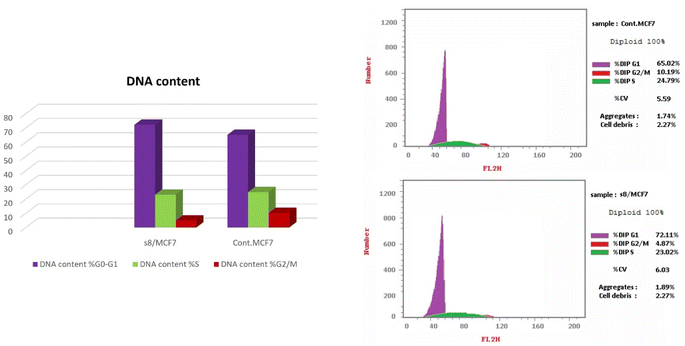
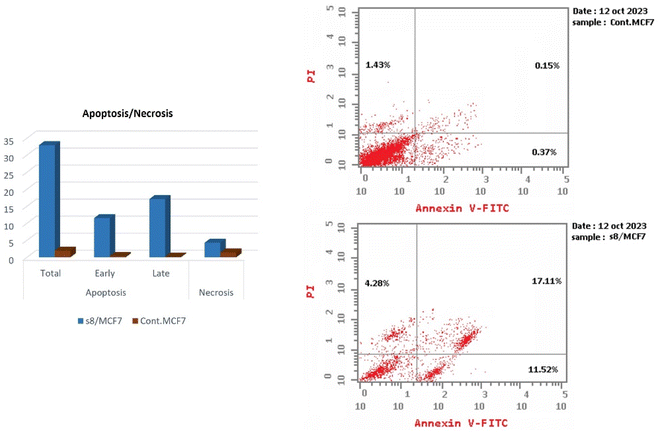
Aminopeptidase N (APN) is regarded as an attractive target for cancer treatment due to its overexpression in various types of malignancies and its close association with cancer angiogenesis, metastasis and invasion. Herein the authors describe the design, synthesis and biological evaluation of some naturally based pyrazoline derivatives. Among these compounds, the diphenylpyrazole carbothioamide 8 showed significant activity and selectivity index (SI = 4.7) on breast (MCF-7) human cancer cell line and was capable of inhibiting APN with pIC50 value of 4.8, comparable to the reference standard. Further evaluation of derivative 8 against VEGFR2 and MMP9 as biomarkers for angiogenesis and invasion showed that the selected compound had an inhibitory activity on both proteins with pIC50 values of 6.7 and 6.4, respectively. Additionally, the migration ability of cells following treatment with the diphenylpyrazole derivative decreased to record a percentage wound closure of 57.77 for compound 8 versus 97.03 for the control. The promising derivative arrested cell growth at the G1 phase inducing early and late apoptosis. Finally, docking and ADMET in silico studies were performed.
1. Introduction
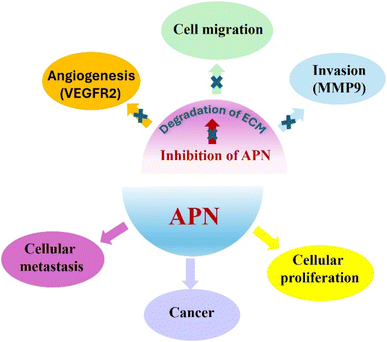
Aminopeptidases are recruited for appropriate prokaryotic and eukaryotic cells functioning, yet they might be associated with many diseases as cancer, malaria and diabetes. Aminopeptidase N (APN), is a zinc-dependent exopeptidase which is involved in metastasis of many types of tumors such as breast cancer.1,2Metastasis is a complex process which implicates angiogenesis, invasion and cell migration and is accountable for most tumor related deaths. APN metabolizes the extracellular matrix to promote the metastasis of cancer cells. In addition, APN can induce angiogenesis and is detected on angiogenic blood vessels surface as compared to normal ones. Moreover, an intimate relationship between up-regulated APN and poor prognosis of cancer is described in the literature. Altogether, these findings may introduce APN as a potential target for management of cancer, Fig. 1.3–7
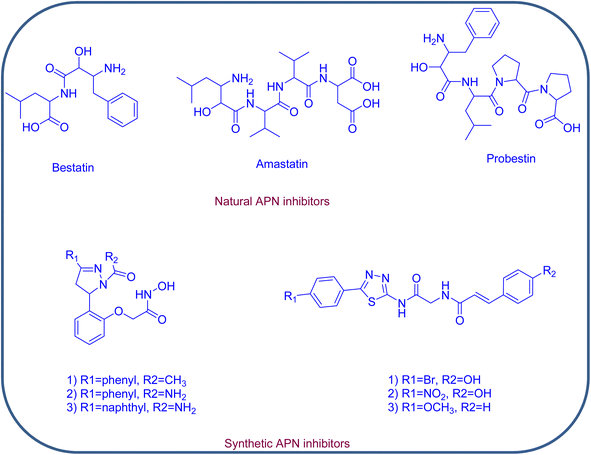
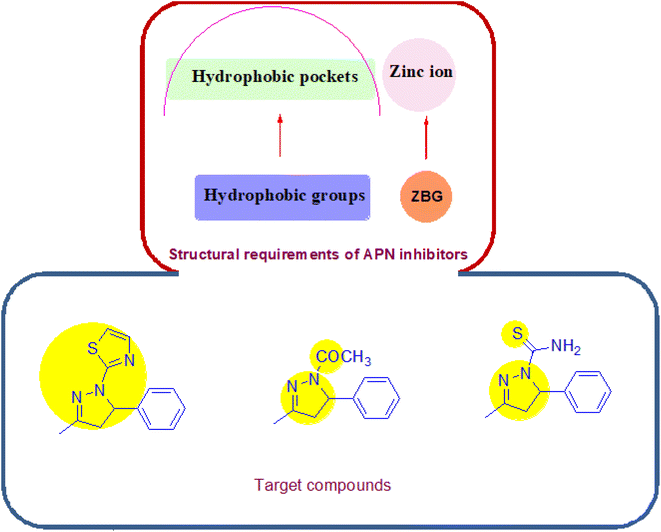
Concerning its structure, APN is composed of 967 amino acids; it retains three hydrophobic pockets that bind the substrates and surrounds one catalytic zinc ion. The SAR of potent APN inhibitors (APNIs) showed the existence of zinc binding groups (ZBGs) and hydrophobic groups that interact with one or more of the three hydrophobic pockets of APN. A variety of naturally occurring compounds and synthetic small molecules are considered as APN inhibitors, an example of the natural APNIs are bestatin, amastatin and probestin. As for the synthetic APNIs, literature reported a number of structurally diverse compounds, among which some incorporated pyrazoline and thiadiazole rings in their structures, Fig. 2 and 3. Such heterocyclic scaffolds having the nitrogen and/or sulfur atoms are involved in coordination of the zinc ion, and their rigidness is usually favored for formation of the desired hydrophobic interactions.8,9
Based on the aforementioned information and continuing our research on natural bioactive compounds,10–17 the authors developed a new series of pyrazoline based APN inhibitors, starting from the naturally occurring benzylidene acetone compound, to examine their inhibition effect on angiogenesis, invasion and migration by inhibiting vascular endothelial growth factor receptor-2 (VEGFR2), matrix metalloproteinase-9 (MMP9) and wound healing ability. The newly synthesized derivatives exhibited a combination of three electronegative atoms: (i) the aromatic nitrogens of the pyrazoline ring, (ii) the free sulfur atom (carbothioamide moiety) or that included in the heteroaromatic system of the thiazole ring and (iii) the carbonyl moiety in some of the synthesized compounds, Fig. 3. The electronegative atoms form essential system for the tight binding with the target protein. The promising derivative was subjected to cell cycle analysis, apoptosis assay, molecular modeling and ADMET study.
2. Results and discussion
2.1. Chemistry
The target compounds were prepared according to the procedures outlined in schemes 1 and 2. The pyrazoline derivatives 1–4 were synthesized by the cycloaddition reaction of the starting benzylidene acetone with hydrazine derivatives thus, heterocyclization of benzylidene acetone with hydrazine hydrate in glacial acetic acid afforded the corresponding N-acetylpyrazoline 1. While the corresponding N-phenylpyrazoline compounds 2–4 were obtained by condensation of benzylidene acetone with phenyl hydrazine compounds, namely, phenylhydrazine hydrochloride, 2-chlorophenyl hydrazine hydrochloride and/or 2,4,6- trichlorophenyl hydrazine hydrochloride in ethyl alcohol. The target pyrazoline carbothioamides 5–9 were furnished upon refluxing benzylidene acetone and different thiosemicarbazides, namely: thiosemicarbazide, 4-methylthiosemicarbazide, 4-ethylthiosemicarbazide, 4-phenylthiosemicarbazide and/or 4-benzylthiosemicarbazide, Scheme 1. The potential of carbothioamide 5 as an intriguing critical intermediate in the synthesis of new thiazoline and thiazolidinone derivatives was investigated. S-Alkylation was the first step in these reactions, followed by dehydration or the loss of an alcohol molecule. The relevant thiazoline derivatives 10–13 were obtained by treating carbothioamide 5 with the appropriate phenacyl bromide compounds; phenacyl bromide, 4-fluorophenacyl bromide, 4-methoxyphenacyl bromide and/or 2,4-dichlorophenacyl bromide in refluxing ethanol in the presence of anhydrous sodium acetate. Furthermore, the reaction of carbothioamide 5 with ethylbromoacetate and/or ethyl 2-bromopropionate in the presence of anhydrous sodium acetate resulted in the corresponding thiazolidinone 14 and 5-methylthiazolidinone 15 derivatives, respectively. The substituted benzylidene thiazolidinone derivatives 16–19 were obtained via one pot three component reaction of carbothioamide 5, chloroacetic acid and the appropriate aromatic aldehydes: namely, 4-fluorobenzaldehyde, 4-methoxybenzaldehyde, 2,4-dichlorobenzaldehyde and/or 3,4-dimethoxybenzaldehyde in acetic acid and catalytic amounts of acetic anhydride and anhydrous sodium acetate, Scheme 2. The structures of the newly synthesized compounds were confirmed by means of analytical and spectral methods (Experimental part).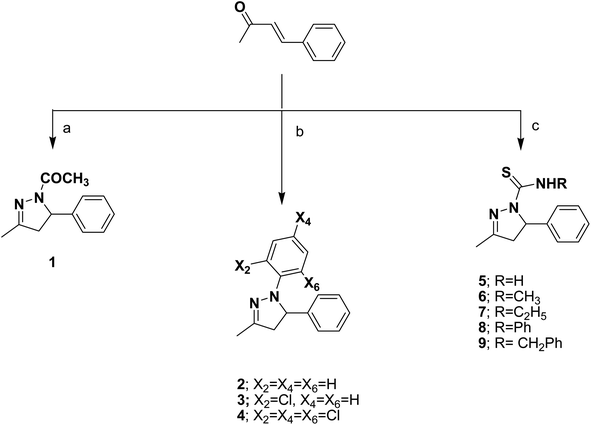 | ||
| Scheme 1 (a) NH2NH2·H2O, AcOH, reflux; (b) ArNHNH2·HCl, ethanol, reflux; (c) RNHCSNHNH2, ethanol, HCl, reflux. | ||
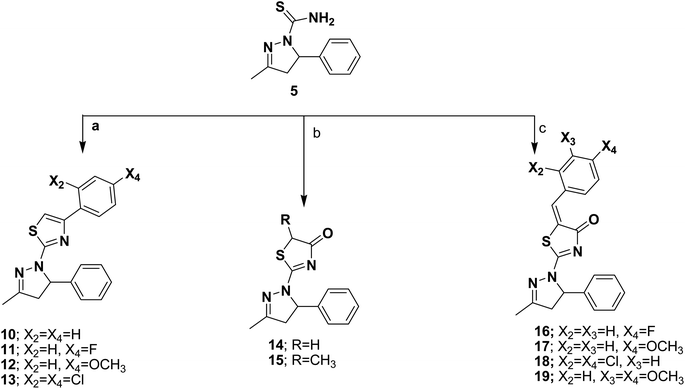 | ||
| Scheme 2 (a) ArCOCH2Br, ethanol, anhydrous CH3COONa, reflux; (b) BrCH2COOC2H5/CH3CHBrCOOC2H5, ethanol, anhydrous CH3COONa, reflux; (c) ClCH2COOH, ArCHO, AcOH, (CH3CO)2O, anhydrous CH3COONa, reflux. | ||
2.2. Biology
| Compound code | MCF-7 IC50 (μM) | BJ-1 IC50 (μM) |
|---|---|---|
| 1 | 6.2 ± 0.2 | 18.6 ± 1.2 |
| 2 | 7.5 ± 0.3 | — |
| 3 | 8.8 ± 0.5 | — |
| 4 | 8.1 ± 0.5 | — |
| 5 | 5.8 ± 0.2 | 18.2 ± 1.2 |
| 6 | 6.4 ± 0.3 | 18.2 ± 1.5 |
| 7 | 5.8 ± 0.2 | 18.7 ± 1.5 |
| 8 | 6.2 ± 0.2 | 29.1 ± 2.3 |
| 9 | 7.0 ± 0.3 | — |
| 10 | 7.6 ± 0.3 | — |
| 11 | 6.9 ± 0.2 | — |
| 12 | 7.1 ± 0.2 | — |
| 13 | 6.7 ± 0.2 | — |
| 14 | 8.3 ± 0.3 | — |
| 15 | 8.6 ± 0.3 | — |
| 16 | 6.6 ± 0.2 | — |
| 17 | 7.0 ± 0.3 | — |
| 18 | 6.9 ± 0.2 | — |
| 19 | 7.5 ± 0.2 | — |
| Doxorubicin | 4.9 ± 0.3 | 12.9 ± 1.3 |
A model was used for predicting the validation test set compounds biological activity (External validation). The model displayed high test set IC50 prediction as shown in Tables 2, 3 and Fig. 7 as revealed in its R2 of 0.681 and RMSE of 0.082 showing the predictive ability of the QSAR model. The three descriptors chosen by FS for the model which are directly proportional to the IC50 (with positive coefficients) are E, log![[thin space (1/6-em)]](https://www.rsc.org/images/entities/char_2009.gif) p (o/w) and Mr
p (o/w) and Mr![[thin space (1/6-em)]](https://www.rsc.org/images/entities/char_2009.gif) log
log![[thin space (1/6-em)]](https://www.rsc.org/images/entities/char_2009.gif) p (o/w) area descriptors which rely on the estimated accessible van der Waals surface area (in Å2) for different atoms depending on their influence on the molar refractivity which indicates steric extent and molecular bulkiness.22
p (o/w) area descriptors which rely on the estimated accessible van der Waals surface area (in Å2) for different atoms depending on their influence on the molar refractivity which indicates steric extent and molecular bulkiness.22
| Compound | MCF-7 | ||
|---|---|---|---|
| Experimental activity (pIC50) | Predicted activity (pIC50) | Residual | |
| 1 | 5.2076 | 5.1649 | 0.0427 |
| 2 | 5.1249 | 5.1264 | −0.0015 |
| 3 | 5.0555 | 5.1106 | −0.0551 |
| 4 | 5.0915 | 5.1104 | −0.0189 |
| 6 | 5.1938 | 5.1812 | 0.0126 |
| 7 | 5.2366 | 5.1911 | 0.0455 |
| 8 | 5.2076 | 5.1895 | 0.0181 |
| 9 | 5.1549 | 5.1981 | −0.0432 |
| 11 | 5.1612 | 5.1245 | 0.0367 |
| 12 | 5.1487 | 5.1509 | −0.0022 |
| 13 | 5.1739 | 5.1289 | 0.045 |
| 14 | 5.0809 | 5.1603 | −0.0794 |
| 16 | 5.1805 | 5.1427 | 0.0378 |
| 17 | 5.1549 | 5.1673 | −0.0124 |
| 18 | 5.1612 | 5.1395 | 0.0217 |
| 19 | 5.1249 | 5.1725 | −0.0476 |
| Compound | MCF-7 | ||
|---|---|---|---|
| Experimental activity (pIC50) | Predicted activity (pIC50) | Residual | |
| 5 | 5.2366 | 5.1966 | 0.0400 |
| 10 | 5.1192 | 5.1278 | −0.0086 |
| 15 | 5.0655 | 5.1478 | −0.0823 |
The QSAR study showed that the antiproliferative activity of this set of compounds are attributed to the molecular bulkiness and partial charge distribution and hence its impact on the molecular size as well as its ability to form electrostatic interactions as hydrogen-bond.
2.3. Molecular modeling studies
| Compound | Protein | S (kcal mol−1) | Amino acid involved | Interacting group/fragment | Type of interaction |
|---|---|---|---|---|---|
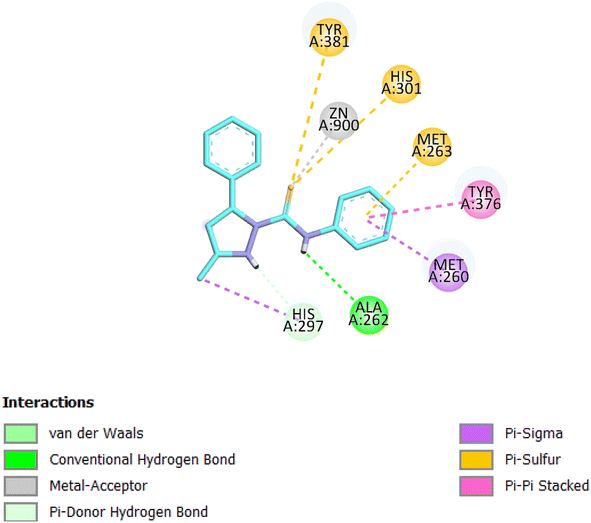
| 8 | Aminopeptidase-N | −8.1 | Ala262 | NH | H-bond |
| Zn | Sulfur | Metal-acceptor | |||
| Tyr381 | Sulfur | Cation-pi | |||
| His301 | Sulfur | Cation-pi | |||
| Met263 | Phenyl | Cation-pi |
The selected derivative interacted with the target protein revealing the structural requirements for activity of potent APN inhibitors, the presence of the heterocyclic scaffold, having the sulfur atom involved in coordination of the zinc ion, is usually favored for formation of the desired interactions. The sulfur atom representing the zinc binding group interacted with the Zn ion, Tyr381 and His301 amino acids of the enzyme, while the NH group formed H-bond interaction with Ala262, also the phenyl ring interacted with Met263 amino acid.
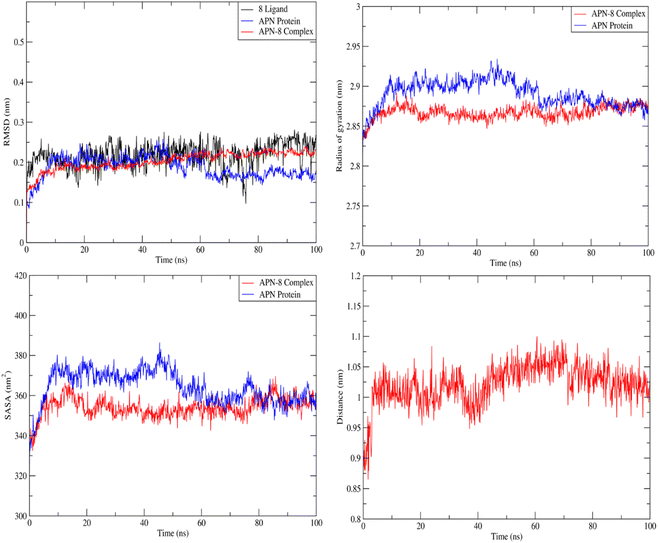
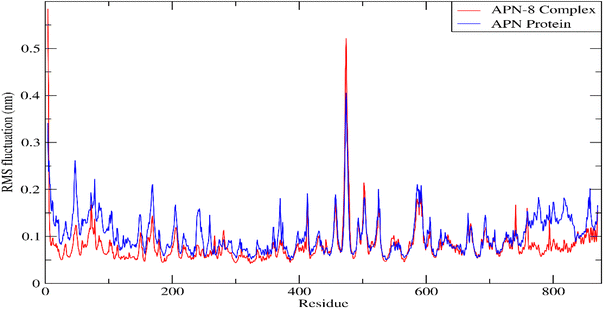
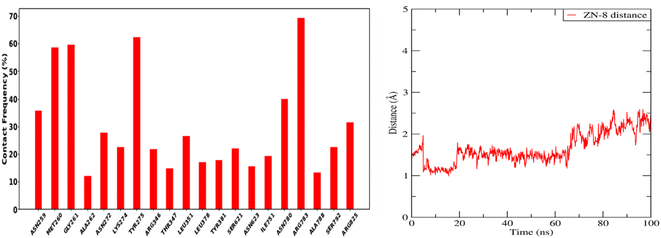
Forces binding compound 8 with surrounding amino acids of APN active site revealed that Ala262 and Tyr381 are among the residues that mostly interacted with derivative 8 during the simulation study, as Fig. 11 illustrates, supporting the docking results. In addition, distance between the sulfur atom of compound 8 and zinc atom of APN protein was in range of 1.2–2.5 Å corresponding to sulfur metal bond. Finally, binding free energy values (MMPBSA), which was used to gauge the sustainability of the complexes produced, included all those forces, Table 5.
| Binding energy | Pim-1 |
|---|---|
| Electrostatic energy | −19.762 ± 3.341 |
| Polar solvation energy | 47.094 ± 2.425 |
| SASA energy | −12.445 ± 1.806 |
| van der Waal energy | −110.247 ± 25.232 |
| ΔG | −95.519 ± 3.099 |
2.4. In silico ADMET prediction study
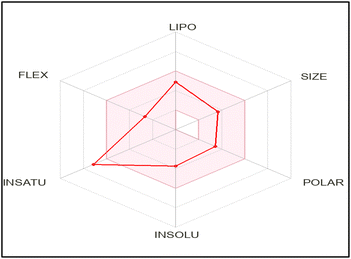
The authors used the SwissADME online application to reveal important information about different properties and parameters of the promising compound 8. The diphenylpyrazole carbothioamide derivative complied with Lipinski's rule predicting its suitability as a lead compound for oral administration, Table 6.The bioavailability radar chart showed that the screened derivative 8 is situated in the pink colored zone which is the suitable area regarding its lipophilicity, size, polarity, solubility, and flexibility, Fig. 12, but not its saturation. This provides anticipation for its oral bioavailability.
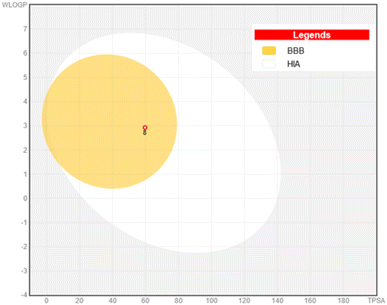
The boiled-egg chart showed that derivative 8 was positioned in the yellow area, to indicate high GIT absorption and a probability (P < 1) of BBB penetration, Fig. 13. On the other hand, the potential derivative 8 showed no PAINS alerts recording 0.55 bioavailability value and was categorized as non-carcinogenic substance.
3. Conclusion
A new series of APN inhibitors with naturally based pyrazoline scaffold was synthesized. The new compounds showed promising cytotoxicity against MCF-7 cell line. In the assays against APN, VEGFR2 and MMP9 and the wound healing assay, compound 8 exhibited promising in vitro anti-APN, anti-angiogenesis, anti-metastasis, and anti-invasion activities. Moreover, the promising derivative was capable of arresting cell growth at G1 phase and inducing early and late apoptosis. The docking study showed that the selected compound attained promising results against the target protein.4. Materials and methods
4.1. Chemistry
All melting points were measured using Electrothermal IA 9000 apparatus and they were uncorrected. NMR spectra were assessed by Bruker 400 MHz spectrometer using TMS as the internal standard. The reactions were followed by TLC (silica gel, aluminum sheets 60 F254, Merck) using Benzene-ethylacetate (7![[thin space (1/6-em)]](https://www.rsc.org/images/entities/char_2009.gif) :
:![[thin space (1/6-em)]](https://www.rsc.org/images/entities/char_2009.gif) 3 v/v) as eluent. The purity of the synthesized derivatives was determined by elemental analysis and was found to be more than 95%. Compounds 1,23 2,24 525 and 1426 were previously prepared.
3 v/v) as eluent. The purity of the synthesized derivatives was determined by elemental analysis and was found to be more than 95%. Compounds 1,23 2,24 525 and 1426 were previously prepared.
4.1.1.1. 1-(2-Chlorophenyl)-4,5-dihydro-3-methyl-5-phenyl-1H-pyrazole 3. Yellow crystals, mp = 77–8 °C, yield (87%). Anal. Calcd. for C16H15ClN2 (270.76): C, 70.98; H, 5.58; N, 10.35. Found: C, 71.08; H, 5.66; N, 10.43. 1HNMR (DMSO-d6, δ ppm): 2.07 (s, 3H, CH3), 2.81–2.87 (dd, 1H, pyrazoline, J = 5.60, 17.32 Hz), 3.39–3.47 (dd, 1H, pyrazoline, J = 10.92, 17.36 Hz), 5.52–5.56 (dd, 1H, pyrazoline, J = 5.72, 10.88 Hz), 6.83–7.30 (m, 9H, Ar–H). 13C NMR (DMSO-d6, δ ppm): 16.10, 46.77, 65.64, 122.70, 123.94, 124.42, 126.98, 127.55, 127.86, 128.78, 130.40, 141.53, 143.88, 152.25.
4.1.1.2. 1-(2,4,6-Trichlorophenyl)-4,5-dihydro-3-methyl-5-phenyl-1H-pyrazole 4. Buff crystals, mp = 161–2 °C, yield (89%). Anal. Calcd. for C16H13Cl3N2 (339.65): C, 56.58; H, 3.86; N, 8.25. Found: C, 56.68; H, 3.95; N, 8.33. 1HNMR (DMSO-d6, δ ppm): 2.01 (s, 3H, CH3), 2.94–3.01 (dd, 1H, pyrazoline, J = 7.32, 17.44 Hz), 3.33–3.40 (dd, 1H, pyrazoline, J = 11.28, 17.44 Hz), 5.22–5.27 (dd, 1H, pyrazoline, J = 7.88, 10.58 Hz), 7.23–7.30 (m, 5H, Ar–H), 7.52 (s, 2H, Ar–H). 13C NMR (DMSO-d6, δ ppm): 15.80, 46.23, 67.36, 128.22, 128.26, 128.62, 129.41, 131.60, 135.49, 139.26, 140.75, 150.46.
4.1.2.1. 4,5-Dihydro-N,3-dimethyl-5-phenylpyrazole-1-carbothioamide 6. Yellow crystals, mp = 171–2 °C, yield (85%). Anal. Calcd. for C12H15N3S (233.33): C, 61.77; H, 6.48; N, 18.01; S, 13.74. Found: C, 61.84; H, 6.55; N, 18.09; S, 13.84. 1HNMR (DMSO-d6, δ ppm): 2.04 (s, 3H, CH3), 2.57–2.63 (dd, 1H, pyrazoline, J = 3.56, 18.32 Hz), 2.90 (s, 3H, NCH3), 3.49–3.57 (dd, 1H, pyrazoline, J = 11.44, 18.24 Hz), 5.73–5.77 (dd, 1H, pyrazoline, J = 3.64, 11.44 Hz), 7.23–7.69 (m, 5H, Ar–H), 8.13 (s, 1H, NH, D2O exchangeable). 13C NMR (DMSO-d6, δ ppm): 16.24, 31.69, 46.45, 63.11, 125.80, 127.18, 128.86, 143.87, 157.89, 176.49.
4.1.2.2. N-Ethyl-4,5-dihydro-3-methyl-5-phenylpyrazole-1-carbothioamide 7. Yellow crystals, mp = 170–1 °C, yield (67%). Anal. Calcd. for C13H17N3S (247.36): C, 63.12; H, 6.93; N, 16.99; S, 12.96. Found: C, 63.21; H, 6.99; N, 17.08; S, 13.04. 1HNMR (DMSO-d6, δ ppm): 1.08–1.12 (t, 3H, CH3, 7.2 Hz), 2.23 (s, 3H, CH3), 3.31–3.37 (dd, 1H, pyrazoline, J = 8.32, 18.24 Hz), 3.43 (br m, 2H, CH2), 3.49–3.56 (dd, 1H, pyrazoline, J = 9.44, 18.24 Hz), 5.08–5.13 (dd, 1H, pyrazoline, J = 8.96, 11.52 Hz), 7.42–7.49 (m, 5H, Ar–H), 8.78 (s, 1H, NH, D2O exchangeable). 13C NMR (DMSO-d6, δ ppm): 11.16, 16.41, 34.56, 44.91, 60.44, 127.01, 128.59, 129.31, 129.68, 146.59, 148.72, 179.06.
4.1.2.3. 4,5-Dihydro-3-methyl-N,5-diphenylpyrazole-1-carbothioamide 8. Yellow crystals, mp = 155–60 °C, yield (87%). Anal. Calcd. for C17H17N3S (295.4): C, 69.12; H, 5.80; N, 14.22; S, 10.85. Found: C, 69.20; H, 5.87; N, 14.29; S, 10.93. 1HNMR (DMSO-d6, δ ppm): 2.11 (s, 3H, CH3), 2.67–2.72 (dd, 1H, pyrazoline, J = 3.40, 18.44 Hz), 3.58–3.66 (dd, 1H, pyrazoline, J = 11.28, 18.32 Hz), 5.87–5.90 (dd, 1H, pyrazoline, J = 3.56, 11.32 Hz), 7.09–7.57 (m, 10H, Ar–H), 9.83 (s, 1H, NH, D2O exchangeable). 13C NMR (DMSO-d6, δ ppm): 16.36, 46.60, 63.21, 124.95, 125.20, 125.87, 127.36, 128.40, 128.98, 140.05, 143.32, 159.46, 173.84.
4.1.2.4. N-Benzyl-4,5-dihydro-3-methyl-5-phenylpyrazole-1-carbothioamide 9. Yellow crystals, mp = 135–6 °C, yield (83%). Anal. Calcd. for C18H19N3S (309.43): C, 69.87; H, 6.19; N, 13.58; S, 10.36. Found: C, 69.96; H, 6.27; N, 13.62; S, 10.44. 1HNMR (DMSO-d6, δ ppm): 2.05 (s, 3H, CH3), 2.61–2.67 (dd, 1H, pyrazoline), 3.51–3.58 (dd, 1H, pyrazoline), 4.71–4.73 (d, 2H, CH2), 5.76–5.80 (dd, 1H, pyrazoline), 7.09–7.32 (m, 10H, Ar–H), 8.97 (brs, 1H, NH, D2O exchangeable). 13C NMR (DMSO-d6, δ ppm): 16.28, 46.78, 47.35, 63.27, 125.75, 127.19, 127.74, 128.08, 128.44, 140.13, 143.72, 158.52, 175.94.
4.1.3.1. 4,5-Dihydro-3-methyl-5-phenyl-1-(4-phenylthiazol-2-yl)-1H-pyrazole 10. Yellow crystals, mp = 130–1 °C, yield (88%). Anal. Calcd. for C19H17N3S (319.42): C, 71.44; H, 5.36; N, 13.15; S, 10.04. Found: C, 71.51; H, 5.45; N, 13.22; S, 10.14. 1HNMR (DMSO-d6, δ ppm): 2.09 (s, 3H, CH3), 2.88–2.94 (dd, 1H, pyrazoline, J = 6.80, 18.00 Hz), 3.59–3.67 (dd, 1H, pyrazoline, J = 11.76, 18.20 Hz), 5.41–5.46 (dd, 1H, pyrazoline, J = 6.96, 11.68 Hz), 7.23–7.69 (m, 11H, Ar–H and CH-thiazole). 13C NMR (DMSO-d6, δ ppm): 15.84, 47.66, 64.31, 104.17, 125.91, 127.12, 127.79, 127.89, 128.80, 135.02, 142.67, 150.73, 155.82, 165.59.
4.1.3.2. 1-(4-(4-Fluorophenyl)thiazol-2-yl)-4,5-dihydro-3-methyl-5-phenyl-1H-pyrazole 11. Yellow crystals, mp = 139–40 °C, yield (91%). Anal. Calcd. for C19H16FN3S (337.41): C, 67.63; H, 4.78; N, 12.45; S, 9.50. Found: C, 67.71; H, 4.84; N, 12.52; S, 9.61. 1HNMR (DMSO-d6, δ ppm): 2.08 (s, 3H, CH3), 2.87–2.94 (dd, 1H, pyrazoline, J = 6.84, 18.16 Hz), 3.59–3.67 (dd, 1H, pyrazoline, J = 11.64, 18.08 Hz), 5.41–5.46 (dd, 1H, pyrazoline, J = 6.92, 11.72 Hz), 7.14–7.73 (m, 10H, Ar–H and CH-thiazole). 13C NMR (DMSO-d6, δ ppm): 15.82, 47.67, 64.26, 103.89, 115.65, 115.87, 127.08, 127.83, 128.92, 131.56, 142.56, 149.59, 156.02, 160.77, 165.65.
4.1.3.3. 4,5-Dihydro-1-(4-(4-methoxyphenyl)thiazol-2-yl)-3-methyl-5-phenyl-1H-pyrazole 12. Brownish yellow crystals, mp = 177–8 °C, yield (90%). Anal. Calcd. for C20H19N3OS (349.45): C, 68.74; H, 5.48; N, 12.02; S, 9.18. Found: C, 68.82; H, 5.55; N, 12.11; S, 9.28. 1HNMR (DMSO-d6, δ ppm): 2.07 (s, 3H, CH3), 2.87–2.93 (dd, 1H, pyrazoline, J = 6.92, 18.16 Hz), 3.58–3.65 (dd, 1H, pyrazoline, J = 11.68, 18.20 Hz), 3.75 (s, 3H, OCH3), 5.40–5.44 (dd, 1H, pyrazoline, J = 7.04, 11.68 Hz), 6.88–7.62 (m, 10H, Ar–H and CH-thiazole). 13C NMR (DMSO-d6, δ ppm): 15.81, 47.62, 55.53, 64.35, 102.00, 114.27, 127.12, 127.26, 127.77, 127.94, 128.88, 142.89,156.59, 155.65, 159.15, 165.56.
4.1.3.4. 1-(4-(2,4-Dichlorophenyl)thiazol-2-yl)-4,5-dihydro-3-methyl-5-phenyl-1H-pyrazole 13. Gray crystals, mp = 147–8 °C, yield (87%). Anal. Calcd. for C19H15Cl2N3S (388.31): C, 58.77; H, 3.89; N, 10.82; S, 8.26. Found: C, 58.85; H, 3.96; N, 10.92; S, 8.35. 1HNMR (DMSO-d6, δ ppm): 2.08 (s, 3H, CH3), 2.88–2.94 (dd, 1H, pyrazoline, J = 6.72, 18.16 Hz), 3.59–3.66 (dd, 1H, pyrazoline, J = 11.72, 18.24 Hz), 5.41–5.46 (dd, 1H, pyrazoline, J = 6.80, 11.68 Hz), 7.26–7.71 (m, 9H, Ar–H and CH-thiazole). 13C NMR (DMSO-d6, δ ppm): 15.83, 47.65, 64.22, 104.95, 127.09, 127.58, 127.83, 128.92, 132.29, 133.85, 142.53, 149.48, 156.04, 165.66.
4.1.4.1. 2-(4,5-Dihydro-3-methyl-5-phenylpyrazol-1-yl)-5-methylthiazol-4(5H)-one 15. Yellow crystals, mp = 122–3 °C, yield (88%). Anal. Calcd. for C14H15N3OS (273.35): C, 61.51; H, 5.53; N, 15.37; S, 11.73. Found: C, 61.60; H, 5.63; N, 15.44; S, 11.82. 1HNMR (DMSO-d6, δ ppm): 1.41–1.46 (dd, 3H, CH3-thiazolidinone, J = 7.40, 10.56 Hz), 2.13 (s, 3H, CH3), 2.87–2.91 (dd, 1H, pyrazoline), 3.68–3.75 (dd, 1H, pyrazoline, J = 11.16, 17.8 Hz), 4.11–4.12 (q, 1H, CH-thiazolidinone, J = 2.4 Hz), 5.60 (br, 1H, pyrazoline), 7.17–7.37 (m, 5H, Ar–H). 13C NMR (DMSO-d6, δ ppm): 16.10, 19.21, 47.77, 49.17, 63.44, 126.02, 126.10, 128.19, 129.31, 140.98, 164.58, 175.55, 190.40.
4.1.5.1. 5-(4-Fluorobenzylidene)-2-(4,5-dihydro-3-methyl-5-phenylpyrazol-1-yl)thiazol-4(5H)-one 16. Yellow crystals, mp = 200–1 °C, yield (92%). Anal. Calcd. for C20H16FN3OS (365.42): C, 65.74; H, 4.41; N, 11.50; S, 8.77. Found: C, 65.82; H, 4.50; N, 11.59; S, 8.88. 1HNMR (DMSO-d6, δ ppm): 2.19 (s, 3H, CH3), 2.97–3.03 (dd, 1H, pyrazoline, J = 4.04, 18.64 Hz), 3.76–3.84 (dd, 1H, pyrazoline, J = 11.00, 18.76 Hz), 5.72–5.75 (dd, 1H, pyrazoline, J = 4.08, 11.04 Hz), 7.23–7.73 (m, 10H, Ar–H and CH-benzylidene). 13C NMR (DMSO-d6, δ ppm): 16.17, 47.99, 63.61, 116.72, 116.94, 126.21, 128.36, 129.37, 129.81, 130.99, 131.02, 132.43, 132.53, 132.88, 132.97, 140.58, 164.24, 165.89, 170.00, 179.59.
4.1.5.2. 5-(4-Methoxybenzylidene)-2-(4,5-dihydro-3-methyl-5-phenylpyrazol-1-yl)thiazol-4(5H)-one 17. Yellow crystals, mp = 219–20 °C, yield (91%). Anal. Calcd. for C21H19N3O2S (377.46): C, 66.82; H, 5.07; N, 11.13; S, 8.49. Found: C, 66.89; H, 5.16; N, 11.22; S, 8.57. 1HNMR (DMSO-d6, δ ppm): 2.18 (s, 3H, CH3), 2.95–3.01 (dd, 1H, pyrazoline, J = 4.00, 18.60 Hz), 3.75–3.83 (dd, 1H, pyrazoline, J = 11.08, 18.60 Hz), 3.83 (s, 3H, OCH3), 5.70–5.74 (dd, 1H, pyrazoline, J = 4.08, 11.08 Hz), 7.09–7.81 (m, 10H, Ar–H and CH-benzylidene). 13C NMR (DMSO-d6, δ ppm): 16.14, 47.94, 55.88, 63.52, 115.27, 125.62, 126.17, 126.74, 128.34, 129.37, 130.98, 132.02, 140.67, 160.99, 165.45, 170.07, 179.95.
4.1.5.3. 5-(2,4-Dichlorobenzylidene)-2-(4,5-dihydro-3-methyl-5-phenylpyrazol-1-yl)thiazol-4(5H)-one 18. Yellow crystals, mp = 202–3 °C, yield (93%). Anal. Calcd. for C20H15Cl2N3OS (416.32): C, 57.70; H, 3.63; N, 10.09; S, 7.70. Found: C, 57.79; H, 3.69; N, 10.16; S, 7.81. 1HNMR (DMSO-d6, δ ppm): 2.19 (s, 3H, CH3), 2.99–3.05 (dd, 1H, pyrazoline, J = 4.00, 18.72 Hz), 3.77–3.85 (dd, 1H, pyrazoline, J = 10.96, 18.48 Hz), 5.73–5.77 (dd, 1H, pyrazoline, J = 4.00, 10.96 Hz), 7.22–7.82 (m, 9H, Ar–H and CH-benzylidene). 13C NMR (DMSO-d6, δ ppm): 16.18, 48.04, 63.74, 124.68, 126.22, 128.41, 128.66, 128.80, 129.39, 130.22, 130.35, 130.45, 131.47, 132.73, 135.24, 135.55, 140.39, 166.54, 169.75, 178.94.
4.1.5.4. 5-(3,4-Dimethoxybenzylidene)-2-(4,5-dihydro-3-methyl-5-phenylpyrazol-1-yl)thiazol-4(5H)-one 19. Yellow crystals, mp = 229–30 °C, yield (90%). Anal. Calcd. for C22H21N3O3S (407.49): C, 64.85; H, 5.19; N, 10.31; S, 7.87. Found: C, 64.94; H, 5.26; N, 10.39; S, 7.95. 1HNMR (DMSO-d6, δ ppm): 2.19 (s, 3H, CH3), 2.95–3.01 (dd, 1H, pyrazoline, J = 4.00, 18.64 Hz), 3.74–3.82 (dd, 1H, pyrazoline), 3.82 (s, 3H, OCH3), 3.83 (s, 3H, OCH3), 5.70–5.74 (dd, 1H, pyrazoline, J = 4.00, 11.04 Hz), 7.16–7.58 (m, 9H, Ar–H and CH-benzylidene). 13C NMR (DMSO-d6, δ ppm): 16.20, 47.94, 56.06, 56.13, 63.54, 112.58, 113.80, 123.31, 124.17, 125.82, 126.19, 127.04, 128.31, 129.36, 131.39, 132.61, 140.74, 149.40, 150.80, 165.41, 169.98, 179.80.
4.2. Biology
To determine the effect of each synthesized compound on membrane permeability in MCF-7 cancer cell line as well as BJ-1 normal cell line, a lactate dehydrogenase (LDH) release assay was used.27–30 The cells were seeded in 24-well culture plates at a density of 2 × 10⁵ cells per well in 500 μL volume and allowed to grow for 18 h before treatment. After treatment with a series of different concentrations of each compound or Doxorubicin® (positive control), the plates were incubated for 48 h. Then, the supernatant (40 μL) was transferred to a new 96 well to determine LDH release and 6% Triton X-100 (40 μL) was added to the original plate for determination of total LDH. An aliquot of 0.1 M potassium phosphate buffer (100 μL, pH 7.5) containing 4.6 mM pyruvic acid was mixed to the supernatant using repeated pipetting. Then, 0.1 M potassium phosphate buffer (100 μL, pH 7.5) containing 0.4 mg mL−1 reduced β-NADH was added to the wells. The kinetic changes were read for 1 min using ELISA microplate reader in absorbance at wavelength 340 nm. This procedure was repeated with 40 μL of the total cell lysate to determine total LDH. The percentage of LDH release was determined by dividing the LDH released into the media by the total LDH following cell lysis in the same well.
To clarify the cytotoxic effect of the newly synthesized compound, the cell cycle progression was examined against MCF-7 cells. Cell pellets were fixed with 70% ethanol on ice for 15 min and collected again. The collected pellets were incubated with propidium iodide (PI) staining solution (50 μg mL−1 PI, 0.1 mg mL−1 RNaseA, 0.05% Triton X-100) at room temperature for 1 h and analyzed by Gallios flow cytometer (Beckman Coulter, Brea, CA, USA) according to the manufacturer's instructions. Cell cycle analysis was determined using a FACS Calibur flow cytometer (BD Biosciences, USA).
Whereas, apoptosis detection was performed by FITC Annexin-V/PI commercial kit (Becton Dickenson, Franklin Lakes, NJ, USA) following the manufacturer protocol. The samples were analyzed by fluorescence-activated cell sorting (FACS) with a Gallios flow cytometer (Beckman Coulter, Brea, CA, USA) within 1 h after staining. Data were analyzed using Kaluza v1.2 (Beckman Coulter).
4.3. 2D QSAR study
The 19 target pyrazoline derivatives were split into training and test sets of 16 and 3 compounds, respectively, while maintaining the IC50 value distribution of the original dataset in both sets. Molecular mechanical descriptors available in MOE QSAR module (313 descriptors) were initially computed for the training set compounds. The resulted “descriptors-target property” matrix was passed to RapidMiner Studio 9.3.001 for QSAR model construction.33 Redundant descriptors “low variance descriptors” that do not have an added value to the model were first filtered out leaving 299 descriptors for model construction. Variable selection was then performed utilizing forward selection (FS) provided in RapidMiner.34 MLR was used as the machine learning algorithm for the construction of a linear model which is known for its interpretability, transparency and simplicity.RMSECV was employed for the assessment of the model quality. FS protocol depends on the inclusion of an initial descriptor in the regression which gives the best one-descriptor model quality (minimum RMSECV). Further descriptors are progressively included to the regression and only the descriptor yields the maximum increase in model quality (minimum RMSECV) is included to the chosen descriptor set at a time. The training process is ended when further descriptor inclusion does not enhance the model quality (does not decrease RMSECV anymore). FS generated a three-descriptor model (eqn (1)) with a significantly high quality as shown in its statistical evaluation parameters and its predictions.
IC50 = −0.0012 × E − 0.0295 × log![[thin space (1/6-em)]](https://www.rsc.org/images/entities/char_2009.gif) p(o/w) + 0.0583 × Mr + 5.0596 p(o/w) + 0.0583 × Mr + 5.0596
| (1) |
4.4. Molecular modeling studies
| ΔGBinding = ΔGComplex − (ΔGProtein − ΔGLignad) |
4.5. In silico ADMET prediction study
Using the freely accessible web application SwissADME, the promising derivative 8 was investigated for its expected physicochemical and pharmacokinetic properties. Furthermore, the admetSAR 1.0 internet server (http://lmmd.ecust.edu.cn/admetsar1) was utilized to compute their toxicity.Data availability
The data supporting this article have been included as part of the ESI.†Conflicts of interest
The authors declared that there are no actual or potential conflicts of interest and have approved the article.Acknowledgements
This research article was funded by NRC, Cairo, Egypt (2022–2024), ethical approval number: (13010137-2) through project no. 13010137 entitled “Synthesis and computational studies of new naturally derived anticancer heterocyclic compounds”.References
- A. Mucha, M. Drag, J. P. Dalton and P. Kafarski, Biochimie, 2010, 92, 1509–1529 CrossRef CAS.
- R. Pasqualini, E. Koivunen, R. Kain, J. Lahdenranta, M. Sakamoto, A. Stryhn, R. A. Ashmun, L. H. Shapiro, W. Arap and E. Ruoslahti, Cancer Res., 2000, 60, 722–727 CAS.
- D. Wirtz, K. Konstantopoulos and P. C. Searson, Nat. Rev. Cancer, 2011, 11, 512–522 CrossRef CAS.
- I. Saiki, H. Fujii, J. Yoneda, F. Abe, M. Nakajima, T. Tsuruo and I. Azuma, Int. J. Cancer, 1993, 54, 137–143 CrossRef CAS PubMed.
- J. Yoneda, I. Saiki, H. Fujii, F. Abe, Y. Kojima and I. Azuma, Clin. Exp. Metastasis, 1992, 10, 49–59 CrossRef CAS PubMed.
- S. V Bhagwat, J. Lahdenranta, R. Giordano, W. Arap, R. Pasqualini and L. H. Shapiro, Blood, 2001, 97, 652–659 CrossRef.
- M. Wickström, R. Larsson, P. Nygren and J. Gullbo, Cancer Sci., 2011, 102, 501–508 CrossRef PubMed.
- J. Cao, C. Zhao, H. Dong, Q. Xu and Y. Zhang, RSC Adv., 2021, 11, 21426–21432 RSC.
- J. Cao, J. Zang, X. Kong, C. Zhao, T. Chen, Y. Ran, H. Dong, W. Xu and Y. Zhang, Bioorg. Med. Chem., 2019, 27, 978–990 CrossRef CAS.
- R. Z. Batran, S. M. El-Daly, W. A. El-Kashak and E. Y. Ahmed, Chem. Biol. Drug Des., 2022, 99, 470–482 CrossRef CAS PubMed.
- R. Z. Batran, W. A. El-Kashak, S. M. El-Daly and E. Y. Ahmed, ChemistrySelect, 2021, 6, 11012–11021 CrossRef CAS.
- E. Y. Ahmed, N. A. Abdel Latif, M. F. El-Mansy, W. S. Elserwy and O. M. Abdelhafez, Bioorg. Med. Chem., 2020, 28, 115328 CrossRef CAS PubMed.
- E. Y. Ahmed, O. M. Abdelhafez, D. Zaafar, A. M. Serry, Y. H. Ahmed, R. F. A. El-Telbany, Z. Y. Abd Elmageed and H. I. Ali, Arch. Pharm., 2022, 355, 2100327 CrossRef CAS.
- E. Y. Ahmed, N. A. Abdel Latif, T. Nasr, H. M. Awad and O. M. Abdelhafez, Chem. Biol. Drug Des., 2022, 99, 609–619 CrossRef CAS PubMed.
- R. Z. Batran, D. H. Dawood, S. A. El-Seginy, M. M. Ali, T. J. Maher, K. S. Gugnani and A. N. Rondon-Ortiz, Arch. Pharm., 2017, 350, e1700064 CrossRef PubMed.
- R. Z. Batran, E. Y. Ahmed, H. M. Awad, K. A. Ali and N. A. Abdel Latif, RSC Adv., 2023, 13, 29070–29085 RSC.
- R. Z. Batran, E. Y. Ahmed, E. S. Nossier, H. M. Awad and N. A. Abdel Latif, J. Mol. Struct., 2024, 1305, 137790 CrossRef CAS.
- X. Wang, A. M. Bove, G. Simone and B. Ma, Front. Cell Dev. Biol., 2020, 8, 599281 CrossRef.
- H. Huang, Sensors, 2018, 18, 3249 CrossRef.
- D. Hanahan and R. A. Weinberg, Cell, 2011, 144, 646–674 CrossRef CAS.
- J.-B. Guy, S. Espenel, A. Vallard, P. Battiston-Montagne, A.-S. Wozny, D. Ardail, G. Alphonse, C. Rancoule, C. Rodriguez-Lafrasse and N. Magne, J. Vis. Exp., 2017, 129, e56337 Search PubMed.
- M. Shahlaei, Chem. Rev., 2013, 113, 8093–8103 CrossRef CAS.
- M. Linden, S. Hofmann, A. Herman, N. Ehler, R. M. Bär and S. R. Waldvogel, Angew. Chem. Int. Ed., 2023, 62, e202214820 CrossRef CAS.
- J. Gaba, S. Sharma, G. Arora and P. Sharma, Asian J. Chem., 2016, 28, 2031–2037 CrossRef CAS.
- N. A. Danilkina, L. E. Mikhaylov and B. A. Ivin, Chem. Heterocycl. Compd., 2011, 47, 886–900 CrossRef CAS.
- D. Havrylyuk, B. Zimenkovsky, O. Karpenko, P. Grellier and R. Lesyk, Eur. J. Med. Chem., 2014, 85, 245–254 CrossRef CAS PubMed.
- H. A. Soliman, A. Y. Mubarak, A. El-Mekabaty, H. M. Awad and S. S. Elmorsy, Monatsh. Chem., 2016, 147, 809–816 CrossRef CAS.
- A. F. Kassem, I. F. Nassar, M. T. Abdel-Aal, H. M. Awad and W. A. El-Sayed, Chem. Pharm. Bull., 2019, 67, 888–895 CrossRef CAS PubMed.
- E. M. Flefel, W. I. El-Sofany, H. M. Awad and M. El-Shahat, Mini-Rev. Med. Chem., 2020, 20, 152–160 CrossRef CAS.
- A. A. H. A. Rahman, I. F. Nassar, A. K. F. Shaban, D. S. EL-Kady, H. M. Awad and W. A. El Sayed, Mini-Rev. Med. Chem., 2019, 19, 1093–1110 CrossRef.
- S. M. El-Daly, M. T. Abo-elfadl, J. Hussein and M. A. M. Abo-Zeid, Life Sci., 2023, 315, 121320 CrossRef CAS.
- S. Diab, T. Teo, M. Kumarasiri, P. Li, M. Yu, F. Lam, S. K. C. Basnet, M. J. Sykes, H. Albrecht, R. Milne and S. Wang, ChemMedChem, 2014, 9, 962–972 CrossRef CAS.
- I. Mierswa, M. Wurst, R. Klinkenberg, M. Scholz and T. Euler, in Proceedings of the 12th ACM SIGKDD International Conference on Knowledge Discovery and Data Mining, ACM, New York, NY, USA, 2006, pp. 935–940 Search PubMed.
- A. Agrwal, A. Verma, N. Chantola, S. Verma and V. Kasana, J. Environ. Sci. Health B, 2022, 57, 379–420 CrossRef CAS.
- J. Eberhardt, D. Santos-Martins, A. F. Tillack and S. Forli, J. Chem. Inf. Model., 2021, 61, 3891–3898 CrossRef CAS PubMed.
- O. Trott and A. J. Olson, J. Comput. Chem., 2010, 31, 455–461 CrossRef CAS PubMed.
- K. Ito, Y. Nakajima, Y. Onohara, M. Takeo, K. Nakashima, F. Matsubara, T. Ito and T. Yoshimoto, J. Biol. Chem., 2006, 281, 33664–33676 CrossRef CAS PubMed.
- S. Dallakyan and A. J. Olson, Methods Mol. Biol., 2015, 1263, 243–250 CrossRef CAS PubMed.
- E. W. Bell and Y. Zhang, J. Cheminf., 2019, 11, 40 Search PubMed.
- B. R. Brooks, C. L. Brooks, A. D. Mackerell, L. Nilsson, R. J. Petrella, B. Roux, Y. Won, G. Archontis, C. Bartels, S. Boresch, A. Caflisch, L. Caves, Q. Cui, A. R. Dinner, M. Feig, S. Fischer, J. Gao, M. Hodoscek, W. Im, K. Kuczera, T. Lazaridis, J. Ma, V. Ovchinnikov, E. Paci, R. W. Pastor, C. B. Post, J. Z. Pu, M. Schaefer, B. Tidor, R. M. Venable, H. L. Woodcock, X. Wu, W. Yang, D. M. York and M. Karplus, J. Comput. Chem., 2009, 30, 1545–1614 CrossRef CAS.
- K. Vanommeslaeghe, E. Hatcher, C. Acharya, S. Kundu, S. Zhong, J. Shim, E. Darian, O. Guvench, P. Lopes, I. Vorobyov and A. D. Mackerell, J. Comput. Chem., 2010, 31, 671–690 CrossRef CAS.
- M. J. Abraham, T. Murtola, R. Schulz, S. Páll, J. C. Smith, B. Hess and E. Lindahl, SoftwareX, 2015, 1–2, 19–25 CrossRef.
- W. Humphrey, A. Dalke and K. Schulten, J. Mol. Graph., 1996, 14(33–8), 27–28 Search PubMed.
- R. Kumari, R. Kumar and A. Lynn, J. Chem. Inf. Model., 2014, 54, 1951–1962 CrossRef CAS PubMed.
Footnote |
| † Electronic supplementary information (ESI) available. See DOI: https://doi.org/10.1039/d4ra01801j |
| This journal is © The Royal Society of Chemistry 2024 |

