 Open Access Article
Preparation and performance study of in situ mineralized bone tissue engineering scaffolds
Chunyan Tiana,
Kun Lia,
Fuhuan Chua,
Qiujiang Weia,
Shiqi Xu *abc,
Linhui Qiang*abc and
Xinrui Goua
aDepartment of Biomedical Engineering, Chengde Medical University, Chengde, 067000, Hebei, China. E-mail: xushiqi@cdmc.edu.cn; qianglinhui@163.com; Tel: +86-13343396119 Tel: +86-17774937339
bHebei International Research Center for Medical-Engineering, Chengde Medical University, Chengde, 067000, Hebei, China
cChengde Medical Additive Manufacturing Technology Innovation Center, Chengde Medical University, Chengde, 067000, Hebei, China
First published on 15th July 2024
Abstract
Traditional bone tissue engineering techniques require the extraction and proliferation of seed cells, followed by prolonged in vitro culture to form bone tissue constructs. In contrast, in situ mineralization bone tissue engineering utilizes alkaline phosphatase within the body's microenvironment to induce scaffold mineralization. This approach promotes further proliferation and differentiation of osteoblasts and the formation of bone tissue constructs, thereby simplifying the traditional bone tissue engineering process. This study uses electrospinning technology to prepare a novel biologically active scaffold for bone tissue engineering using poly(lactic-co-glycolic acid) (PLGA) and calcium glycerophosphate. The morphology and composition of the scaffolds were characterized using SEM, EDS, and XRD, revealing well-defined fibrous structures and the successful incorporation of calcium glycerophosphate into the PLGA fibers. In vitro simulation of the bone microenvironment using alkaline phosphatase effectively catalyzed the in situ mineralization of calcium glycerophosphate within the scaffold. SEM observations showed substantial mineral aggregation on the surface of the fibrous membranes, and XRD characterization confirmed that the diffraction peaks of the minerals correspond to hydroxyapatite. The cytotoxicity, cell proliferation, and osteogenic differentiation assessments on MC3T3-E1 pre-osteoblasts cultured on the prepared scaffolds indicate that the scaffolds are non-toxic to cells and possess good osteogenic differentiation ability, enabling in situ mineralization. This suggests that the scaffolds have broad prospects for application in bone defect repair.
1 Introduction
The skeletal system is crucial in supporting and protecting the human body.1 Accidents, diseases, tumors, and other causes can all lead to bone defects, and treating this problem still presents significant challenges. Bones can regenerate and repair themselves to a certain extent. Still, large areas of bone defects cannot heal on their own,2,3 and require external intervention and assistance to promote bone regeneration in the affected area.4 Clinical methods used for bone tissue regeneration include autografts, allografts, demineralized allografts, and artificial bone substitutes.5 Autografts are currently considered the gold standard for treating bone defect diseases.5–7 But autologous bone transplantation is derived from the patients themselves, and the source is limited. Xenograft bone transplantation can reduce unnecessary trauma for patients and does not carry the risks of immune rejection or disease transmission. However, xenograft materials, such as deproteinized bovine bone matrix, often lack osteoinductive and osteogenic properties.8In recent years, tissue engineering has provided a new approach to treating bone defects.9–11 Tissue engineering approaches involve pre-fabricating scaffolds, which are then seeded with cells and growth factors. After a period of in vitro cultivation, these constructs are transplanted in vivo to accelerate bone regeneration at defect sites.12–14
The preparation of tissue engineering scaffolds mainly involves technologies such as electrospinning, 3D printing, and the sol–gel method. Electrospinning is a commonly employed method for fabricating nanofibrous scaffolds for tissue engineering. This technique utilizes electrostatic forces to draw polymer solutions into fibers, which are subsequently collected to form the desired fibrous membrane scaffolds.15,16 This technique offers the advantage of controlling fiber diameter, morphology, and surface characteristics, resulting in fibrous scaffolds with excellent porosity and structural features. These properties facilitate cell adhesion, proliferation, and tissue regeneration.17,18
In tissue engineering for bone defect repair, cells need to be cultured in vitro and then implanted into the body for bone regeneration, which requires a more extended period. In addition, there are many uncertainties in the in vitro culture of seed cells, all of which limit the clinical translation of bone tissue-engineered scaffolds.19
The in situ mineralization method, which has recently attracted considerable attention as a bone repair technique, has generated widespread interest due to its unique mechanism and potential advantages. Zhang et al.20 developed an in situ mineralized composite hydrogel, utilizing endogenous bone alkaline phosphatase to catalyze the in situ conversion of calcium glycerophosphate and calcium carbonate incorporated within the hydrogel into hydroxyapatite nanocrystals. This composite hydrogel exhibits excellent biocompatibility and can be utilized for tooth restoration as well as the regeneration of complex tissues. Liu et al.21 proposed an in situ mineralized PLGA/PSBMA hydrogel composite scaffold capable of efficiently releasing rhBMP-2. Their research demonstrated that this scaffold effectively facilitated the robust healing of critical-sized non-condylar bone defects in rats. Additionally, researchers have investigated an osteoinductive hybrid hydrogel membrane for in situ bone regeneration in hyperglycemic patients. This study involved incorporating a biomineralized calcium source onto the surface of the hybrid hydrogel, creating an osteoinductive microenvironment through the release of calcium ions. The results demonstrated that this membrane stimulated angiogenesis in a diabetic model and accelerated the effective repair of bone defect areas.22
The in situ mineralization method primarily simulates the natural bone mineralization process, aiming to fully utilize the physiological processes within the body and induce mineralization at the site of injury to promote the growth and repair of bone tissue, thereby reducing the need for external intervention.23 This method not only reduces the patient's pain but also has the potential to shorten the recovery time and reduce the need for surgery and other exogenous treatments.24 This method has many potential advantages, such as not requiring cell culture in vitro and directly implanting the prepared scaffold into the body. It utilizes the components of the in vivo microenvironment to induce bone cell growth, which can reduce unnecessary risks and provide a more innovative and effective option for bone tissue repair.
In summary, this study proposed an in situ mineralized, highly biocompatible bone tissue engineering scaffold. This scaffold utilizes bone-alkaline phosphatase in the in vivo microenvironment to catalyze the in situ mineralization of calcium sources within the bone tissue engineering scaffold. It achieves degradation and in situ mineralization of the scaffold while constructing an environment conducive to the growth of osteoblasts with high mechanical strength and similar microstructures as bone tissue, promoting bone induction and conduction.
2 Materials and methods
2.1 Materials
Polylactic acid–glycolic acid copolymer (PLGA 75![[thin space (1/6-em)]](https://www.rsc.org/images/entities/char_2009.gif) :
:![[thin space (1/6-em)]](https://www.rsc.org/images/entities/char_2009.gif) 25, Jinan Daisan Biological Engineering Co., Ltd); hexafluoroisopropanol (HIFP, 99.5%, Aladdin); calcium glycerophosphate (CaG, 98%, Shanghai Yuanphen Biotechnology Co., Ltd); glycerin (ACS, ≥99.5%, Aladdin); alkaline phosphatase (ALP, activity > 1000 μ mg−1, bovine intestinal, Shanghai Yuanphen Biotechnology Co., Ltd); Phosphate Buffered Saline (PBS, 0.2 mol L−1, pH 9.0, Shanghai Yuanphen Biotechnology Co., Ltd).
25, Jinan Daisan Biological Engineering Co., Ltd); hexafluoroisopropanol (HIFP, 99.5%, Aladdin); calcium glycerophosphate (CaG, 98%, Shanghai Yuanphen Biotechnology Co., Ltd); glycerin (ACS, ≥99.5%, Aladdin); alkaline phosphatase (ALP, activity > 1000 μ mg−1, bovine intestinal, Shanghai Yuanphen Biotechnology Co., Ltd); Phosphate Buffered Saline (PBS, 0.2 mol L−1, pH 9.0, Shanghai Yuanphen Biotechnology Co., Ltd).
2.2 Scaffold fabrication
Then, the CaG powder was added to glycerin, heated, and stirred at 90 °C until the solution was dissolved entirely and became transparent, resulting in a series of CaG solutions with varying concentrations. One of the roles of glycerol is to promote the dissolution of calcium glycerophosphate, enabling its even distribution in the spinning precursor solution.
A specific volume of PLGA-8 solution was mixed and stirred with CaG solution to generate a series of PLGA/CaG composite solutions. The final composite solutions contained CaG additions of 0 wt%, 7.2 wt%, 15.8 wt%, 20.1 wt%, 23.8 wt% and 27.3 wt% (the mass percentage of CaG in the composite solution). The sample with a CaG addition of 0 was prepared as the control group for subsequent cell experiments.
The PLGA/CaG mixed solution was first stirred in the vortex again. Then, the prepared electrospinning solution was drawn into a 10 mL disposable syringe with a needle diameter of 0.8 mm. The syringe was left to stand for 5 minutes and lightly tapped to expel bubbles in the tube. After that, electrospinning was performed under a series of constant parameters: flow rate at 1 mL h−1, adjusting the distance between the needle tip and the collector, controlling the voltage, and performing at room temperature. Using aluminum foil as a collector, the collected fiber membrane is vacuum-dried for at least 24 hours to remove residual solvents. For subsequent characterization and analysis, the fibrous membranes were prepared from PLGA/CaG composite solutions with CaG concentrations of 0 wt%, 7.2 wt%, 15.8 wt%, 20.1 wt%, 23.8 wt%, and 27.3 wt% were respectively designated as PLGA/CaG-0, PLGA/CaG-7.2, PLGA/CaG-15.8, PLGA/CaG-20.1, PLGA/CaG-23.8, and PLGA/CaG-27.3.
2.3 Characterization of the scaffolds
2.4 In vitro degradation
To evaluate the in vitro degradation of the PLGA/CaG-23.8 fiber scaffold, it was immersed in a phosphate-buffered saline (PBS) solution at 37 °C and pH 7.4. Place the fiber scaffold in a vacuum-drying oven and dry it to a constant weight. Record the initial mass as m0. These pieces were placed in a 24-well plate containing PBS, replacing the solution every 5 days. After 7, 14, and 21 days of immersion, the samples were removed, rinsed three times with deionized water, dried, and weighed to obtain the final mass m1. The mass loss rate was calculated using the formula: mass loss rate = (m0 − m1)/m0 × 100%.262.5 In vitro simulation of in situ mineralization
2.6 Mechanical properties
In a room-temperature environment, the compressive mechanical properties of the mineralized fiber scaffolds were characterized at a compression rate of 0.5 mm min−1 with a mechanical load of 100 N. Mechanical tests were performed on PLGA/CaG-23.8 scaffolds mineralized for 3 and 7 days. All samples were cut into rectangular specimens measuring 6 mm × 5 mm × 4 mm, with three parallel groups for each scaffold type.2.7 Evaluation of biocompatibility
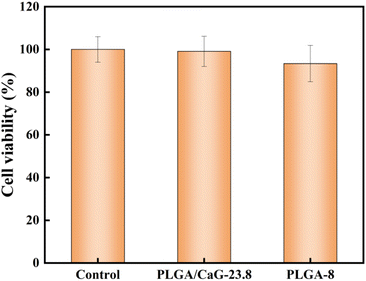
We used MC3T3-E1 mouse embryonic osteoblasts to evaluate the fiber scaffold's cytotoxicity, adhesion, and proliferation properties. Prepare DMEM high-glucose culture medium (10% fetal bovine serum and 1% penicillin–streptomycin solution), revive MC3T3-E1 cells (mouse embryonic osteoblast progenitor cells), and culture them in a 37 °C incubator with 95% relative humidity and 5% CO2 for subculture. The experiment had four groups: the PLGA/CaG-23.8 group, the PLGA-8 group, the control group, and the blank medium group. PLGA/CaG-23.8 and PLGA-8 fiber membranes were punched into 6 mm diameter discs using a punch and then sterilized with UV light for 2 hours. They were placed in 96-well plates as the PLGA/CaG-23.8 group and the PLGA-8 group. Take a certain amount of cell suspension and adjust the cell concentration to 8 × 10⁴ cells per mL. Add 100 μL of the cell suspension to each group of PLGA/CaG-23.8, PLGA-8, and the control group. Add an equal volume of cell complete culture medium to the blank medium group. Place all samples in the incubator.| Cellular toxicity grade | Relative cell proliferation rate (%) | Evaluation |
|---|---|---|
| 0 | ≥100 | Noncytotoxic |
| 1 | 75–99 | Mild cytotoxicity |
| 2 | 50–74 | Moderate cytotoxicity |
| 3 | ≤49 | Severe cytotoxicity |
2.8 Evaluation of in vitro osteogenic performance
The MC3T3-E1 mouse embryonic osteoblasts were used to evaluate osteoblasts' in situ mineralization and differentiation on the fiber scaffold. The cell culture method is described in section 2.5. The experiment had three groups: PLGA/CaG-23.8 group, PLGA-8 group, and A-7 group.After 7 d, 14 d, and 21 d of cell culture, the culture medium was aspirated, and the cells were gently washed with sterile PBS three times. Each well was then incubated with 55 μL of cell lysis solution for 3 minutes to lyse the cells. Subsequently, 50 μL of the lysate was transferred to a blank 96-well plate, and standard and blank wells were set up. Following Table 2 instructions, each well was sequentially added with the following reagents, and the OD value at 520 nm was measured using a microplate reader.
| Blank | Standard | PLGA/CaG-23.8 | PLGA-8 | A-7 | |
|---|---|---|---|---|---|
| Double-distilled water (μL) | 5 | ||||
| 0.1 mg per mL phenol standard application (μL) | 5 | ||||
| Buffer solution (μL) | 50 | 50 | 50 | 50 | 50 |
| Thoroughly mix the solution in a water bath at 37 °C for 15 minutes | |||||
| A chromophore (μL) | 150 | 150 | 150 | 150 | |
| Measure the absorbance at 520 nm using a microplate reader | |||||
In each well, add 120 μL of the 10% chloro-hexadecyl-pyridinium chloride solution prepared immediately, and incubate the plate at 37 °C in a thermo-shaker for 10 minutes. Remove 100 μL of the solution from each well and transfer it to a blank well. Use a microplate reader to measure the absorbance at 562 nm for quantitative detection data of cellular calcium nodules.
2.9 Statistical analyses
In this study, each experimental section was repeated three times, and the result of each study was expressed as mean ± standard deviation. One-way analysis of variance (ANOVA) was used to analyze statistical differences between the experimental groups. The difference was considered to be statistically significant when P < 0.05.3 Results and discussion
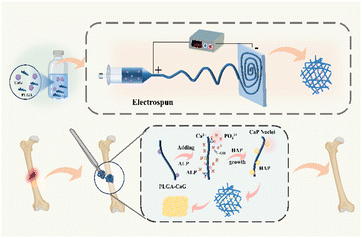
The process of preparing and in situ mineralizing the scaffold is illustrated in Fig. 1. Firstly, a precursor solution is prepared by adding a certain amount of calcium phosphate and thoroughly stirring to ensure complete dissolution throughout the solution. Secondly, we utilized electrospinning technology to fabricate fiber scaffolds. By applying a high-voltage electric field, the solution is drawn into a filament and collected on the corresponding collector. The voltage and the distance between the needle tip and the collector are adjusted to regulate the morphology and diameter of the fibers. The prepared scaffold is implanted into the body, and ALP catalyzes the mineralization of the scaffold in the bone microenvironment, ultimately facilitating bone defect repair.3.1 Scanning electron microscope (SEM) and energy-dispersive X-ray spectroscopy (EDS)
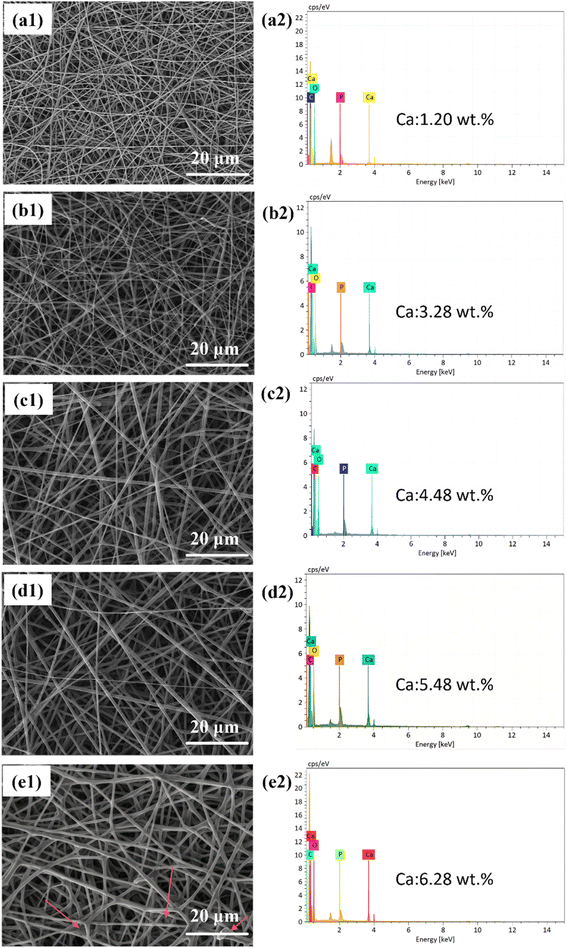
The EDS analysis (Fig. 2(a2)–(e2)) was conducted to detect the elements C, O, P, and Ca within the fibers. The EDS results indicate that the Ca content increases with an increase in CaG addition. The fiber morphology is relatively better when the Ca content is 5.48 wt% or lower, but once it reaches 6.28 wt%, a sticky phenomenon occurs on the fiber surface. During the adhesion process, fibers can form irregular aggregates, resulting in significant variations in fiber diameter across different regions. This increases the range of fiber diameter distribution and leads to the formation of non-uniform pores. A broad fiber diameter distribution and uneven pore structure can hinder cell attachment and spread on the scaffold, affecting cell proliferation.30 Furthermore, the non-uniform pore structure can impede the transport of nutrients, limiting cell growth.31 Therefore, we selected the PLGA/CaG-23.8 fiber scaffold in this study, which exhibited higher CaG concentration and better morphology, for subsequent experiments.
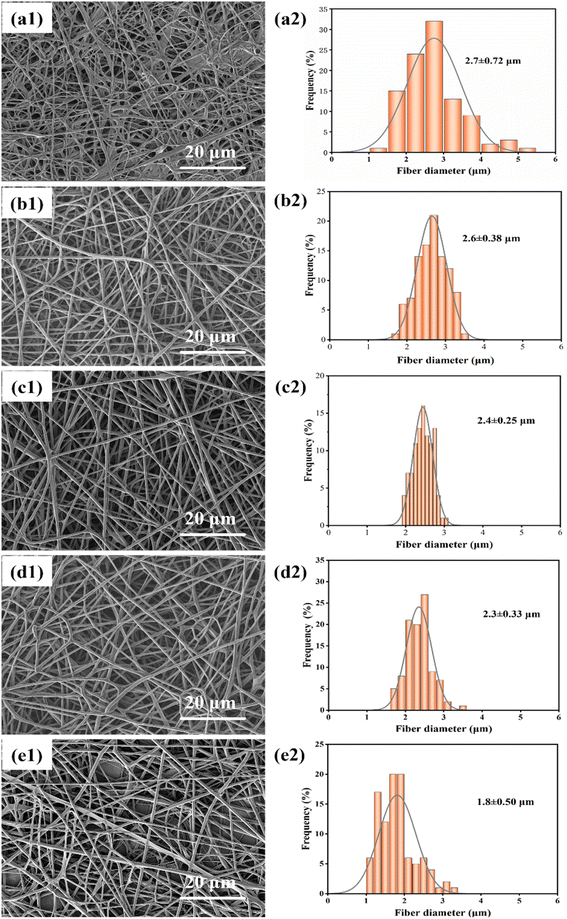 | ||
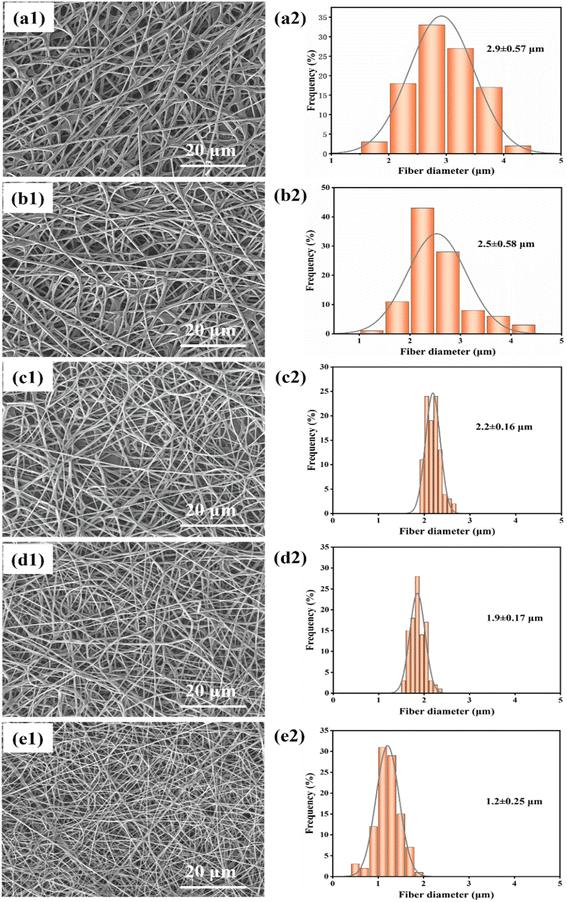
| Fig. 3 (a1)–(e1) Show SEM images of fibers spun at distances of 13 cm, 17 cm, 20 cm, 25 cm, and 29 cm, respectively; (a2)–(e2) show the diameter distribution of fibers at different distances. | ||
The diameter distribution of fibers at different distances is shown in Fig. 3(a2)–(e2), and it is observed that the diameter of fibers decreases as the distance increases. The average diameter of the fibers is maximum at 2.7 ± 0.72 μm when the distance between the needle tip and the collector is 13 cm. However, when the distance is increased to 29 cm, the average diameter of the fibers reduces to 1.8 ± 0.50 μm. Among them, at a distance of 20 cm, there is a minor standard deviation of fiber diameter (0.25 μm), indicating that the fibers are more uniform in diameter at this distance. Therefore, it can be concluded that an optimal distance between the needle tip and collector would be 20 cm.
3.2 In vitro degradation
The degradation performance of the PLGA/CaG-23.8 fiber membrane was evaluated in this study. As shown in Fig. 5, the fiber membrane exhibited a mass loss of 7.21% after 7 days of degradation in PBS. As time progressed, the degradation rate increased, with a mass loss of 10.36% at 14 days and 15.48% at 21 days, indicating significant degradation and dissolution of the molecules within the scaffold. In the early stages of degradation, the mass loss rate was not particularly high. However, as degradation continued and small, soluble molecules were produced, the mass loss rate significantly accelerated.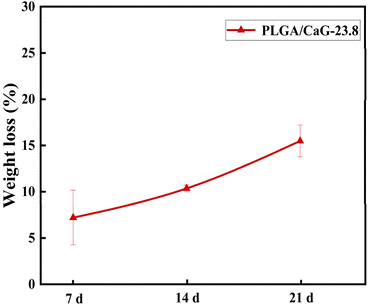 | ||
| Fig. 5 The mass loss rates of the PLGA/CaG-23.8 fiber scaffold after degradation in PBS for 7, 14, and 21 days. | ||
3.3 In vitro simulation of in situ mineralization
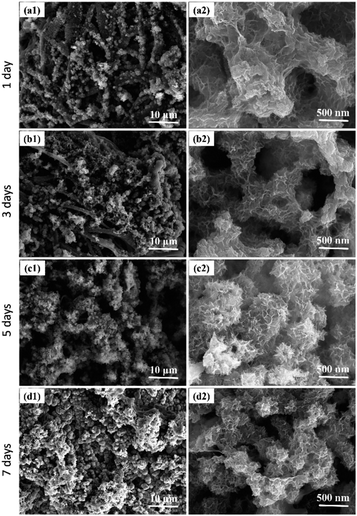
The results mentioned above indicate that enzymatic catalysis can facilitate the mineralization of calcium phosphate within the fibers. The quantity of mineral deposits and the fibrous membrane's morphology can be controlled by extending the mineralization time. With sufficient enzyme content, prolonged mineralization time leads to an increased amount of mineral deposits on the fiber surfaces, thereby enhancing the mechanical strength of the bone tissue engineering scaffold.41 As the scaffold degrades, the fibrous membrane is gradually replaced by mineral deposits, forming a structure composed entirely of minerals.
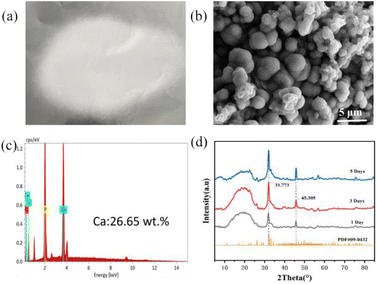 | ||
| Fig. 7 (a) PLGA/CaG fiber scaffold; (b) SEM image of the mineral; (c) EDS analysis of the mineral; (d) XRD analysis of the mineral. | ||
We conducted an XRD analysis to analyze the mineralization properties further, as shown in Fig. 7(d). Some characteristic peaks appeared at 2θ angles of 31.773° and 45.305°, consistent with the standard diffraction peaks of HAP (JCPDS 09-0432).42 This result confirms that the mineralization is composed of hydroxyapatite.
Based on the above results, it can be concluded that APL can catalyze the mineralization of CaG added to the fiber, ultimately forming a component similar to hydroxyapatite found in bones. This process helps promote bone induction and conduction.43
3.4 Mechanical properties testing
The mechanical properties of fiber scaffolds are crucial for bone tissue repair. In this study, the compressive mechanical properties of the mineralized PLGA/CaG-23.8 fiber scaffold were evaluated. The stress–strain curves are presented in Fig. 8. Compared to scaffolds mineralized for 3 days, those mineralized for 7 days exhibited significantly higher compressive strength and modulus. Specifically, after 3 days of mineralization, the compressive strength and modulus were 3.23 MPa and 8.06 MPa, respectively. These values increased to 3.64 MPa and 8.45 MPa after 7 days of mineralization. As confirmed by previous SEM and EDS analyses, this improvement can be attributed to the increased deposition of hydroxyapatite on the fiber surfaces, forming a more robust structural network that distributes the load more effectively.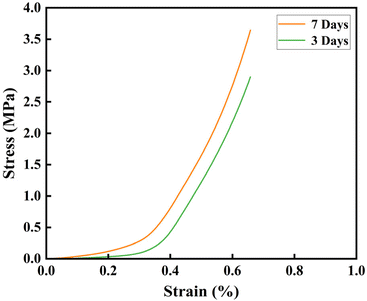 | ||
| Fig. 8 Compressive stress–strain curves for PLGA/CaG fiber scaffolds after 3 and 7 days of mineralization. | ||
3.5 Biocompatibility assessment
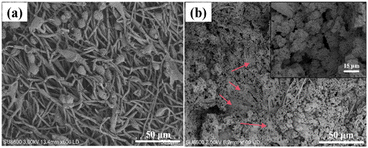 | ||
| Fig. 10 SEM images of MC3T3-E1 cells after culturing on the scaffold, (a) PLGA-8, (b) PLGA/CaG-23.8. | ||
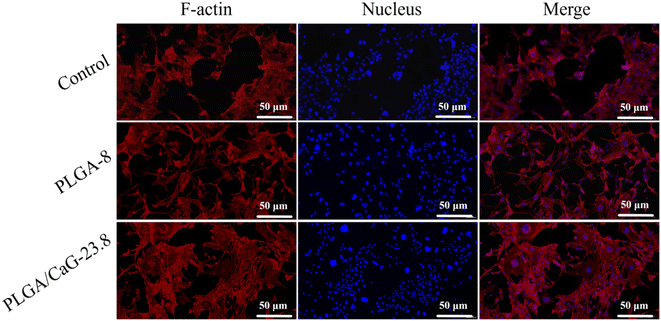
The scaffolds were stained to evaluate cell adhesion and spreading on the PLGA-8 and PLGA/CaG-23.8 fibrous scaffolds. The experimental results are shown in Fig. 11. After 48 hours of cell culture, cells were observed to spread well on both the PLGA-8 and PLGA/CaG-23.8 scaffolds. Compared to the PLGA-8 scaffold, the PLGA/CaG-23.8 scaffold exhibited a higher cell density and more extensive cell distribution. These results indicate that the PLGA/CaG-23.8 scaffold provides a more favorable environment for cell adhesion.
3.6 Evaluation of in vitro osteogenic performance
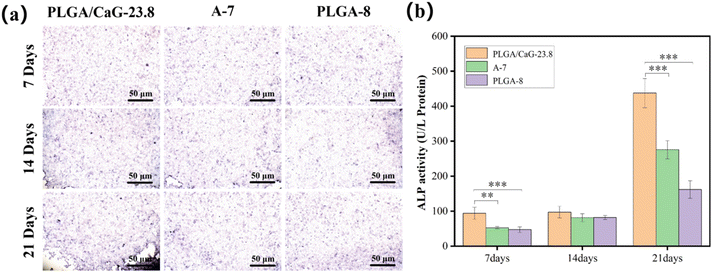
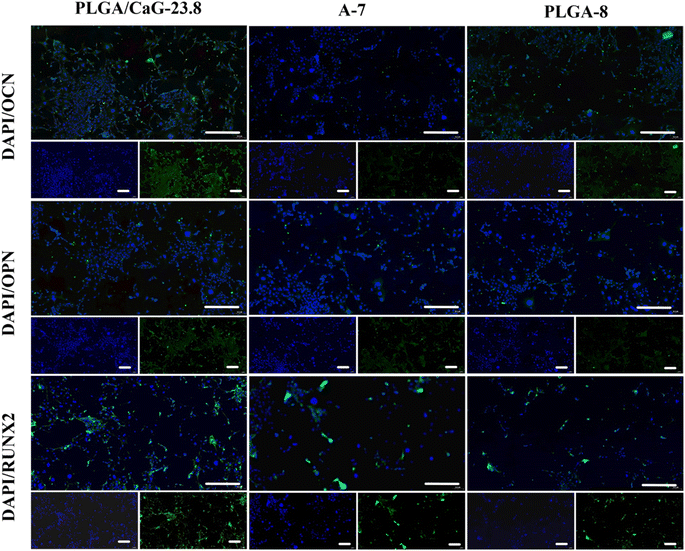
Table 3 and Fig. 12(b) present the ALP values after culturing cells in different groups for 7, 14, and 21 days, clearly demonstrating the differences among the groups over time. ALP enzyme activity levels were measured in cells cultured for 7 d, 14 d, and 21 d, and it was found that the enzyme activity value in the PLGA/CaG-23.8 group was significantly higher than that in the PLGA-8 and A-7 groups. This indicates that the PLGA/CaG-23.8 scaffold is more conducive to promoting early osteoblast differentiation.
| ALP (U L−1) | OD562 | ||
|---|---|---|---|
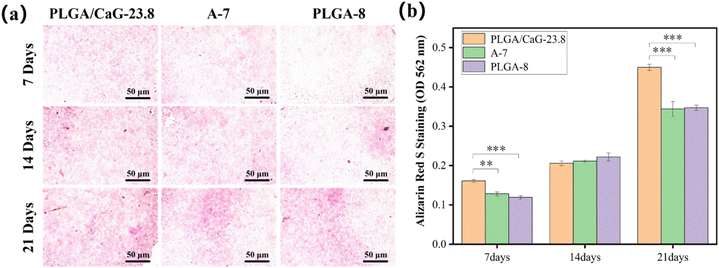
| 7 d | PLGA/CaG-23.8 | 93.613 ± 17.211 | 0.161 ± 0.004 |
| A-7 | 52.493 ± 3.154 | 0.128 ± 0.005 | |
| PLGA-8 | 46.952 ± 8.315 | 0.119 ± 0.004 | |
| 14 d | PLGA/CaG-23.8 | 97.113 ± 16.692 | 0.206 ± 0.006 |
| A-7 | 81.365 ± 11.374 | 0.211 ± 0.003 | |
| PLGA-8 | 81.656 ± 5.955 | 0.222 ± 0.010 | |
| 21 d | PLGA/CaG-23.8 | 437.445 ± 41.564 | 0.450 ± 0.008 |
| A-7 | 275.591 ± 26.086 | 0.344 ± 0.019 | |
| PLGA-8 | 161.884 ± 25.301 | 0.347 ± 0.007 |
Fig. 13(a) displays the qualitative results of calcium nodule formation, indicating that the PLGA/CaG-23.8 group exhibits a broader range of pink calcium nodules formed at 7 d, 14 d, and 21 d. The staining becomes more pronounced as the cell culture time increases. The results indicate that the osteogenic cells in the PLGA/CaG-23.8 scaffold have a stronger mineralization ability. In comparison, there are fewer calcified nodules and lighter staining in the PLGA-8 and A-7 groups. Table 3 and Fig. 13(b) present the quantitative analysis results of calcium nodule content, which show that the calcium nodule content of the PLGA/CaG-23.8 scaffold at 7 d and 21 d is significantly higher than that of the PLGA-8 and A-7 groups. This result further confirms that osteogenic cells in the PLGA/CaG-23.8 scaffold have a stronger mineralization ability.
4 Conclusions
In this study, we successfully prepared PLGA/CaG-23.8 in situ mineralized bone tissue engineering scaffolds using electrospinning technology and demonstrated their in situ mineralization properties. The addition of CaG to the scaffolds influenced the fiber morphology, with lower concentrations of CaG resulting in finer and more uniform fibers. The optimal amount of CaG added to the scaffolds was determined to be 23.8 wt% as it exhibited the best fiber morphology. EDS energy spectrum analysis detected a high mass percentage of calcium (5.48 wt%). During the spinning process, the best fiber morphology was achieved at a voltage of 12.5 kV and a tip-to-receiver distance of 20 cm.In vitro, simulated mineralization experiments showed that a large number of mineralized products formed on the surface of the scaffold after ALP mineralization. XRD analysis indicated that the diffraction peaks of the mineralized products were consistent with those of HAP. The results from MC3T3-E1 cell experiments showed excellent cell compatibility for the PLGA/CaG-23.8 scaffold, with a survival rate of 99.08 ± 7.05%, and well-spread cells on the scaffold. ALP activity, calcium nodule formation, and bone-related protein detection indicated that the PLGA/CaG-23.8 scaffold significantly promoted osteogenic differentiation, with MC3T3-E1 cells secreting a large amount of ALP during their growth on the scaffold, catalyzing in situ mineralization of CaG to form honeycomb-like structures consistent with HAP.
In summary, the PLGA/CaG-23.8 scaffolds prepared in this study have adjustable morphology, good biocompatibility, strong osteogenic differentiation ability, and the potential to play an essential role in bone defect repair, providing a feasible material for treating bone defects.
Data availability
The raw/processed data required to reproduce these findings cannot be shared as the data also form part of an ongoing study. However, detailed descriptions and summaries of the data are available within the article. Further inquiries can be directed to the corresponding author.Author contributions
Conceptualization, L. Q. and C. T.; data curation, C. T.; formal analysis, C. T., L. Q. and S. X.; funding acquisition, S. X.; investigation, C. T., K. L., F. C. and Q. W.; methodology, L. Q. and S. X.; project administration, S. X.; resources, S. X. and L. Q.; software, C. T. and X. G.; supervision, S. X. and L. Q.; validation, S. X.; visualization, L. Q. and S. X.; writing – original draft preparation, C. T.; writing – review and editing, L. Q. and S. X. All authors have read and agreed to the published this version of the manuscript.Conflicts of interest
The authors declare that they have no known competing financial interests or personal relationships that could have appeared to influence the work reported in this paper.Acknowledgements
This work was supported by Chengde Biomedicine Industry Research Institute Funding project (202205B086); Research and Application of Key Technologies for Advanced Wearable Health Equipment (202305B008); Development of customized 3D printed TC4 base step channel interbody fusion device (202304B046); Research on 3D Printing of Bio-Inspired Bone Tissue and Surgical Guides (22371301D); Research and Development of 3D Printed Hydrogel-Based Skin Sensors (KY202403); Bio-3D Printed In Situ Mineralized Bone Tissue Engineering Scaffold (KY202406).References
- L. G. Karagounis and J. A. Hawley, Int. J. Biochem. Cell Biol., 2010, 42, 1376–1379 CrossRef CAS.
- D. Tang, R. S. Tare, L.-Y. Yang, D. F. Williams, K.-L. Ou and R. O. C. Oreffo, Biomaterials, 2016, 83, 363–382 CrossRef CAS PubMed.
- T. Winkler, F. A. Sass, G. N. Duda and K. Schmidt-Bleek, Bone Joint Res., 2018, 7, 232–243 CrossRef CAS PubMed.
- S. Tang, Z. Dong, X. Ke, J. Luo and J. Li, Int. J. Oral Sci., 2021, 13, 42 CrossRef CAS PubMed.
- S. Jiang, X. Wang, Y. Ma, Y. Zhou, L. Liu, F. Yu, B. Fang, K. Lin, L. Xia and M. Cai, Int. J. Nanomed., 2022, 17, 783–797 CrossRef CAS.
- A. Shi, A. Heinayati, D. Bao, H. Liu, X. Ding, X. Tong, L. Wang, B. Wang and H. Qin, Stem Cell Res. Ther., 2019, 10, 1–15 CrossRef CAS.
- L. Wei, S. Wu, M. Kuss, X. Jiang, R. Sun, P. Reid, X. Qin and B. Duan, Bioact. Mater., 2019, 4, 256–260 Search PubMed.
- R. Dimitriou, E. Jones, D. McGonagle and P. V. Giannoudis, BMC Med., 2011, 9, 66 CrossRef.
- S. S. Lee, X. Du, I. Kim and S. J. Ferguson, Matter, 2022, 5, 2722–2759 CrossRef CAS.
- P. Kazimierczak, J. Kolmas and A. Przekora, Int. J. Mol. Sci., 2019, 20, 3835 CrossRef CAS PubMed.
- X. Xin, J. Wu, A. Zheng, D. Jiao, Y. Liu, L. Cao and X. Jiang, Int. J. Nanomed., 2019, 14, 1451–1467 CrossRef CAS.
- E. A. Casanova, A. Rodriguez-Palomo, L. Stähli, K. Arnke, O. Gröninger, M. Generali, Y. Neldner, S. Tiziani, A. P. Dominguez, M. Guizar-Sicairos, Z. Gao, C. Appel, L. C. Nielsen, M. Georgiadis, F. E. Weber, W. Stark, H.-C. Pape, P. Cinelli and M. Liebi, Biomaterials, 2023, 294, 121989 CrossRef CAS PubMed.
- Y. Y. Qi, Z. X. Tai, D. F. Sun, J. T. Chen, H. B. Ma, X. B. Yan, B. Liu and Q. J. Xue, J. Appl. Polym. Sci., 2013, 127, 1885–1894 CrossRef CAS.
- K. Xue, X. Zhang, Z. Gao, W. Xia, L. Qi and K. Liu, J. Transl. Med., 2019, 17, 104 CrossRef.
- E. A. Kamoun, S. A. Loutfy, Y. Hussein and E.-R. S. Kenawy, Int. J. Biol. Macromol., 2021, 187, 755–768 CrossRef CAS PubMed.
- Y. Sun, S. Cheng, W. Lu, Y. Wang, P. Zhang and Q. Yao, RSC Adv., 2019, 9, 25712–25729 RSC.
- L. Parisi, A. Toffoli, G. Ghiacci and G. M. Macaluso, J. Funct. Biomater., 2018, 9, 50 CrossRef CAS.
- Y. Ning, W. Shen and F. Ao, RSC Adv., 2020, 10, 37246–37265 RSC.
- J. Zheng, Y. Xie, T. Yoshitomi, N. Kawazoe, Y. Yang and G. Chen, Int. J. Mol. Sci., 2022, 23, 6406 CrossRef CAS.
- S. Zhang, Y. Zhao, S. Ding, C. Zhou, H. Li and L. Li, Tissue Eng., Part A, 2021, 27, 1225–1238 CrossRef CAS PubMed.
- P. Liu, T. Bao, L. Sun, Z. Wang, J. Sun, W. Peng, D. Gan, G. Yin, P. Liu, W.-B. Zhang and J. Shen, Biomater. Sci., 2022, 10, 781–793 RSC.
- Y. Liu, J. Wang, M. Jiang, X. Li, Q. Zhang and H. He, Colloids Surf., B, 2022, 214, 112450 CrossRef CAS.
- G. Zheng, Z. Xie, P. Wang, J. Li, M. Li, S. Cen, S. Tang, W. Liu, G. Ye, Y. Li, S. Wang, X. Wu, H. Su, Y. Wu and H. Shen, Cell Death Dis., 2019, 10, 1–11 Search PubMed.
- A. Aminatun, T. Suciati, Y. W. Sari, M. Sari, K. A. Alamsyah, W. Purnamasari and Y. Yusuf, Int. J. Polym. Mater. Polym. Biomater., 2023, 72, 376–385 CrossRef CAS.
- N. Bhardwaj and S. C. Kundu, Biotechnol. Adv., 2010, 28, 325–347 CrossRef CAS PubMed.
- M. Masoudi Rad, S. Nouri Khorasani, L. Ghasemi-Mobarakeh, M. P. Prabhakaran, M. R. Foroughi, M. Kharaziha, N. Saadatkish and S. Ramakrishna, Materials Science and Engineering: C, 2017, 80, 75–87 CrossRef CAS.
- G. Chen, X. Liang, P. Zhang, S. Lin, C. Cai, Z. Yu and J. Liu, Adv. Funct. Mater., 2022, 32, 2113262 CrossRef CAS.
- ISO I 10993–5:2009, Biological evaluation of medical devices—part 5: tests for in vitro cytotoxicity, International Organization for Standardization, Geneva, 2009, p. 34 Search PubMed.
- D. Wang, L. Xuan, H. Zhong, Y. Gong, X. Shi, F. Ye, Y. Li and Q. Jiang, RSC Adv., 2017, 7, 23982–23993 RSC.
- D. Dhamecha, D. Le, R. Movsas, A. Gonsalves and J. U. Menon, Front. Bioeng. Biotechnol., 2020, 8, 799 CrossRef PubMed.
- Y. Chen, J. Wang, X. Zhu, X. Chen, X. Yang, K. Zhang, Y. Fan and X. Zhang, Regener. Biomater., 2018, 5, 129–139 CrossRef CAS.
- A. Ivanoska-Dacikj, P. Makreski and G. Bogoeva-Gaceva, J. Ind. Text., 2022, 51, 4041S–4065S CrossRef CAS.
- J. C. Ge, G. Wu, S. K. Yoon, M. S. Kim and N. J. Choi, Nanomaterials, 2021, 11, 2514 CrossRef CAS PubMed.
- A. Rakhmanova, S. Kalybekkyzy, B. Soltabayev, A. Bissenbay, N. Kassenova, Z. Bakenov and A. Mentbayeva, Nanomaterials, 2022, 12, 1733 CrossRef CAS PubMed.
- A. Haider, S. Haider and I.-K. Kang, Arabian J. Chem., 2018, 11, 1165–1188 CrossRef CAS.
- S. Jin, J. Yu, Y. Zheng, W.-Y. Wang, B. Xin and C.-W. Kan, Nanomaterials, 2018, 8, 821 CrossRef PubMed.
- D. J. Patty, A. D. Nugraheni, I. D. Ana, A. Aminatun, Y. W. Sari, G. Gunawarman and Y. Yusuf, RSC Adv., 2023, 13, 34427–34438 RSC.
- Y. He, Y. Jin, X. Ying, Q. Wu, S. Yao, Y. Li, H. Liu, G. Ma and X. Wang, Regener. Biomater., 2020, 7, 515–525 CrossRef CAS.
- J. He, C. Chen, L. Chen, R. Cheng, J. Sun, X. Liu, L. Wang, C. Zhu, S. Hu, Y. Xue, J. Lu, H. Yang, W. Cui and Q. Shi, Research, 2022, 2022, 9809763 Search PubMed.
- A. Patel, S. H. Zaky, K. Schoedel, H. Li, V. Sant, E. Beniash, C. Sfeir, D. B. Stolz and S. Sant, Acta Biomater., 2020, 112, 262–273 CrossRef CAS PubMed.
- W. Nie, Y. Gao, D. J. McCoul, G. J. Gillispie, Y. Zhang, L. Liang and C. He, Int. J. Nanomed., 2019, 14, 3929–3941 Search PubMed.
- J.-P. Chen and Y.-S. Chang, Colloids Surf., B, 2011, 86, 169–175 CrossRef CAS PubMed.
- B. Nasiri-Tabrizi, W. J. Basirun, C. H. Yeong and W. M. Thein, Ceram. Int., 2023, 49, 7142–7179 CrossRef CAS.
- K. Pietryga, K. Reczyńska-Kolman, J. E. Reseland, H. Haugen, V. Larreta-Garde and E. Pamuła, Biocybern. Biomed. Eng., 2023, 43, 189–205 CrossRef.
- X. Ding, X. Li, C. Li, M. Qi, Z. Zhang, X. Sun, L. Wang and Y. Zhou, ACS Biomater. Sci. Eng., 2019, 5, 4574–4586 CrossRef CAS.
- F. Zou, J. Jiang, F. Lv, X. Xia and X. Ma, J. Nanobiotechnol., 2020, 18, 1–14 CrossRef.
- Y. Ma, Y. You, L. Cao, B. Liang, B. Tian, J. Dong and H. Lin, Front. Bioeng. Biotechnol., 2021, 9, 706423 CrossRef PubMed.
- J. Zhu, S. Yang, K. Cai, S. Wang, Z. Qiu, J. Huang, G. Jiang, X. Wang and X. Fang, Theranostics, 2020, 10, 6544–6560 Search PubMed.
| This journal is © The Royal Society of Chemistry 2024 |

