
 Open Access Article
 This Open Access Article is licensed under a
 Creative Commons Attribution 3.0 Unported Licence
3D-engineered WO3 microspheres assembled by 2D nanosheets with superior sodium storage capacity†
Shilpi Senguptaa,
C. Sudakarb and
Manab Kundu‡
 *a
*a
aElectrochemical Energy Storage Laboratory, Department of Chemistry, SRM Institute of Science and Technology, Chennai 603203, Tamil Nadu, India. E-mail: manab.kundu@inl.int
bMultifunctional Materials Laboratory, Department of Physics, Indian Institute of Technology Madras, Chennai 600036, India
First published on 14th May 2024
Abstract
Because of the inadequate sodium storage capacity of graphite, the exploration of high-performance SIB anodes is a crucial step forward. Herein, we report the hydrothermally synthesized self-assembled interconnected nanosheets of WO3 microspheres possessing admirable sodium storage in terms of cycling stability and acceptable rate capability. Benefitting from the interconnected nature of the nanosheets with a hollow interior, the WO3 microspheres exhibited a high sodiation capacity of 431 mA h g−1 at 100 mA g−1 and an excellent rate performance of 60 mA h g−1 at 500 mA g−1 with an impressive coulombic efficiency of around 99%. Importantly, even after continuous cycling with increasing current densities, a specific capacity as high as 220 mA h g−1 could be recovered at a current density of 50 mA g−1, suggesting excellent sodium storage reversibility.
1. Introduction
Concerns about the depletion of fossil-based resources worldwide can only be effectively addressed with the help of renewable, clean energy technologies.1–4 Energy storage technologies play an important role in the success of renewable energy integration.5,6 Lithium-ion batteries (LIBs), which have been used to power portable electronics for decades, are currently considered the best option for powering the next generation of electric vehicles and stationary applications. However, the limited reserves (0.006 wt% abundance on the earth) and the rising cost of lithium present significant obstacles to the widespread commercial production of LIBs.7 In contrast, sodium (the 4th most abundant element with 2.64 wt% abundance on the earth) resources are abundant and accessible everywhere in the world. For large-scale and stationary-storage applications, SIBs with similar electrochemical storage mechanisms have emerged as potential alternative energy storage systems.8 Similar to LIBs, the final performance (energy and power density) of SIBs will be dependent on their electrode materials. Therefore, a step forward for SIBs would be the development of new anode materials with higher capacities and better cycling stability.5,9 In recent years, the scientific community has shifted its focus to other materials, particularly conversion-type metal-ion batteries with transition metal oxide electrodes, where the different oxidation states of a compound may offer a high specific capacity for advanced applications.10,11 Cobalt oxides, nickel oxides, manganese oxides, ruthenium oxides, and tungsten oxides have been explored extensively owing to the variable oxidation states of metal ions, which facilitate redox reactions and charge storage.12–16 WO3 has recently been investigated as an anode material because of its electrochemical stability, diversity of crystalline phases, non-toxic nature, and high conductivity. From a fundamental standpoint, WO3 could be an ideal model system to study intercalation-initiated conversion reactions.17,18 Moreover, the morphology of the electrode is another key parameter in enhancing the capacity of the material by shortening the ion diffusion length. Various research groups have explored tungsten oxide at the nanometer scale with different morphologies, including nanowires,18 nanorods,19 and nanosized irregular particles.20 Santhosha et al. synthesized GO–WO3 via the sol–gel method, and for the first time, reported a sodiation capacity of 927 mA h g−1 at 30 mA g−1.21 Fanyan Zeng et al. synthesized WO3−x nanorods with in situ-hybridized oxygen vacancies in nitrogen-doped carbon nanosheets, which delivered specific capacities of 230.8 mA h g−1 and 184.6 mA h g−1 at 20 A g−1 and 30 A g−1, respectively.22 Because of only limited reports with WO3, the sodium storage mechanism and the effects of microstructures are not yet clearly understood.In this work, we have synthesized hierarchical 3D WO3 microspheres composed of very thin nanosheets using a facile hydrothermal method without any surfactant. The average thickness of the WO3 nanosheets is ∼5 nm. The staggered arrangement of interconnected ultrathin nanosheets forming hollow microspheres can provide more active sites to ease the electrolyte infiltration and enhance the contact between the active materials and electrolytes. Since microspheres have larger surface areas, they can provide more sites for Na+ storage, reduce the effects of volume changes, make Na+ intercalation into active materials easier, and decrease the diffusion length. While assessing sodium storage behaviour, the as-prepared WO3 exhibited a high sodiation capacity of 431 mA h g−1 at 100 mA g−1, and excellent rate performance of around 60 mA h g−1 at even 500 mA g−1 with an impressive coulombic efficiency of around 99%.
1.1 Experimental section
Phase pure WO3 has been synthesized by a facile process using the hydrothermal method. Tungsten hexachloride (0.3 M WCl6) and thioacetamide (0.6 M C2H5NS) were dissolved in 40 ml of deionized water and stirred for around 1 h to get a clear solution. The resultant mixture was transferred into a 50 ml Teflon-lined stainless-steel autoclave and maintained in a preheated oven (180 °C) for 48 h. After naturally cooling to room temperature, the sample was collected, centrifuged, and washed, followed by annealing at 700 °C for 1 hour at a ramp rate of 5°.The balanced chemical equation is as follows:
| 2WCl6 + 9C2H5NS → 2WO3 + 9CS2 + 12HCl |
This equation indicates that 2 moles of WCl6 react with 9 moles of C2H5NS to produce 2 moles of WO3, 9 moles of CS2, and 12 moles of HCl.
The process commences with the nucleation of minute WO3 nanoparticles (Fig. S1†). This nucleation process initiates sheet formation, wherein individual atoms or molecules congregate to create small clusters of WO3 nanosheets. Subsequently, microspheres are generated through Ostwald ripening, a phenomenon elucidating the growth of larger particles at the expense of smaller ones within a solution. This growth mechanism arises from the differing solubilities between smaller and larger particles. In the context of tungsten trioxide, larger microspheres are augmented by assimilating material from adjacent smaller ones, resulting in a reduction in the number of smaller particles and a concurrent enlargement of larger ones over time.
Continuing through Ostwald ripening, some microspheres may amalgamate and coalesce, giving rise to larger structures. Under specific conditions, these structures organize into thin, sheet-like formations. The determinants of temperature, concentration, and solvent properties exert a pivotal influence on shaping the final morphology of tungsten trioxide.
1.2 Characterization
The morphological studies of the sample were performed using field-emission scanning electron microscopy (FESEM, Thermo Scientific Apreo S). The phase and crystal structures were analyzed using the X-ray diffraction pattern obtained using a diffractometer (XRD, BRUKER USA D8 Advance, Davinci). The Raman spectra were obtained using a HORIBA (France) LABRAM HR Evolution instrument and measurements were done using a laser source with an excitation wavelength of 514 nm. The surface chemical states were analyzed by X-ray photoelectron spectroscopy (XPS, physical electronics). High-resolution transmission electron microscopy (HR-TEM, JEOL Japan, JEM-2100 Plus) studies were also performed to discern the morphology and crystal structure at the nanoscale using high-resolution and the selected area electron diffraction pattern (SAED).1.3 Electrochemical characterization
Cyclic voltammetry (CV) and galvanostatic charge–discharge (GCD) measurements were performed using a biologic electrochemical workstation in the potential range of 0.01–3.0 V. The same workstation was also used to do the electrochemical impedance spectroscopic (EIS) measurements. CR 2032-coin cells were assembled using glass fiber separators. Sodium was used as a counter electrode and 1 mol L−1 NaClO4 in ethylene carbonate (EC), ethyl methyl carbonate (EMC), and dimethyl carbonate (DMC) (1![[thin space (1/6-em)]](https://www.rsc.org/images/entities/char_2009.gif) :1:1 by volume) was used as the electrolyte. The electrodes were fabricated using a slurry-coating method with the SP carbon and polyvinylidene fluoride (PVDF) in N-methyl-2-pyrrolidinone solvent in the weight ratio of 7.5:1.5:1.
:1:1 by volume) was used as the electrolyte. The electrodes were fabricated using a slurry-coating method with the SP carbon and polyvinylidene fluoride (PVDF) in N-methyl-2-pyrrolidinone solvent in the weight ratio of 7.5:1.5:1.
2. Results and discussion
Fig. 1(a) depicts a standard Rietveld refinement plot for the X-ray diffraction pattern of the monoclinic phase of the WO3 sample. The experimental diffraction pattern is represented by symbols, while the refined one is depicted by a continuous line. The clear sharpness observed in the diffraction peaks not only indicates the high-quality crystallization of the synthesized WO3 but also the absence of any impurity peaks in the pattern. All the peaks in this spectrum can be perfectly indexed to a monoclinic phase of WO3. Fig. 2(b) depicts the crystal structure of monoclinic WO3 in a 3D view. The estimated lattice constants of a = 7.3008 Å, b = 7.5389 Å, and c = 7.6896 Å (JCPDS card # 75-2187) from the diffraction pattern match well with the reported structure of WO3.23 | ||
| Fig. 1 (a) A standard refinement plot illustrating the X-ray diffraction pattern of WO3. (b) A polyhedral representation of monoclinic WO3. (c) XPS survey spectrum of tungsten oxide (WO3). High-resolution XPS spectra of (d) oxygen (O 1s) and (e) tungsten (W 4f). (f) Raman spectrum of as-synthesized WO3. | ||
 | ||
| Fig. 2 FESEM image of WO3 (a) at low magnification and (b) at high magnification. (c) Bright-field (d) high-resolution TEM images of WO3. (e) A filtered inverse FFT image showing the lattice plane. The inset shows the FFT (fast Fourier transform) pattern. (f) EDX (energy dispersive X-ray analysis) of the corresponding HRTEM image. | ||
Using XPS, the chemical composition and oxidation states of the elements were determined. The XPS survey scan spectrum (Fig. 1(c)) shows the presence of W, O, and C. The deconvoluted O 1s core-level spectra are shown in Fig. 1(d). The W 4f (Fig. 1(e)) spectrum is proficiently divided into the tungsten orbitals W 4f5/2 and W 4f7/2, which have binding energies of 37.31 eV and 35.21 eV, respectively, confirming the presence of the W6+ oxidation state of WO3.24,25 The split between the W 4f7/2 and W 4f5/2 core levels is 2.1 eV, indicating a +6 oxidation state of W in WO3. The Raman spectrum of the as-synthesized WO3 structure is depicted in Fig. 1(f), showing the four major characteristic peaks in the 100 cm−1 to 900 cm−1 region. Two strong characteristic bands at 804 and 716 cm−1 represent the W–O–W stretching vibrations of the bridging oxygen from the monoclinic crystalline phase of WO3. The bands at 320 cm−1, 271 cm−1 and 132 cm−1 represent the bending vibrations of the (O–W–O) mode.26,27
The FESEM images (Fig. 2(a) and (b)) reveal that each microsphere consists of many interconnected nanosheets, which form a spherulitic microspherical hierarchical structure with a diameter ranging between 1.0 and 1.5 μm. The sheet-like internal microstructure remarkably increases the surface area, thus enhancing ionic diffusion. The nanosheets show hyperbranched flower structures due to subsequent nucleation. The interconnected nanosheets provide sufficient ionic channels for the electrolyte to establish large accessible internal surfaces for an electrochemical redox reaction, resulting in a high specific capacity.28
The very thin and transparent nanosheets were observed at the surface of the micro-sphere by transmission electron microscopy (TEM, Fig. 2(c)). The hollow nature of the microspheres was visible through a fracture that may have occurred during sample preparation by ultrasonication. Fig. 2(d) and (e) presents high-resolution TEM (HRTEM) displaying a lattice spacing of 0.36 nm corresponding to the (200) plane of WO3, which is in line with the XRD. The EDX spectra (Fig. 2(f)) also confirmed the presence of tungsten and oxygen in the sample.
N2 adsorption–desorption measurements were utilized to assess the specific surface areas and pore structures of WO3, as depicted in Fig. S2(a and b).† According to the IUPAC classification, the N2 adsorption–desorption isotherms exhibited pseudo-type IV hysteresis. The BET specific surface area of WO3 was determined to be 12.240 m2 g−1. Fig. S2(b)† illustrates pore-size distribution plots obtained using the BJH method for pristine WO3. The average BJH pore volume of pristine WO3 was measured at 0.045 cm3 g−1, indicating a broad pore-size distribution ranging from 19 nm to 30 nm, suggestive of the presence of macropores. The prepared WO3 microspheres demonstrated a high specific surface area and a favorable pore-size distribution.
The electrochemical studies were conducted via CV and GCD in a potential window of 0.01 V to 3 V (Fig. 3). The cyclic voltammogram for the first three consecutive cycles at a scan rate of 0.2 mV s−1 is presented in Fig. 3(a). The broad peak from ∼0.86 V to 0.29 V in the first cycle during the reduction process corresponds to the insertion of Na+ into the interlayers of WO3, followed by the peak at 0.62 V associated with the conversion of WO3 into elemental W and the irreversible SEI layer formation, as well as the insertion of Na+ (sodium ion) to form metallic W and Na2O. During the oxidation process, a broad peak was observed at ∼0.91 V due to the extraction of Na+ as well as the formation of W to WO3. From the 2nd cycle onwards, the reduction and oxidation peaks appeared at 0.8 V and 0.7 V, respectively, denoting the conversion reaction between WO and W.
| WO3 + 6Na+ + 6e− ↔ 3Na2O + W | (1) |
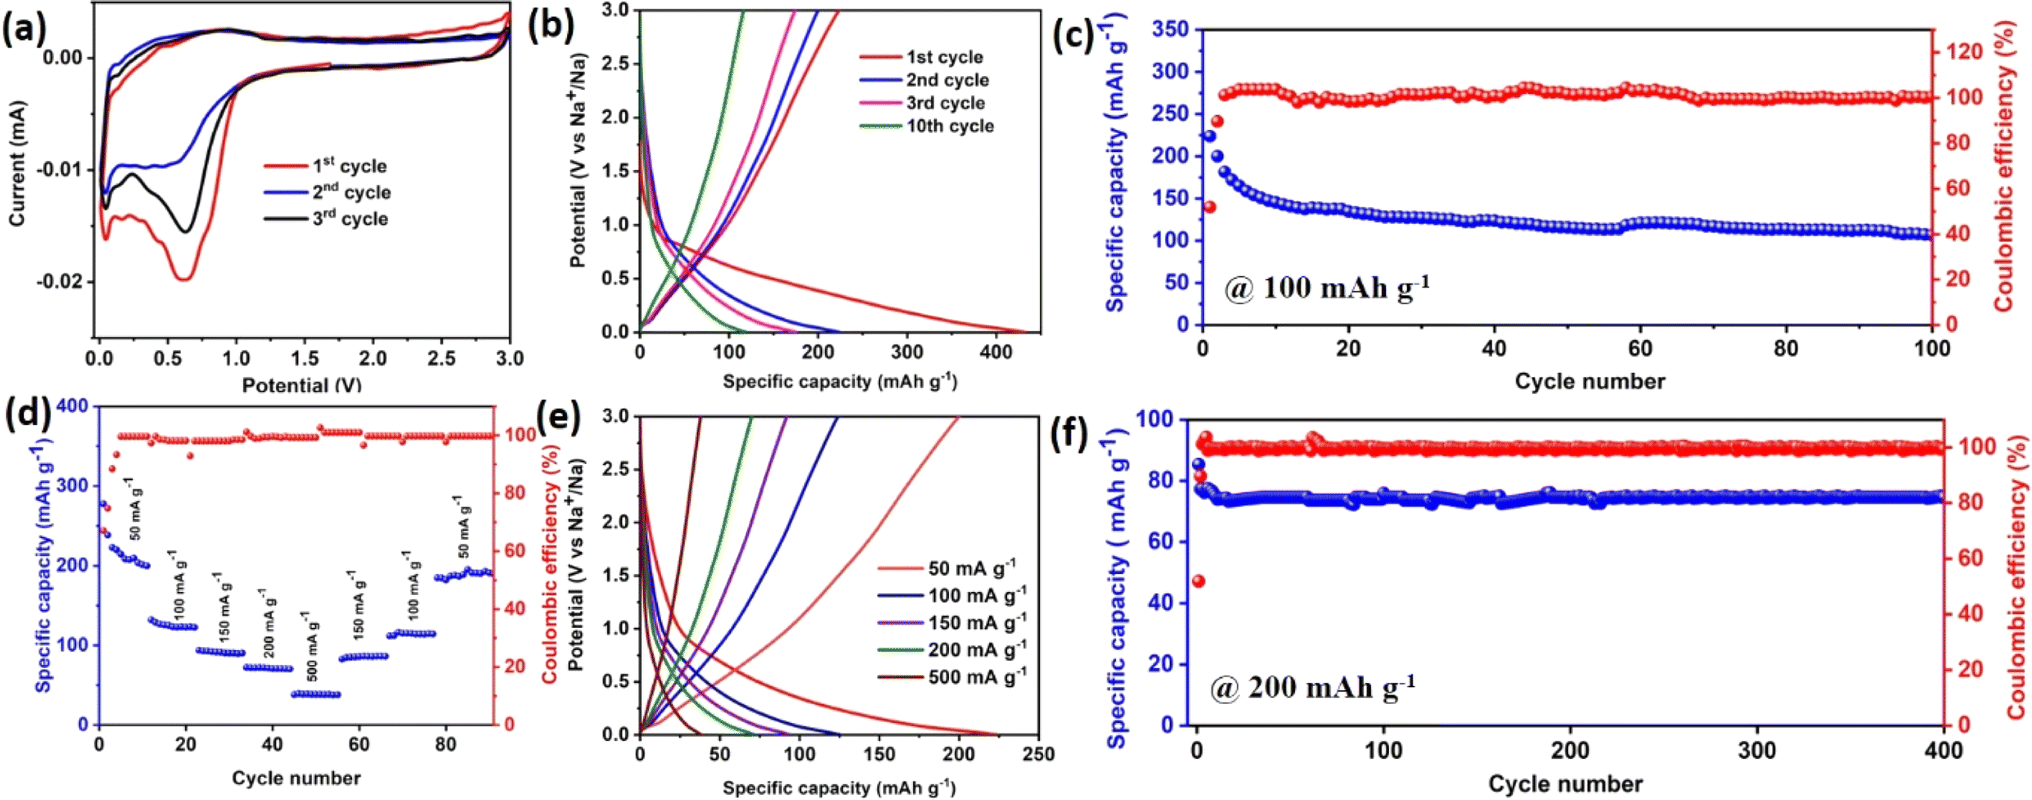 | ||
| Fig. 3 (a) Cyclic voltammogram (CV) at a sweep rate of 0.2 mV s−1. (b) Galvanostatic charge–discharge profiles of different cycles at a current density of 100 mA g−1. (c) Long cycling and coulombic efficiency at a current density of 100 mA g−1. (d) Rate performance and coulombic efficiency of WO3. (e) The corresponding charge–discharge profiles at different current densities are shown. (f) Long-term cycling at a current density of 200 mA h g−1 for up to 400 cycles. | ||
The charge and discharge profile for a few specific cycles at 100 mA g−1 is shown in Fig. 3(b). The first discharge and charge capacities were 431.3 mA h g−1 and 222.31 mA h g−1, respectively. A huge capacity deprivation with an initial coulombic efficiency of 51.8% was observed, due to the formation of a solid electrolyte interphase (SEI) on the surface of the electrode by the decomposition of the electrolyte.29 The theoretical capacities of carbon materials were less than 250 mA h g−1.30 The as-synthesized WO3 showed a better experimental capacity as compared to carbon materials. After the 10th cycle, the capacity fading was stable up to the 100th cycle. The coulombic efficiency was also enhanced with cycling and stabilized, showing ∼100%.
Besides the satisfactory specific capacity and superior cycling stability, the WO3 electrode also showed satisfactory rate capability. As displayed in Fig. 3(c and d), on increasing current densities from 50 to 100, 150, 200, and 500 mA g−1, reversible capacities of 222.5, 124.0, 92.8, 70.0 and 40 mA h g−1 were achieved, respectively. Interestingly, even after prolonged cycling at increasing current densities, a specific capacity of up to 220 mA h g−1 was recovered at a current density of 50 mA g−1, indicating outstanding sodium storage reversibility. A long cycling test was performed at a current density of 200 mA h g−1 for up to 400 cycles as shown in Fig. 3(e). The test showed a negligible capacity loss. The capacity observed after 400 cycles was ∼75 mA h g−1 with a coulombic efficiency of 100%.
The kinetic properties were evaluated by obtaining EIS of the sample before and after cycling up to 100 cycles at 100 mA g−1, The Nyquist plots are shown in Fig. S3(a)† and were fitted by a Randles circuit (Fig. S4(a) and (b)†), and the resultant fitting parameters are provided in Table 1. The estimated charge transfer resistance Rct values for the WO3 electrode before and after 100 cycles were 109 Ω and 182 Ω, respectively. Using the following equation, we determined the diffusion coefficient of sodium ions:
 | (2) |
| R1 (Ω) | R2 (Ω) | R3 (Ω) | Slope (σ) | D (cm2 s−1) | |
|---|---|---|---|---|---|
| Before cycling | 6.15 | 109.55 | — | 4.78 | 5.01 × 10⁻¹² |
| After cycling | 32 | 182 | 91 | 8.14 | 1.72 × 10⁻¹² |
The Warburg factor is denoted by σ and the formula is σ = Z′/ω−1/2. It can be understood in terms of the impedance of the diffusion barrier layer and the semi-infinite diffusion impedance in the lower frequency slope that comes after the semicircle. The value of σ was found to be inversely proportional to the Na+ diffusion coefficient.31 The slope values (from Fig. S1(b)†) before and after 100 cycles were 4.78 and 8.14, respectively. The formula above could be used to determine the diffusion coefficients of Na ions, which were 5.01 × 10⁻¹² and 1.72 × 10⁻¹², respectively.
The reaction kinetics of WO3 was investigated via scanning cyclic voltammetry at different sweep rates ranging from 0.2–0.8 mV s−1, shown in Fig. 4(a). As the scan rate increased, these CVs showed the same contours and uninterrupted peak shifts. Therefore, the peak locations were similar to the CV results shown in Fig. 4(a) after the first cycle, indicating low polarization and strong electrochemical behavior. Eqn (3) and (4) were used to evaluate the charge storage contribution (diffusion-controlled contribution and capacitive contribution):32
| i = avb | (3) |
|
logi = blogv + loga
| (4) |
 | ||
| Fig. 4 (a) CV plots at various scan rates ranging from 0.2 to 0.8 mV s−1. (b) Log(peak current, i) vs. log(scan rate, v), (c) the pseudocapacitive contribution (orange) at 0.6 mV s−1. (d) Storage contribution for various scan rates. | ||
By the log(v) vs. log(i) plot, the value of b can be calculated, which shows the capacitive and ion-diffusion contribution. In a capacitive-controlled process, b = 1.0, whereas in the ion diffusion process governing the electrochemical reaction, b = 0.5. When b falls within the range of 0.5 to 1.0, both capacitive and intercalation processes contribute to the storage of charge. For the as-synthesized WO3, the calculated b values were 0.99, 0.99, 0.98, and 0.98, for peaks 1, 2, 3, and 4, respectively as shown in Fig. 4(b). The charge storage contribution of WO3 can be further estimated by the following eqn (5):
| i = k1v + k2v1/2 | (5) |
To investigate the phase change and structural changes that occur in the material upon charge–discharge cycling, the cycled cell was opened and the anode material was recovered. The cell was cycled up to 100 cycles at a current density of 100 mA g−1 before the sample was recovered. This post-electrochemical sample was analyzed using XRD and SEM. The XRD spectrum of the cycled anode material is shown in Fig. 5(a). The presence of tungsten trioxide and the absence of elemental tungsten in the XRD spectra indicates reversibility and the peaks for sodium oxide may have originated from the conversion reaction after the first cycle.
 | ||
| Fig. 5 (a) XRD spectra of the electrode after cycling. (b) HRSEM image of the electrode material after cycling. (c) The corresponding elemental mapping images of W (tungsten), (d) P (phosphorus), (e) C (carbon), (f) O (oxygen), (g) N (nitrogen). | ||
The SEM image and elemental mapping of the cycled sample are shown in Fig. 5(b–g). The SEM image did not reveal the nanosheets, which were likely obscured by PVDF, activated carbon, and dissociated electrolyte products on the surface. Despite this, the resilient spherical shape persisted, underscoring impressive structural stability. For further clarification of the microstructural changes in the post-cycling electrode material, two SEM images are provided in Fig. S5(a and b).† Elemental mapping indicates the presence of carbon, oxygen, phosphorus, and nitrogen, hinting at the accumulation of electrolyte, PVDF, and conductive carbon on the surface. The detailed observation of the transformation of the morphology and structure of the cycled anode proves that the sample's reversibility and structural stability are extremely good, enabling it to withstand continuous sodiation and desodiation.
3. Conclusion
We have successfully synthesized WO3 microspheres having a complex framework, made up of a nanosheet network. The as-synthesized anode material exhibited excellent electrochemical properties for Na-ion insertion. In response to ramping up current densities from 50 to 100, 150, 200, and 500 mA g−1, reversible capacities of 222.5, 124.0, 92.8, 70.0 and 40 mA h g−1 were achieved, respectively. Significantly, after the uninterrupted cycling with increasing current densities, a specific capacity as high as 220 mA h g−1 was regained at a current density of 50 mA g−1, claiming exquisite sodium storage reversibility. The reaction kinetics of WO3 was also investigated, and the capacitive process of WO3 contributed 74% to the entire capacity at the sweep rate of 0.6 mV s−1. Such a high value implies that the self-assembled WO3 microspheres offer ample sites for surface storage by the capacitive mechanism, which is reflected in rate capability, and enough space to buffer the volume change, which is correlated with the cycling stability.Conflicts of interest
The authors declare no potential conflicts of interest with respect to the research, authorship, and/or publication of this article.References
- Z. Jiang, W. Zhou, C. Hu, X. Luo, W. Zeng, X. Gong, Y. Yang, T. Yu, W. Lei and C. Yuan, Adv. Mater., 2023, 35, 2300505 CrossRef CAS PubMed.
- M. Su, W. Zhou, L. Liu, M. Chen, Z. Jiang, X. Luo, Y. Yang, T. Yu, W. Lei and C. Yuan, Adv. Funct. Mater., 2022, 32, 2111067 CrossRef CAS.
- S. Ratha, S. Sahoo, P. Mane, B. Polai, B. Sathpathy, B. Chakraborty and S. K. Nayak, Sci. Rep., 2023, 13, 1–14 CrossRef PubMed.
- K. M. A. Raihan, S. Sahoo, T. Nagaraja, S. Sigdel, B. LaCroix, C. M. Sorensen and S. R. Das, APL Energy, 2024, 2, 16104 CrossRef.
- H. Xu, H. Li and X. Wang, ChemElectroChem, 2023, 10, e202201151 CrossRef CAS.
- T. Yu, G. Li, Y. Duan, Y. Wu, T. Zhang, X. Zhao, M. Luo and Y. Liu, J. Alloys Compd., 2023, 958, 170486 CrossRef CAS.
- W. Zhang, F. Zhang, F. Ming and H. N. Alshareef, EnergyChem, 2019, 1, 100012 CrossRef.
- M. Mamoor, Y. Li, L. Wang, Z. Jing, B. Wang, G. Qu, L. Kong, Y. Li, Z. Guo and L. Xu, Green Energy and Resources, 2023, 1, 100033 CrossRef.
- X. Luo, J. Huang, L. Cao, J. Li, Z. Xu, K. Kajiyoshi, Y. Zhao, H. Yang, Y. Liu and Z. Li, Chem. Eng. J., 2023, 464, 142579 CrossRef CAS.
- W. J. Li and Z. W. Fu, Appl. Surf. Sci., 2010, 256, 2447–2452 CrossRef CAS.
- S. Wei, M. Serra, S. Mourdikoudis, H. Zhou, B. Wu, L. Děkanovský, J. Šturala, J. Luxa, R. Tenne, A. Zak and Z. Sofer, ACS Appl. Mater. Interfaces, 2022, 14, 46386–46400 CrossRef CAS PubMed.
- S. Fang, D. Bresser, S. Passerini, S. Fang, D. Bresser and S. Passerini, Adv. Energy Mater., 2020, 10, 1902485 CrossRef CAS.
- L. Cong, H. Xie and J. Li, Adv. Energy Mater., 2017, 7, 1601906 CrossRef.
- H. Zhang, H. Huang, J. Xu, X. Deng, G. Li, X. Liang, W. Zhou, J. Guo and S. Tang, J. Alloys Compd., 2018, 766, 952–958 CrossRef CAS.
- H. Dai, M. Tang, J. Huang and Z. Wang, ACS Appl. Mater. Interfaces, 2021, 13, 10870–10877 CrossRef CAS PubMed.
- Y. He, M. Gu, H. Xiao, L. Luo, Y. Shao, F. Gao, Y. Du, S. X. Mao and C. Wang, Angew. Chem., Int. Ed., 2016, 55, 6244–6247 CrossRef CAS PubMed.
- A. I. Inamdar, H. S. Chavan, A. T. A. Ahmed, S. Cho, J. Kim, Y. Jo, S. M. Pawar, Y. Park, H. Kim and H. Im, Mater. Lett., 2018, 215, 233–237 CrossRef CAS.
- Z. Gu, H. Li, T. Zhai, W. Yang, Y. Xia, Y. Ma and J. Yao, J. Solid State Chem., 2007, 180, 98–105 CrossRef CAS.
- K. Huang, Q. Pan, F. Yang, S. Ni, X. Wei and D. He, J. Phys. D: Appl. Phys., 2008, 41, 155417 CrossRef.
- Z. Liu, P. Li, Y. Dong, Q. Wan, F. Zhai, A. A. Volinsky and X. Qu, Appl. Surf. Sci., 2017, 394, 70–77 CrossRef CAS.
- A. L. Santhosha, S. K. Das and A. J. Bhattacharyya, J. Nanosci. Nanotechnol., 2016, 16, 4131–4135 CrossRef CAS PubMed.
- F. Zeng, W. Cheng, Y. Pan, M. Yu, Y. Qu and C. Yuan, J. Mater. Chem. A, 2020, 8, 23919–23929 RSC.
- T. Herdt, D. Deckenbach, M. Bruns and J. J. Schneider, Nanoscale, 2019, 11, 598–610 RSC.
- M. C. Rao, J. Non-Oxide Glasses, 2013, 5, 1–8 RSC.
- P. A. Shinde, Y. Seo, C. Ray and S. C. Jun, Electrochim. Acta, 2019, 308, 231–242 CrossRef CAS.
- L. L. Xing, K. J. Huang and L. X. Fang, Dalton Trans., 2016, 45, 17439–17446 RSC.
- W. Song, R. Zhang, X. Bai, Q. Jia and H. Ji, J. Mater. Sci.: Mater. Electron., 2020, 31, 610–620 CrossRef CAS.
- S. P. Gupta, H. H. Nishad, S. D. Chakane, S. W. Gosavi, D. J. Late and P. S. Walke, Nanoscale Adv., 2020, 2, 4689–4701 RSC.
- Y. Yun, J. Shao, X. Shang, W. Wang, W. Huang, Q. Qu and H. Zheng, Nanoscale Adv., 2020, 2, 1878–1885 RSC.
- L. Wu, D. Buchholz, C. Vaalma, G. A. Giffin and S. Passerini, ChemElectroChem, 2016, 3, 292–298 CrossRef CAS.
- A. A. Arie, H. Kristianto, E. Demir and R. D. Cakan, Mater. Chem. Phys., 2018, 217, 254–261 CrossRef CAS.
- Y. Wang, D. Kong, S. Huang, Y. Shi, M. Ding, Y. Von Lim, T. Xu, F. Chen, X. Li and H. Y. Yang, J. Mater. Chem. A, 2018, 6, 10813–10824 RSC.
Footnotes |
| † Electronic supplementary information (ESI) available. See DOI: https://doi.org/10.1039/d4ra01800a |
| ‡ Current address: Nanomaterials for Energy Storage and Conversion, INL - International Iberian Nanotechnology Laboratory, Av. Mte. José Veiga s/n, 4715330, Braga, Portugal. |
| This journal is © The Royal Society of Chemistry 2024 |