DOI:
10.1039/D4RA00255E
(Paper)
RSC Adv., 2024,
14, 10410-10415
Improved antioxidative and antibacterial activity of epigallocatechin gallate derivative complexed by zinc cations and chitosan
Received
10th January 2024
, Accepted 16th March 2024
First published on 2nd April 2024
Abstract
Epigallocatechin gallate (EGCG) has attracted increasing attention thanks to its multi-bioactivities, and people are keen on improving the antioxidative and antibacterial performance of EGCG. Based on the favorable biofunctionality of Zn2+ and chitosan (CS), an EGCG derivative with a novel formula, i.e., EGCG–Zn–CS, is presented in this study. The structure of EGCG–Zn–CS was characterized by FT-IR, UV-vis, TGA, XPS, and SEM–EDS. The radical elimination results indicate that 0.1 mg mL−1 of EGCG–Zn–CS demonstrates DPPH radical and hydroxyl radical scavenging activities of 94.8% and 92.3%, while 0.1 mg mL−1 of EGCG exhibits only 78.5% and 75.6%, respectively, which means improved antioxidative activity of EGCG–Zn–CS was obtained. Inhibitory experiments against Staphylococcus aureus and Escherichia coli reveal that the minimal inhibitory concentrations (MICs) of EGCG–Zn–CS were 15.625 μg mL−1 and 187.5 μg mL−1, whereas the minimal bactericide concentrations (MBCs) were 46.875 μg mL−1 and 750 μg mL−1, respectively, which indicate that EGCG–Zn–CS exerts much higher antibacterial activity than EGCG. It can be concluded that the complexing of zinc cations and CS could amazingly improve both the antioxidative and antibacterial activity of EGCG, and it is expected that an exploration of EGCG–Zn–CS may inspire the development of simultaneous effective antioxidant and antibacterial agents.
Introduction
Polyphenols can be extracted from natural plants and have attracted extensive attention thanks to their distinct bioactivities. Polyphenols can not only induce overexpression of antioxidant enzymes in an organism, leading to enhanced antioxidant defense and preventing oxidative stress damage, but also show extensive antibacterial activity in inhibiting the growth of Escherichia coli, Pseudomonas aeruginosa, and Staphylococcus aureus.1–4 Epigallocatechin gallate (EGCG) exists widely in green tea leaves that exhibit multiple positive bioactivities, and an increasing number of people are fond of enjoying green tea as a hot drink. Nowadays, EGCG is considered to be a species that can realistically keep people healthy by clearing free radicals and regulating the activity of different types of oxidase in the body,5–7 and it was categorized as “generally recognized as safe” (GRAS) by the Food and Drug Administration (FDA).8–10 EGCG can also have an obvious antioxidant effect on organisms by increasing the activity of antioxidant enzymes, inhibiting lipid peroxidation, synergistically clearing free radicals with other nutrients, and reducing oxidation by chelating metal ions.11 Additionally, EGCG was reported to show promising antibacterial and antioxidative properties by inhibiting coronavirus severe acute respiratory syndrome due to its affinity to the spike virus protein.10,12,13 It has been disclosed that EGCG demonstrates a certain amount of antivirus activity on coronavirus SARS-CoV-2 and its subsequent variants, which caused the COVID-19 pandemic in recent years.13 Therefore, EGCG has been the subject of continuing study by chemists and biologists because of its further potential biological performance.
However, the utilization of EGCG is constrained by its limited bioactivity, necessitating significant endeavor to enhance its antioxidative and antibacterial capabilities. It has been reported that some metal ions can enhance the antioxidative activity of polyphenols, which inspires the exploration of polyphenol–metal complexes. Zhen et al. studied the bioactivity of an Mn(II)–EGCG complex, which disclosed that the Mn–EGCG complex expressed a high inhibition rate on α-glucosidase.14 But it is noteworthy that manganese is not regarded as a preferred metal ion for enhancing the properties of EGCG, because Mn(II) shows some serious toxicity to organisms, and the excessive accumulation of Mn2+ may lead to severe damage to human health. It has been shown that the activities of numerous enzymes targeted by polyphenols are dependent on zinc, and polyphenols can transport zinc cations through the plasma membrane as zinc ionophores.15 It is well known that zinc is an essential trace element in the human body, and it is supposed to be the optimal element because of its suitable complexing ability and good biocompatibility.10,16 Previous studies have verified that zinc is also an important component of superoxide dismutase (SOD), and a polyphenol–Zn complex shows inhibition of oxidative damage closely related to that in vivo.17,18 It has also been shown that complexes of polyphenols with zinc ions are beneficial to improving the polyphenol's chemical and physical properties as well as its bioactivity, such as solubility, cellular uptake, and bioavailability, which may enhance its antioxidative and antibacterial effects.19 People have made great efforts to investigate a complex of EGCG with zinc cations to improve the bioactivity of EGCG.20,21 Zhang et al. also synthesized a complex of tea polyphenol with zinc cations and encapsulated it with nanoparticles which could be used as antioxidant delivery systems for food and other applications.22 However, reported explorations of EGCG–Zn complexes mostly focus on the optimization of antioxidative activity, and there is limited information on improving antibacterial activity.
In the present study, we explored a kind of novel EGCG complex with simultaneous improved antioxidative and antibacterial activity by the participation of zinc cations and chitosan (CS). CS is a kind of natural polysaccharide with a lot of distinctive characteristics, and its unique network structure is beneficial for designing nano-systems for embedding and delivering bioactive substances.23,24 It is reported that nanoparticles based on CS modified with EGCG could show a lower minimal inhibitory concentration (MIC) than the original materials, which means the importation of CS may contribute to improving the bioactivity of EGCG.8 Herein, we explore a new formula for EGCG complexes by the reaction of EGCG with zinc acetate and CS, and the structures of the complexes were characterized by FT-IR, UV-vis, TGA, XPS, and SEM–EDS. The antioxidative activity of the complexes was determined by the radical scavenging rate for 2,2-diphenyl-1-picrylhydrazyl (DPPH) and hydroxyl radicals, and the antibacterial activity was evaluated by inhibition against E. coli and S. aureus. The results demonstrate that the EGCG complex exhibits much higher scavenging activity for DPPH and hydroxyl radicals than EGCG, whereas it has lower MIC and MBC, indicating improved antibacterial activity.
Materials and methods
Materials
(−)-Epigallocatechin gallate (purity ≥95%), NaHCO3 (AR), NaOH (AR), and ZnCl2 (AR) were supplied by Macklin. Chitosan (50 kDa, 80–90% degree of deacetylation) was purchased from Rhawn. 2,2-diphenyl-1-picrylhydrazyl (DPPH) was purchased from Tokyo Chemical Industry. Methanol, ethanol, zinc acetate, and NaBH4 were of analytical grade and obtained from Aladdin. A dialysis bag (MWCO 8000–14000 Da) was purchased from Shanghai Yuanye Biotechnology Co., Ltd. All the reagents were applied without further treatment. E. coli (ATCC 25922) and S. aureus (ATCC 43300) were used for the antibacterial assays.
Preparation of polyphenol complexes
Preparation of EGCG–Zn complex. The EGCG–Zn complex was prepared according to ref. 22 with some optimization. The preparation was processed at room temperature and under the protection of nitrogen gas. In brief, 0.458 g of EGCG (1 mmol) was dissolved in 10 mL of deionized water with a stirrer, and 10 mL of ZnCl2 (0.136 g, 1 mmol) solution was slowly poured into the EGCG solution. The pH of the mixed solution was adjusted to 7 by adding 0.1 mol L−1 of NaHCO3, and the precipitate was gradually generated. The mixture was centrifuged after stirring for 30 min, and the precipitate was then separated. 0.3572 g of EGCG–Zn complex was obtained after the precipitate was freeze-dried.
Preparation of EGCG–Zn–CS complex. 0.25 g of CS was slowly added into 50 mL of zinc acetate (0.183 g, 1 mmol) solution and the mixture was stirred at room temperature for 30 min until the CS was completely dissolved. 2 mL of NaBH4 (0.0076 g, 0.2 mmol) solution was added dropwise into the solution, and 0.458 g of EGCG (1 mmol) was slowly dropped in. EGCG was dissolved in the solution after a stirring for 1 h, and the mixture was irradiated by microwaves (300 W) for 1 min. The mixture was transferred into the dialysis bag and dialyzed with distilled water for 48 h (with eight changes of distilled water). Finally, the solution was freeze-dried in a vacuum freeze dryer to obtain 0.2901 g of EGCG–Zn–CS complex.
Characterization of complex structures
FT-IR was recorded on a Thermo Nicolet 6700 Spectrometer in the range of 4000–500 cm−1 at a resolution of 2 cm−1. All the samples were dried in a vacuum and then pressed with potassium bromide powder for FT-IR analysis. The UV-vis (LAMBDA 850+) spectrum was obtained by using water as the solvent to dilute the sample to a concentration of 0.5 mg mL−1 and scanning at a wavelength ranging from 190 nm to 400 nm. We performed TG with a simultaneous thermal analyzer (STA 2500) with a temperature range of 25 °C to 800 °C at a heating rate of 20 °C min−1 in a nitrogen atmosphere. XPS analysis was determined on a Thermo Scientific K-Alpha. Observation of the microstructure was carried out on a field emission scanning electron microscope (FE-SEM, Nova NanoSEM450), and the distribution of elements was identified using energy dispersive spectroscopy (EDS).
Antioxidative activity evaluation
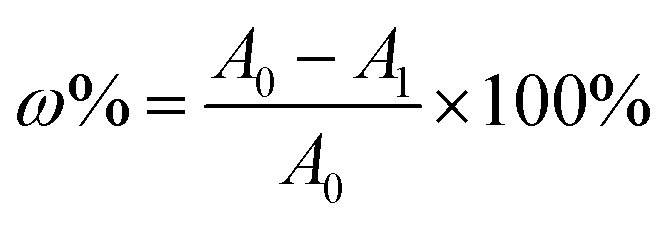
DPPH radical scavenging assay. Inhibition of DPPH free radicals was determined according to the reported method.25 2.0 mL of DPPH solution (0.10 mmol L−1) in anhydrous ethanol and 2.0 mL of sample solutions were separately added to test tubes and allowed to stand in the dark for 30 min. The absorbance of the sample was measured at a wavelength of 517 nm after incubation in the dark for 1 h. We calculated the percentage of DPPH free radical inhibition (ω%) using the following formula:
where A0 and A1 are the absorbance of the control (anhydrous ethanol) and the sample, respectively.
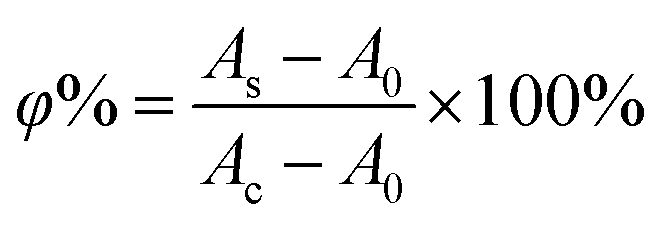
Hydroxyl radical scavenging assay. We measured hydroxyl radical scavenging activity as in the literature.26 1 mL of phenanthroline solution (1.5 mmol L−1) was blended with 2 mL of phosphate buffered saline (PBS, 20 mmol L−1, pH 7.4) and then 3 mL of sample solution was mixed in. Subsequently, 1 mL of FeSO4 solution (0.5 mmol L−1) and 1 mL of H2O2 solution (25 mmol L−1) were added and incubated at 37 °C for 50 min. Finally, the absorbance of the mixture was measured at 536 nm after 50 min of incubation at 37 °C. The hydroxyl radical scavenging activity (φ%) was calculated with the following formula:
where As, Ac, and A0 are the absorbance of the sample, the control (without the H2O2 solution), and the blank, respectively.
Determination of antibacterial activity
The antibacterial activity was evaluated by the measurement of MIC and MBC against E. coli (ATCC 25922) and S. aureus (ATCC 43300), referring to the methods in the literature.8,27 In brief, bacteria were cultured to mid-logarithmic phase (OD = 0.4–0.6), and diluted to 105 CFU mL−1. Then, 10 μL of sample solutions with different concentration gradients and 90 μL of bacterial suspension were added to a 96-well plate, and the mixture was incubated at 37 °C for 18 h. All assays were performed in triplicate, and the MIC was defined as the lowest sample concentration at which there was no visible growth of bacteria. Then, the MBC was determined after the MIC was achieved. Among the wells with a concentration above the MIC, 10 μL of the mixed solution were sucked out and spread onto a solid medium, and the solid medium was then cultured at 37 °C for 18 h. All assays were performed in triplicate, and the MBC was defined as the lowest sample concentration with no visible growth, i.e., the concentration of initial inoculum with 100% inhibition.
Results and discussion
Preparation of EGCG–Zn and EGCG–Zn–CS
In the preparation of EGCG–Zn and EGCG–Zn–CS, three strategies were adopted to avoid oxidation of the phenolic hydroxyl groups. Firstly, 0.1 mol L−1 NaHCO3 instead of the NaOH solution in the literature was used to adjust the pH, which could help control the pH more accurately and avoid the oxidation of EGCG and the precipitation of Zn(OH)2 in alkaline conditions. Secondly, we used NaBH4 as a reducing agent to provide a reducing environment during the preparation of EGCG–Zn–CS. Thirdly, microwave irradiation rather than the traditional heating method was explored for the preparation of EGCG–Zn–CS, which could fulfill the reaction effectively at a lower temperature to prevent the possible oxidation of EGCG. It should be mentioned that the subsequent determinations of activity disclosed that the complexes prepared by microwave irradiation demonstrated higher antioxidative and antibacterial activities than those prepared by a traditional heating method.
FT-IR analysis
The FT-IR spectra of the prepared complexes were recorded and are shown in Fig. 1. EGCG demonstrated a wide range of O–H stretching peaks between 3481 cm−1 and 3355 cm−1, and these peaks were weakened in the EGCG–Zn complexes, suggesting the conjugation of the phenolic hydroxyl groups with zinc cations. The changes in the peaks in EGCG at 1695 cm−1 (C![[double bond, length as m-dash]](https://www.rsc.org/images/entities/char_e001.gif) O stretching) and 1607 cm−1 (phenylic ring stretching) were merged at 1618 cm−1, in accordance with the shift of the O–H stretching position. It can also be seen that EGCG–Zn retains the basic skeleton of EGCG, and the coordination of zinc ions with hydroxyl groups weakened the absorption peak intensity of the complex. As for EGCG–Zn–CS, the broad absorption peaks in the range of 3100–3700 cm−1 are similar to those of CS and EGCG, which could be attributed to the stretching vibration of O–H or N–H bonds and intermolecular hydrogen bonds.23,28 In addition, we observed that EGCG–Zn–CS exhibits an absorption peak at 1627 cm−1 (CO stretching) which derived from the material of EGCG and CS. Furthermore, the peak at 777 cm−1 in EGCG–Zn–CS is ascribed to the vibration peak of the Zn–O bond. It can be concluded that FT-IR analysis suggests the complexing of EGCG with Zn cations and CS.
O stretching) and 1607 cm−1 (phenylic ring stretching) were merged at 1618 cm−1, in accordance with the shift of the O–H stretching position. It can also be seen that EGCG–Zn retains the basic skeleton of EGCG, and the coordination of zinc ions with hydroxyl groups weakened the absorption peak intensity of the complex. As for EGCG–Zn–CS, the broad absorption peaks in the range of 3100–3700 cm−1 are similar to those of CS and EGCG, which could be attributed to the stretching vibration of O–H or N–H bonds and intermolecular hydrogen bonds.23,28 In addition, we observed that EGCG–Zn–CS exhibits an absorption peak at 1627 cm−1 (CO stretching) which derived from the material of EGCG and CS. Furthermore, the peak at 777 cm−1 in EGCG–Zn–CS is ascribed to the vibration peak of the Zn–O bond. It can be concluded that FT-IR analysis suggests the complexing of EGCG with Zn cations and CS.
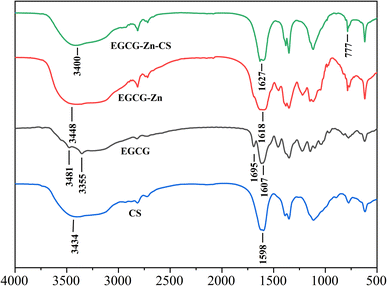 |
| | Fig. 1 FT-IR spectra of the samples. | |
UV-vis analysis
Fig. 2 shows the UV-vis absorbant curves of the related compounds. From Fig. 2(a), we can see that the peak of EGCG at 285 nm has been widened and weakened, and red-shifted to 300 nm in EGCG–Zn after complexing with zinc cations, while the peak at 220 nm in EGCG was blue-shifted to 208 nm in EGCG–Zn, which might be attributed to the electron transition of p → π conjugation. Fig. 2(b) indicates that the peak of EGCG at 285 nm becomes very weak, with a slight red-shift to 290 nm after complexing with zinc cations and CS, which means the involvement of CS should weaken the UV absorbance of EGCG–Zn–CS.
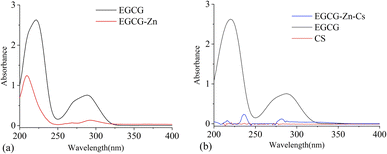 |
| | Fig. 2 UV-vis spectra of EGCG–Zn (a) and EGCG–Zn–CS (b). | |
Thermogravimetric analysis
The thermal properties of EGCG, EGCG–Zn, and EGCG–Zn–CS were characterized by thermogravimetric analysis (Fig. 3). It can be seen that EGCG–Zn–CS demonstrates a relatively stable state at a normal application temperature, and the thermal decomposition of EGCG–Zn–CS can be divided into three steps. At an initial stage below 130 °C, EGCG–Zn–CS exhibited a mass loss of 13.56%, which was related to the volatilization of physically and chemically bound water within the complex. Within the temperature range of 130 °C to 220 °C, the second mass loss was related to high-temperature oxidation and pyrolysis of EGCG–Zn–CS. In the third stage of 220 °C to 800 °C, significant mass loss was observed, which was caused by the gradual carbonization and pyrolysis of EGCG–Zn–CS. The result also reveals that EGCG–Zn and EGCG–Zn–CS would become more stable than EGCG by the presence of zinc cations.
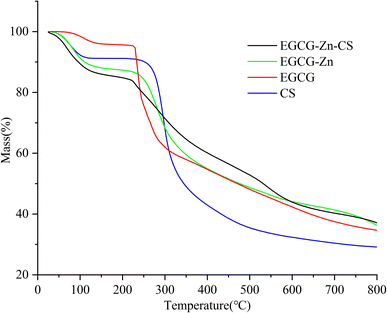 |
| | Fig. 3 Thermogravimetric analysis of the samples. | |
XPS analysis
The results of XPS analysis are shown in Fig. 4. The peak for zinc was present in both EGCG–Zn and EGCG–Zn–CS, and there was a sharp peak of N in EGCG–Zn–CS, which verified the simultaneous coordination of Zn2+ and CS with EGCG. XPS analysis also demonstrates 6.12% and 1.44% of Zn in EGCG–Zn and EGCG–Zn–CS, respectively.
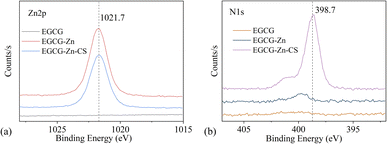 |
| | Fig. 4 XPS spectrum of EGCG, EGCG–Zn and EGCG–Zn–CS, high-resolution XPS spectra of Zn 2p (a) and N 1s (b). | |
SEM and EDS analysis
The SEM images of CS and complex sample particles are presented in Fig. 5. The results demonstrate that EGCG–Zn exhibits circular clusters, while EGCG–Zn–CS shows a surface of smooth and dense morphology versus the rough surface of CS. In addition, we can see that there were some blocky substances stacked on the surface of EGCG–Zn–CS, which might result from the long chain of the grafted CS. EDS was applied for a qualitative and rough quantitative analysis of the distribution of micro-elements, and the results are drawn in Fig. 6. EDS analysis revealed that 6.56% of Zn was trapped in EGCG–Zn complexes, while 1.42% and 4.85% of Zn and N were present in EGCG–Zn–CS, which is basically in accordance with the XPS analysis.
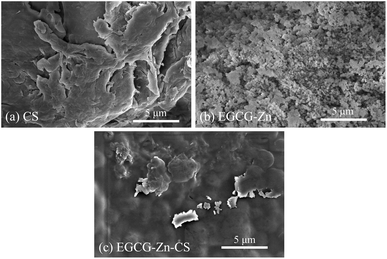 |
| | Fig. 5 SEM micrographs of CS, EGCG–Zn and EGCG–Zn–CS, (a) CS (b) EGCG–Zn (c) EGCG–Zn–CS. | |
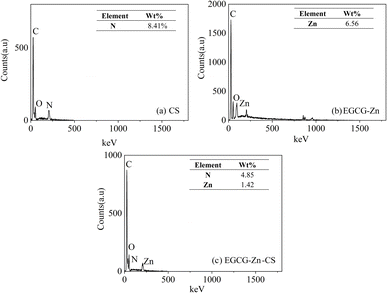 |
| | Fig. 6 EDS analysis of CS, EGCG–Zn and EGCG–Zn–CS, (a) CS (b) EGCG–Zn (c) EGCG–Zn–CS. | |
Antioxidative activity tests
DPPH radical scavenging assay. The DPPH radical scavenging activities of EGCG, EGCG–Zn, and EGCG–Zn–CS are illustrated in Fig. 7. It can be seen that the original EGCG shows a certain extent of DPPH radical scavenging activity, but it could be greatly improved by complexation with zinc cations and CS. With a concentration ranging from 0.02 mg mL−1 to 0.1 mg mL−1, the DPPH scavenging rates of EGCG, EGCG–Zn, and EGCG–Zn–CS are all gradually improved. At a concentration of 0.1 mg mL−1, EGCG could eliminate DPPH radicals at a scavenging rate of 78.5%, while 91.5% and 94.8% could be obtained for EGCG–Zn and EGCG–Zn–CS, respectively, indicating a distinct improvement in the antioxidative activity. The enhancement in antibacterial and antioxidant properties of EGCG–Zn–CS could be attributed to two aspects of the coordination of zinc cations and CS: one is the coordination of Zn2+ with phenolic hydroxyl groups resulting in activation of the latter; the other is the intermolecular hydrogen bond between the phenolic O–H or CO in EGCG and N–H in CS which makes EGCG–Zn–CS more sensitive to DPPH radicals. There might be another factor to be considered in that the long chain of the six-membered oxoheterocylic ring in CS can contribute to the increase in bioactivity referred to in the literature29,30 as well as the physicochemical properties of phenols, which are consistent with the results of SEM and thermogravimetric analysis in this work. A comparison of the scavenging percentages by EGCG–Zn and EGCG–Zn–CS also reveals that the coordination of zinc cations exerts a vital effect on the consequence and the participation of CS synergistically benefiting a further increase in the scavenging rate, leading to a bigger enhancement of EGCG–Zn than that of EGCG–Zn–CS based on EGCG.
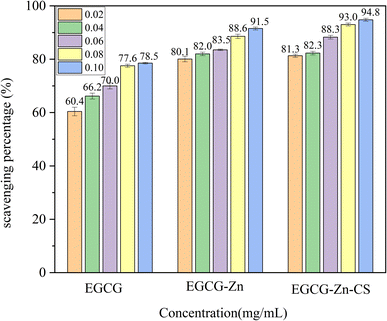 |
| | Fig. 7 DPPH radical scavenging activity of various substances (p < 0.05). | |
Hydroxyl radical scavenging assay. The hydroxyl radical scavenging activities of EGCG and its complexes were determined (Fig. 8). It can be seen that similar scavenging behavior occurred in the hydroxyl radical scavenging assay as in the DPPH radical scavenging assay. The results show that, at a concentration of 0.1 mg mL−1, EGCG could express a hydroxyl radical scavenging rate of 75.6%, while EGCG–Zn and EGCG–Zn–CS showed 90.6% and 92.3%, respectively, which indicates that EGCG complexes show more effective hydroxyl radical scavenging activity than EGCG on hydroxyl radical scavenging. It can also be observed that the scavenging percentage for hydroxyl radicals is a bit lower than that of DPPH radicals, which indicates that the former are less sensitive than the latter, as reported in the literature.31 It can be inferred that the simultaneous participation of Zn2+ and CS can improve the radical scavenging rate, and the formation of EGCG–Zn–CS shows a promising future in antioxidation applications.
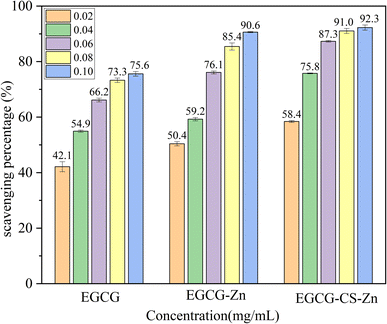 |
| | Fig. 8 Hydroxyl radical scavenging activity of various materials (p < 0.05). | |
Antibacterial activity
The MIC and MBC of EGCG and its complexes were determined against E. coli (ATCC 25922) and S. aureus (ATCC 43300) (Table 1). The results disclosed that EGCG–Zn–CS demonstrates lower MIC and MBC than the original EGCG, indicating higher antibacterial activity in the presence of Zn2+ and CS. Specifically, the MICs of EGCG–Zn–CS against S. aureus and E. coli were 15.625 μg mL−1 and 187.5 μg mL−1, while the corresponding MICs of EGCG were 93.75 μg mL−1 and more than 3000 μg mL−1, respectively. Meanwhile, the MBCs of EGCG–Zn–CS against the two strains were 46.875 μg mL−1 and 750 μg mL−1, whereas the MBCs of EGCG were 250 μg mL−1 and more than 3000 μg mL−1, respectively. Furthermore, it can also be seen that EGCG–Zn shows higher MIC and MBC than EGCG–Zn–CS but lower than those of EGCG, which means the coordination of zinc with EGCG can also result in an obvious improvement in antibacterial activity. The results of lower MIC and MBC against S. aureus than E. coli also disclosed that S. aureus strains show lower survivability than E. coli strains.
Table 1 MIC and MBC of phenol complexes against the tested bacteriaa
| |
Strains |
Concentration (μg mL−1) |
| EGCG |
EGCG–Zn |
EGCG–Zn–CS |
| MIC: minimal inhibitory concentration, MBC: minimal bactericide concentration. |
| MIC |
S. aureus |
93.75 |
46.875 |
15.625 |
| ATCC 43300 |
| E. coli |
>3000 |
375 |
187.5 |
| ATCC 25922 |
| MBC |
S. aureus |
250 |
125 |
46.875 |
| ATCC 43300 |
| E. coli |
>3000 |
1500 |
750 |
| ATCC 25922 |
Conclusions
EGCG–Zn–CS was prepared by the coordination of EGCG with zinc acetate and CS by the application of NaBH4 as a reducing reagent and microwave irradiation. We explored FT-IR spectra, UV-vis analysis, XPS, and SEM–EDS analysis for the determination of the structure and physicochemical properties of EGCG–Zn–CS. The results of DPPH radical and hydroxyl radical scavenging activity revealed that EGCG–Zn–CS demonstrates a higher radical scavenging rate than EGCG. The results of the antibacterial activity against E. coli and S. aureus indicate that EGCG–Zn–CS shows much higher antibacterial activity than EGCG. It has also been shown that, with the participation of zinc cations, complex EGCG–Zn exerts higher antioxidative and antibacterial activity than EGCG, whereas much higher bioactivities could be achieved on EGCG–Zn–CS due to the simultaneous participation of Zn2+ and CS. This work may provide a promising application of EGCG in food and drug industries.
Conflicts of interest
There are no conflicts to declare.
Acknowledgements
This work was supported by the Open Research Fund from Zhejiang Collaborative Innovation Center for High Value Utilization of byproducts from Ethylene Project (Ningbo Polytechnic College) in 2021–2022 (No. NZXT202103). Special thanks to Ms Jialin Zhang for the suggestion on manuscript writing.
References
- Q. Hu and Y. Luo, Carbohydr. Polym., 2016, 151, 624–639 CrossRef CAS PubMed.
- S. Quideau, D. Deffieux and C. Douat-Casassus, et al, Angew. Chem., Int. Ed., 2011, 50, 586–621 CrossRef CAS PubMed.
- H. Gharras, Int. J. Food Sci. Technol., 2009, 44, 2512–2518 CrossRef.
- Y. Xie, J. Chen and A. Xiao, et al, Molecules, 2017, 22, 1913 CrossRef PubMed.
- Z. Yan, Y. Zhong and Y. Duan, et al, Anim. Nutr., 2020, 6, 115–123 CrossRef PubMed.
- A. Zuo, H. Dong and Y. Yu, et al, Chin. Med., 2018, 13, 1–12 CrossRef PubMed.
- M. Grzesik, K. Naparło and G. Bartosz, et al, Food Chem., 2018, 241, 480–492 CrossRef CAS PubMed.
- M. Moreno-Vásquez, M. Plascencia-Jatomea and S. Sánchez-Valdes, et al, Polymers, 2021, 13, 1375 CrossRef PubMed.
- P. Gadkari and M. Balaraman, Food Bioprod. Process., 2015, 93, 122–138 CrossRef CAS.
- S. Bansal, S. Choudhary and M. Sharma, et al, Food Res. Int., 2013, 53, 568–584 CrossRef CAS.
- M. Almajano, R. Carbó and J. Jiménez, et al, Food Chem., 2008, 108, 55–63 CrossRef CAS.
- V. Tsvetkov, A. Varizhuk and L. Kozlovskaya, et al, Biochimie, 2021, 191, 27–32 CrossRef CAS PubMed.
- S. Hong, S. Seo, S. Woo and Y. Kwon, et al, J. Agric. Food Chem., 2021, 69, 5948–5954 CrossRef CAS PubMed.
- Z. Li, M. Kang and S. Zhang, et al, J. Mol. Struct., 2023, 1283, 135314 CrossRef CAS.
- H. Dabbagh-Bazarbachi, G. Clergeaud and I. Quesada, et al, J. Agric. Food Chem., 2014, 62, 8085–8093 CrossRef CAS PubMed.
- J. Cummings and J. Kovacic, J. Vet. Emergency Crit. Care, 2009, 19, 215–240 CrossRef PubMed.
- C. Policar, J. Bouvet and H. Bertrand, et al, Curr. Opin. Chem. Biol., 2022, 67, 102109 CrossRef CAS PubMed.
- Y. Sheng, I. Abreu and D. Cabelli, et al, Chem. Rev., 2014, 114, 3854–3918 CrossRef CAS PubMed.
- M. Kalinowska, J. Sienkiewicz-Gromiuk and G. Świderski, et al, Materials, 2020, 13, 3745 CrossRef CAS PubMed.
- J. Kalinowska, A. Bruss and C. Follet-Houttemane, et al, Spectrochim. Acta, Part A, 2022, 122, 631–638 CrossRef PubMed.
- A. Higazy, M. Hashem and A. ElShafei, et al, Carbohydr. Polym., 2010, 79, 890–897 CrossRef CAS.
- H. Zhang and Y. Zhao, Food Hydrocolloids, 2015, 48, 260–273 CrossRef CAS.
- X. Sun, P. Jia and T. Zhe, et al, Food Hydrocolloids, 2019, 96, 402–411 CrossRef CAS.
- Z. Yu, X. Zhang and Y. Huang, Ind. Eng. Chem. Res., 2013, 52, 11956–11966 CrossRef CAS.
- T. Shimanura, Y. Yoshihiro and Y. Yamazaki, et al, Anal. Sci., 2014, 30, 717–721 CrossRef PubMed.
- P. Mukhopadhyay, D. Su and Y. Cheng, et al, PLoS One, 2013, 8, 54505 CrossRef PubMed.
- Z. Jiale, J. Jian and T. Xinyi, et al, AMB Express, 2021, 11, 1–14 CrossRef PubMed.
- Q. Ma, L. Du and Y. Yang, et al, Food Hydrocolloids, 2017, 63, 677–684 CrossRef CAS.
- S. Pu, J. Li and L. Sun, et al, Carbohydr. Polym., 2019, 211, 161–172 CrossRef CAS PubMed.
- W. Pasanphan and S. Chirachanchai, Carbohydr. Polym., 2008, 72, 169–177 CrossRef CAS.
- Y. Diao, X. Yu and C. Zhang, et al, J. Food Sci. Technol., 2020, 57, 2259–2268 CrossRef CAS PubMed.
|
| This journal is © The Royal Society of Chemistry 2024 |
Click here to see how this site uses Cookies. View our privacy policy here. 
 Open Access Article
 This Open Access Article is licensed under a Creative Commons Attribution-Non Commercial 3.0 Unported Licence
 *ac
*ac