 Open Access Article
Adsorption and biodegradation of the azo dye methyl orange using Ralstonia pickettii immobilized in polyvinyl alcohol (PVA)–alginate–hectorite beads (BHec-RP)
Asranudinab,
Adi Setyo Purnomo *a,
Holilahb,
Didik Prasetyoko
 a,
Noureddine El Messaoudi
 c,
Alya Awinatul Rohmaha,
Alvin Romadhoni Putra Hidayata and
Riki Subagyoa
aDepartment of Chemistry, Institut Teknologi Sepuluh Nopember (ITS), Surabaya, Indonesia. E-mail: adi_setyo@chem.its.ac.id
bResearch Center or Biomass and Bioproducts, National Research and Innovation Agency of Indonesia (BRIN), Cibinong, 16911, Indonesia
cLaboratory of Applied Chemistry and Environment, Faculty of Sciences, Ibn Zohr University, Agadir 80000, Morocco
First published on 7th June 2024
Abstract
Biological methods are widely used to treat dye waste, particularly methyl orange (MO) dye. The importance of MO degradation stems from its classification as a toxic dye. Within the scope of this research, successful bio-decolorization of MO was achieved through the use of Ralstonia pickettii bacteria immobilized in a PVA–alginate–hectorite matrix (BHec-RP). The optimum conditions for the degradation were observed at a composition of PVA (10%), hectorite (1%), static incubation, 40 °C, and pH 7. Subsequently, the adsorption kinetics of BHec-RP (dead cells) as well as the degradation kinetics of BHec-RP (live cells) and MO using free R. pickettii cells were evaluated. The decolorization of MO using BHec-RP (dead cells) is an adsorption process following pseudo-first-order kinetics (0.6918 mg g−1 beads) and occurs in a monolayer or physical process. Meanwhile, the adoption of BHec-RP (live cells) and free R. pickettii cells shows a degradation process under pseudo-first-order kinetics, with the highest rates at an initial MO concentration of 50 mg L−1 being 0.025 mg L−1 h−1 and 0.015 mg L−1 h−1, respectively. These results show that the immobilization system is superior compared to free R. pickettii cells. Furthermore, the degradation process shows the inclusion of several enzymes, such as azoreductase, NADH-DCIP reductase, and laccase, presumed to be included in the fragmentation of molecules. This results in five fragments based on LC-QTOF/MS analysis, with m/z values of 267.12; 189.09; 179.07; 169.09; and 165.05.
Introduction
The global production of synthetic dyes is estimated to reach 7 × 10⁵ tons per year for nine groups of dyes, namely acid, basic, mordant, sulfur, dispersion, reactive, direct, vat, and azo dyes.1 Among these dyes, azo dyes (R′–N![[double bond, length as m-dash]](https://www.rsc.org/images/entities/char_e001.gif) N–R′′) constitute the dominant group, representing approximately 70% of the total colorants.2,3 Synthetic dyes are used in various industrial sectors, including textiles, pharmaceuticals, printing, paper, food, leather, and laboratories, as indicators and stains for biological specimens.4–6 The extensive use of synthetic dyes is consistent with the ease of water contamination. This influences the increase in chemical oxygen demand (COD), biochemical oxygen demand (BOD), as well as dissolved and suspended solids. Under anaerobic conditions, microorganisms can metabolize dyes, producing toxic intermediate products.7 Methyl orange (MO) is an azo dye identified to produce intermediate products such as aromatic amines, including N,N-dimethyl benzyl-1,4-diamine, sulfonamide, and 1,4-diaminobenzene.8,9 These products are reported to be highly toxic due to their transformation into mutagenic, carcinogenic, and teratogenic species.8,10–12 Additionally, synthetic dyes have the potential to induce damage to the vital organs of humans and animals, including the kidneys, digestive system, brain, liver, skin, and central nervous system.1,13,14
N–R′′) constitute the dominant group, representing approximately 70% of the total colorants.2,3 Synthetic dyes are used in various industrial sectors, including textiles, pharmaceuticals, printing, paper, food, leather, and laboratories, as indicators and stains for biological specimens.4–6 The extensive use of synthetic dyes is consistent with the ease of water contamination. This influences the increase in chemical oxygen demand (COD), biochemical oxygen demand (BOD), as well as dissolved and suspended solids. Under anaerobic conditions, microorganisms can metabolize dyes, producing toxic intermediate products.7 Methyl orange (MO) is an azo dye identified to produce intermediate products such as aromatic amines, including N,N-dimethyl benzyl-1,4-diamine, sulfonamide, and 1,4-diaminobenzene.8,9 These products are reported to be highly toxic due to their transformation into mutagenic, carcinogenic, and teratogenic species.8,10–12 Additionally, synthetic dyes have the potential to induce damage to the vital organs of humans and animals, including the kidneys, digestive system, brain, liver, skin, and central nervous system.1,13,14
Various methods, such as flocculation, adsorption, coagulation, sedimentation, ultrafiltration, electrolysis, ion exchange, and plasma, have been used to eliminate dye from solutions.15–20 However, the complete decolorization of dye has not been achieved due to its intricate molecular composition and the presence of toxic byproducts.21,22 Many microorganisms, including bacteria,23 fungi,24 and yeast,25 have shown their ability to remove the color from azo dyes through bioabsorption,26 degradation,27 and mineralization.28 Among these microorganisms, bacteria have been proven to play a crucial role in the treatment of wastewater containing dyes.13,29–31 Extensive research has shown the ability to effectively remove dyes. However, the use of free cells in the biodegradation process is limited by reaction rates, operational instability, dye toxicity, and inefficiency in transferring substrates.32 To address these issues, immobilized cells have been developed as an appropriate method in the field of biodegradation. These cells tend to show high enzymatic activity and greater resistance to various environmental disturbances, such as changes in pH, high concentrations, and inhibitory ions.12,33 Additionally, immobilized cells are more advantageous regarding oxygen supply, mass transfer, and repeated use.12,34
A PVA–alginate mixture is the main supporting material for cell immobilization, widely applied.35–38 This is preferred because the mixture can form perfectly round beads, possess strong mechanical characteristics, and stabilize cells. However, the polymer results in a denser surface for the beads, limiting mass transfer within the system. Some studies found that adding a small amount of alginate to the PVA gel-making process improved the tissue structure and enhanced the mass transfer of the carrier.39,40 However, the polymer mixtures still show high density, influencing cell viability and pollutant degradation rates.41 This limitation can be addressed by adding adsorbents such as kaolin clay,32,36 bentonite,37 and diatomaceous earth40 into the PVA–alginate gel. Lin et al.41 reported that adsorbents enhanced the mechanical properties of the gel, providing pores and acting as an adhesive medium that enhanced microbial stability.1,40,41 A potential adsorbent is hectorite, which has a structure and composition similar to those of bentonite and kaolin. This adsorbent shows biocompatibility in the PVA–alginate mixture, is non-toxic, hydrophilic, and provides large pores.2,3,42 Therefore, hectorite can be used as the base material for bacterial cell immobilization to enhance the rate of pollutant degradation.
The bacteria immobilized on PVA–alginate–hectorite is Ralstonia pickettii. This is the first report of R. pickettii immobilization for MO degradation. The ability to degrade dyes and other toxic pollutants such as methylene blue,43 DDT (1,1,1-trichloro-2,2-bis(4-chlorophenyl)ethane)44–46 and crude oil47 has been stated. The degradation of MO as a model pollutant was evaluated under various parameters, such as PVA content, hectorite content, pH, and temperature. The immobilization carrier material enhances the adsorption and degradation rates. Additionally, the physical characterization of the beads, the enzymes, and the prediction of the MO degradation pathway were reported.
Experimental
Materials
The stock culture of R. pickettii NBRC 102503 was purchased from NITE Biological Resource Center (NBRC), Chiba, Japan, LiCl (Merck, Germany), Mg(OH)2 (Merck, Germany), ludox HS40 (Sigma-Aldrich, Germany), cetyltrimethylammonium bromide (CTABr), (Merck, Germany), MO (C.I. 13025), (Merck, Germany), CaCl2·2H2O (SAP, Indonesia), polyvinil alcohol (PVA; Mw. approx. 60![[thin space (1/6-em)]](https://www.rsc.org/images/entities/char_2009.gif) 000; Merck, Germany), alginate (HiMedia, India), Luria-Bertani broth (Merck, Germany), Nutrient agar (HiMedia, India), bovine serum albumin (Merck, Germany), 2,2-azino-bis(3-ethylbenzothiazoline-6-sulfonic acid) (ABTS), 2,6-dichlorophenolindophenol (DCIP) (Merck, Germany). Furthermore, mineral salts medium (g L−1): K2HPO4 (1,73), KH2PO4 (0.68), MgSO4·7H2O (0,1), NaCl (0,1), FeSO4·7H2O (0,03), NH4NO3 (1), CaCl2·2H2O (0.2), and C6H12O6 (1) were of analytical grade.
000; Merck, Germany), alginate (HiMedia, India), Luria-Bertani broth (Merck, Germany), Nutrient agar (HiMedia, India), bovine serum albumin (Merck, Germany), 2,2-azino-bis(3-ethylbenzothiazoline-6-sulfonic acid) (ABTS), 2,6-dichlorophenolindophenol (DCIP) (Merck, Germany). Furthermore, mineral salts medium (g L−1): K2HPO4 (1,73), KH2PO4 (0.68), MgSO4·7H2O (0,1), NaCl (0,1), FeSO4·7H2O (0,03), NH4NO3 (1), CaCl2·2H2O (0.2), and C6H12O6 (1) were of analytical grade.
Regeneration and production of R. pickettii for immobilization
Bacterium culture R. pickettii NBRC 102503 was maintained on nutrient agar and incubated at 37 °C for 24 hours. The colony was inoculated into 10 mL of LB broth in an Erlenmeyer flask, and the cultures were pre-incubated at 37 °C for 30 hours with a shaker of 120 rpm. In addition, the inoculum size was fixed to optical density 1.0 (λmax = 600 nm, 1.50 × 10⁶ cells per mL).Synthesis of hectorite
Hectorite-CTAB was synthesized using the method described by Asranudin.2,3 In this synthesis, 40% CTAB was added to the LiCl![[thin space (1/6-em)]](https://www.rsc.org/images/entities/char_2009.gif) :
:![[thin space (1/6-em)]](https://www.rsc.org/images/entities/char_2009.gif) Mg(OH)2
Mg(OH)2![[thin space (1/6-em)]](https://www.rsc.org/images/entities/char_2009.gif) :
:![[thin space (1/6-em)]](https://www.rsc.org/images/entities/char_2009.gif) SiO2 (1.33
SiO2 (1.33![[thin space (1/6-em)]](https://www.rsc.org/images/entities/char_2009.gif) :
:![[thin space (1/6-em)]](https://www.rsc.org/images/entities/char_2009.gif) 5.00
5.00![[thin space (1/6-em)]](https://www.rsc.org/images/entities/char_2009.gif) :
:![[thin space (1/6-em)]](https://www.rsc.org/images/entities/char_2009.gif) 7.60), and the resulting mixture was subjected to calcination at 550 °C in a nitrogen environment for 1 hour. This was followed by exposure to air for 4 hours, and the calcined hectorite was mixed with PVA hydrogel, sodium alginate (SA), and R. pickettii cells.
7.60), and the resulting mixture was subjected to calcination at 550 °C in a nitrogen environment for 1 hour. This was followed by exposure to air for 4 hours, and the calcined hectorite was mixed with PVA hydrogel, sodium alginate (SA), and R. pickettii cells.
Batch experiments and analysis methods
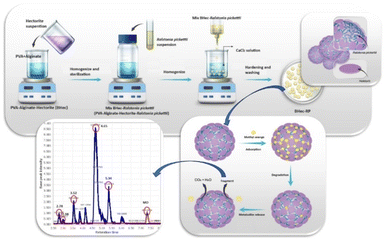
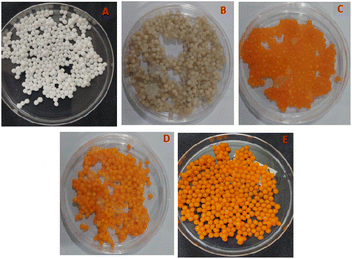
Factors influencing the biodegradation of MO in BHec-RP were investigated. Experiments were conducted using various concentrations of PVA, namely 2.5%, 5.0%, 7.5%, 10%, and 15% (w/v), as well as hectorite, including 0.5%, 1%, 2%, 3%, and 4% (w/v). This mixture contained 1% (w/v) alginate, and the R. pickettii pellets were regenerated to an optical density of 1.0 (λmax = 600 nm, 1.50 × 10⁶ cells per mL). The experiments were performed in triplicate and incubated in a stationary incubator under dark conditions. MO concentration was monitored for up to 48 hours, and the PVA–alginate–hectorite–RP hydrogel was dropped into a mixture of H3BO3 solution (3% b/v) and CaCl2 (4% b/v) using aseptic syringes. The mixture was stored for 12 hours to obtain hardened gel beads with a diameter of approximately 3–5 mm. The beads were washed three times with demineralized water to remove residual CaCl2 and stored in a 0.5% NaCl solution at 4 °C for long-term use. The obtained beads are denoted BHec-RP, and an illustration of the fabrication is shown in Fig. 1.Adsorption and degradation kinetics of methyl orange (MO)
The adsorption and degradation kinetics were determined using dead and live cells in BHec-RP. The reactions were carried out in 100 mL Erlenmeyer flasks containing 2.5 g of beads and 25 mL of MSM solution, with a final MO concentration ranging from 50 to 300 mg L−1. The decolorization was performed at 40 °C under static conditions. Furthermore, the degradation kinetics using free R. pickettii cells were also studied for comparison. The residual MO concentration was determined using UV-vis spectrophotometry at a wavelength of 465 nm based on eqn (1).
 | (1) |
Meanwhile, the adsorption capacity of BHec-RP (dead cell) was determined using eqn (2).
 | (2) |
Enzyme analysis and identification of metabolite products
Crude enzyme extract was obtained by centrifuging the decolorization media at 4000 rpm at 4 °C for 10 minutes. The obtained filtrate was tested for enzyme activity and adopted for total protein analysis using the Bradford method.48 The enzymes analyzed were NADH-DCIP reductase,49 azoreductase,50 and laccase.51The identification of metabolites after decolorization was determined using Q-TOF LC/MS (Bruker). A 50 mL aliquot of the cell culture medium was centrifuged at 4000 rpm for 15 minutes, and the collected supernatant was extracted with ethyl acetate. The extract was dried using a rotary vacuum evaporator and re-dissolved in ethanol for further analysis. The elution method used a gradient of 0.2 mL min−1 for the first three minutes and 0.4 mL min−1 for the subsequent seven minutes. The mobile phase used was methanol and water, with a ratio of 99![[thin space (1/6-em)]](https://www.rsc.org/images/entities/char_2009.gif) :
:![[thin space (1/6-em)]](https://www.rsc.org/images/entities/char_2009.gif) 1 (v/v) for the first 3 minutes and 61
1 (v/v) for the first 3 minutes and 61![[thin space (1/6-em)]](https://www.rsc.org/images/entities/char_2009.gif) :
:![[thin space (1/6-em)]](https://www.rsc.org/images/entities/char_2009.gif) 39 (v/v) for the following seven minutes. This analysis used an Acclaim TM RSLC 120 C18 column (2.1 × 100 mm) at a temperature of 33 °C. Various tools, including ChemDraw Ultra 12, MZmine3, and PathPred (https://www.genome.jp/tools/pathpred/), were used to determine the logic of metabolite fragments.
39 (v/v) for the following seven minutes. This analysis used an Acclaim TM RSLC 120 C18 column (2.1 × 100 mm) at a temperature of 33 °C. Various tools, including ChemDraw Ultra 12, MZmine3, and PathPred (https://www.genome.jp/tools/pathpred/), were used to determine the logic of metabolite fragments.
Characterization
Beads BHec-RP before and after application have been characterized using relevant instruments. Morphological analysis and elemental composition were determined using SEM-EDX (Hitachi, FlexSEM 1000). Before characterization, BHec-RP was freeze-dried at −50 °C for 8 hours. Thermal analysis of BHec-RP was performed using TGA/DTG (Hitachi High-Tech Sciences STA7200 Simultaneous Thermal). The sample was heated from 28 to 900 °C at a rate of 10 °C min−1 under a 60 mL min−1 nitrogen stream. In addition, the surface and pore area of BHec-RP were analyzed through the Quantachrome Touchwin v1.11 instrument. The sample was degassed at 300 °C for 3 hours under a vacuum, and N2 gas flowed at −196 °C. The specific surface area and the pore size distribution were calculated using BET (Brunauer–Emmet–Teller) and DFT (Density Functional Theory).Results and discussion
Characterization
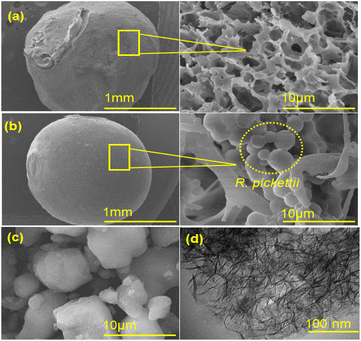 | ||
| Fig. 2 Micrographs: (a) SEM of BHec, (b) SEM of BHec-RP, (c) SEM of Hec-40, and (d) TEM of Hec-40 (after calcination). | ||
| Elements | % Weight | ||
|---|---|---|---|
| BHec | BHec-RP | Hec-40 | |
| C | 4.84 | 10.27 | — |
| N | — | 4.10 | — |
| O | 44.92 | 57.25 | 52.34 |
| Mg | 0.99 | 2.14 | 14.48 |
| Si | 1.85 | 3.62 | 29.81 |
| Cl | 23.35 | 2.92 | 3.38 |
| Ca | 22.72 | 17.66 | — |
| Na | 1.33 | 2.04 | — |
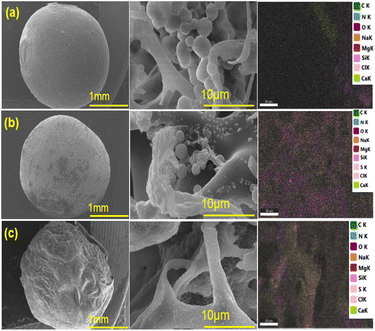
The analysis of the morphology of BHec-RP beads before and after decolorization and BHec-RP (dead cells) after adsorption as control beads is shown in Fig. 3. Furthermore, the elemental analysis of BHec-RP is presented in Table 2. The interaction between MO and BHec-RP is confirmed through SEM images and elemental mapping using EDS, as presented in Fig. 3. These results depict the morphology of beads before (Fig. 3a) and after (Fig. 3b) application and those containing dead cells (Fig. 3c). The characterization shows that the PVA–alginate–hectorite mixture used as a supporting material allows effective trapping of R. pickettii cells, preventing any suspension detected in the decolorization media. Furthermore, live cells are visible in the beads in Fig. 3a and b, forming hanging spheres. This characteristic of R. pickettii is similar to that of E. aerogenes NBO2 and L. plantarum CM53, which form in the tissue of alginate beads.54,55 The condition shows that the cells are protected and well-trapped in the supporting matrix. The composition of the immobilization carrier material can preserve cells and enzymes from environmental changes and denaturation. Furthermore, EDS analysis shows differences in the elemental composition between Fig. 3b and c. The sulfur content in Fig. 3b is lower than in Fig. 3c, showing MO adsorption. In comparison, in Fig. 3b, the content is presumed to be desulfonated by bacterial activity. The carbon is also higher in Fig. 3b and c, 19.79% and 18.58%, due to the adsorbed MO molecules on the beads' surface.
| Elements | % Weight | ||
|---|---|---|---|
| BHec-RP (before) | BHec-RP (after) | BHec-RP (dead cell and after) | |
| C | 10.27 | 19.79 | 18.58 |
| N | 4.10 | 4.51 | 4.03 |
| O | 57.25 | 61.58 | 46.27 |
| Mg | 2.14 | 0.46 | 0.40 |
| Si | 3.62 | 0.87 | 1.12 |
| Cl | 2.92 | 6.28 | 12.03 |
| Ca | 17.66 | 3.0 | 9.43 |
| S | — | 1.05 | 6.28 |
| Na | 2.04 | 2.47 | 5.28 |
Thermal analysis
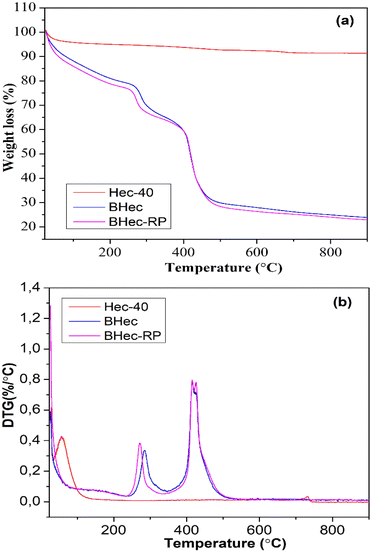
The thermal stability of the hectorite calcined sample (Hec), BHec (PVA–alginate–hectorite), and BHec-RP (PVA–alginate–hectorite-R. pickettii) was analyzed using TGA/DTG, as shown in Fig. 4. The thermogravimetric calcined hectorite (Hec) analysis showed a typical weight loss in two decomposition stages.56 The first weight loss appeared at temperatures below 200 °C, associated with the dehydration of physically absorbed water on the surface of hectorite.57 In this context, hectorite is a hydrophilic material with a high tendency to absorb water within its layers and surface. The second decomposition stage at ∼731 °C is related to the dehydroxylation within the structure.58 The DTG peak for the Hec-calcined sample was observed at the same temperature. Moreover, BHec and BHec-RP beads showed different decomposition stages. The first decomposition was shown below 200 °C, as well as at ∼290 °C and ∼430 °C. The decomposition at ∼250 °C and ∼430 °C shows that the degradation of PVA and alginate polymers occurs in multiple stages between 200–400 °C and 500–650 °C. This data suggests that BHec remains stable at high temperatures, allowing for mechanical stability.Adsorption–desorption of N2
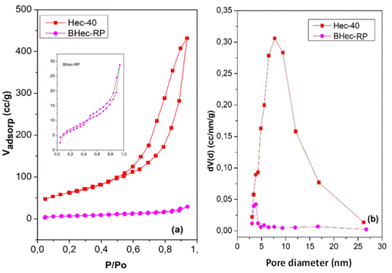
This analysis compares the surface area and pores before and after immobilization in the PVA–alginate matrix. The N2 adsorption–desorption curves of Hec and BHec-RP are shown in Fig. 5. This analysis compares the pore characteristics of Hec powder and its immobilized form. Hec serves as a source of pores that enhance mass transport into and out of BHec. Furthermore, Hec and BHec-RP samples show hysteresis loops in the range of 0.50–0.90 (P/P0), consistent with the characteristics of Type IV isotherms and mesoporous materials. The bead samples show smaller hysteresis loops with lower Vadsop values. The surface area (SBET) and Smeso of BHec-RP beads are lower than Hec, attributed to the intercalation of PVA and alginate species occupying the interlayer surface of hectorite.42 According to the NLDFT method, the SBET and Smeso for Hec and BHec-RP samples are 224.21 m2 g−1, 22.40 m2 g−1, and 217.45 m2 g−1, 20.31 m2 g−1, respectively. The pore diameter of BHec-RP is smaller than that of Hec, measuring 3.82 nm and 7.75 nm, respectively. This data shows that hectorite contributes to the pores and surface area in BHec-RP. The surface of area, pore diameter, and volume of Hec and BHec-RP samples are summarized in Table 3.| Sample | SBET (m2 g−1) | Smeso (m2 g−1) | Pore diameter (nm) | Pore volume (cm3 nm−1 g−1) |
|---|---|---|---|---|
| Hec-40 | 224.21 | 217.45 | 7.75 | 0.62 |
| BHec-RP | 22.40 | 20.31 | 3.82 | 0.04 |
MO degradation using immobilized and free cells
The comparison of MO degradation using immobilized, sterilized immobilized, and free cells is shown in Fig. 6. The highest efficiency is achieved by BHec-RP and free cells after 30 and 48 hours of degradation, respectively. Therefore, R. pickettii cells can effectively degrade MO in immobilized and suspended states. The role of bacteria is evident when compared to BHec-RP beads (dead cells), which only achieved a decolorization of 24%, and the decolorization is an adsorption process. Rapid equilibrium is reached at 12 hours, showing that MO is adsorbed on the surface of the beads. In contrast, BHec-RP (live cells) and free R. pickettii show equilibrium after complete decolorization at 30 and 48 hours. BHec-RP (live cells) quickly reaches equilibrium because MO has been adsorbed since the early stages of interaction. Based on the decolorization profile, the adsorption and degradation processes occur simultaneously, resulting in a shorter time. In free R. pickettii, from 2 to 12 hours, only less than 30% is decolorized. Dye degradation using free cells is slow in the first 12 hours, and the cells are in an adaptation phase. Therefore, it is insufficient to adsorb and produce enzymes optimally. The toxicity of pollutants may lead to the cells adapting over time.36,41,59,60 Similar conditions were reported in the decolorization of crystal violet using free cells of Burkholderia vietnamiensis C09V, where immobilized cells decolorized faster.32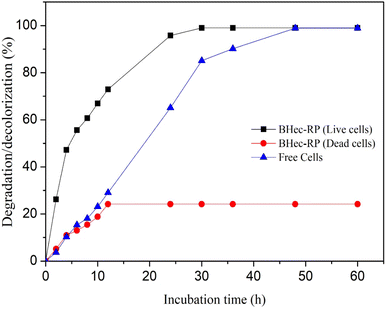 | ||
| Fig. 6 Decolorization MO using BHec-RP (live and dead cells) and free cells (100 mg L−1, static, pH 7, temperature 40 °C). | ||
Adsorption kinetics and MO degradation
In Fig. 6, the removal of methyl orange using immobilized cells resulted from MO first adsorbing onto beads and then degradation by the immobilized cells. Hence, adsorption (dead cells) and biodegradation kinetics (live cells) are investigated in this section to further confirm the mechanism.Adsorption kinetics
 | (3) |
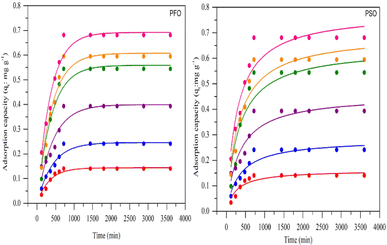 | ||
| Fig. 7 MO adsorption capacity at different initial concentrations (PVA: 10% (w/w); alginate: 1% (w/w); hectorite: 1% (w/w); bead mass 10%, volume 25 mL). | ||
Eqn (3) can be expanded as follows:
| ln(qe − q) = ln(qe) − K1t | (4) |
While the pseudo-second-order kinetics model is determined based on eqn (5) and (6):
 | (5) |
Integration of eqn (5) yields:
 | (6) |
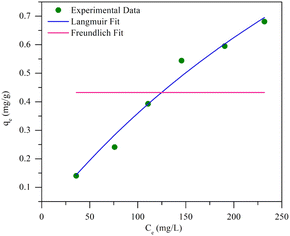
Fig. 7 shows the pseudo-first-order and pseudo-second-order non-linear plots of MO adsorption using initial concentrations of 50–300 mg L−1 at 40 °C. The results reported that equilibrium was reached after 12 hours of incubation, with a maximum adsorption capacity ranging from 0.14 to 0.68 mg g−1. The initial MO concentration is a driving force to overcome mass transfer limitations between the absorbent and liquid phases. A high initial MO concentration enhances the driving force of mass transfer to increase adsorption capacity.37 The first- and second-order kinetic analysis results are summarized in Table 4, showing the rate constant data (K1 and K2) as well as correlation coefficient values (R2) for both models. Data in Table 4 show that the adsorption of MO into BHec-RP (dead cells) fits the pseudo-first-order kinetic model. The coefficient (R12) for the pseudo-first-order model is higher than the pseudo-second-order model. Furthermore, the theoretical qe values are also closer to the experimental results for all initial MO concentrations. This result shows that the pseudo-first-order model more accurately predicts MO adsorption on BHec-RP than the pseudo-second-order model.
| Initial conc. | qe (mg g−1) | Pseudo-first-order | Pseudo-second-order | ||||
|---|---|---|---|---|---|---|---|
| qe1 | K1/min | R12 | qe2 | K2, g mg−1 min−1 | R22 | ||
| 50 | 0.140366 | 0.1435 | 0.0031 | 0.945 | 0.1615 | 0.0245 | 0.862 |
| 100 | 0.241037 | 0.2457 | 0.0024 | 0.952 | 0.2822 | 0.0105 | 0.906 |
| 150 | 0.392927 | 0.3994 | 0.0024 | 0.948 | 0.4561 | 0.0065 | 0.867 |
| 200 | 0.544146 | 0.5587 | 0.0026 | 0.932 | 0.6419 | 0.0048 | 0.861 |
| 250 | 0.594817 | 0.6076 | 0.0026 | 0.955 | 0.6939 | 0.0046 | 0.895 |
| 300 | 0.680854 | 0.6918 | 0.0028 | 0.962 | 0.7805 | 0.0046 | 0.909 |
Further analysis includes a nonlinear isotherm, and eqn (7) and (8) are used to determine the Langmuir and Freundlich nonlinear isotherm models:62–64
 | (7) |
 | (8) |
| Isotherm | Value | Error | ||
|---|---|---|---|---|
| R2 | RSS | Red. Chi-sqr | ||
| Langmuir | ||||
| qmax | 2.37398 | 0.97201 | 0.00502 | 0.00125 |
| KL | 0.00179 | |||
![[thin space (1/6-em)]](https://www.rsc.org/images/entities/char_2009.gif) |
||||
| Freundlich | ||||
| KF | 0.43236 | −0.25 | 0.22406 | 0.05601 |
| n | −1.003 × 10²³ | |||
Fig. 8 shows that the Langmuir isotherm plot is more consistent with the data than the Freundlich isotherm. This is reflected in the summary of the analysis, which shows correlation coefficients (R2) close to 1, while for the Freundlich isotherm, it is negative. Additionally, the sum of squared residuals (RSS) and reduced chi-square (Red. Chi-Sqr) values for the Langmuir isotherm are the smallest, showing a strong correlation. The conformity suggests that the adsorption of MO into the beads is a monolayer process with a maximum capacity of 2.374 mg g−1.
Degradation kinetics
Several models have been applied to describe the biodegradation of organic pollutants. Exponential functions (pseudo-first-order kinetics) depict such biodegradation.32,37,41 Therefore, this research determined the biodegradation kinetics of MO with BHec-RP (live cells) and free cells using the first-order equation based on Fig. 9a and b data using eqn (9). The rate constant can be calculated from the slope.
 | (9) |
 | (10) |
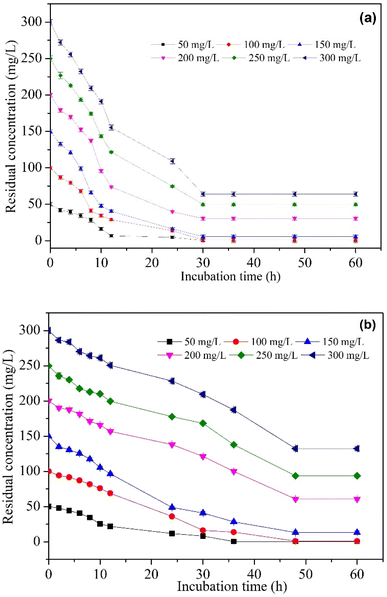 | ||
| Fig. 9 The influence of initial MO concentrations on (a) BHec-RP (Live cells) and (b) Free R. pickettii cells. | ||
The adoption of immobilized cells to degrade MO was investigated through various initial concentrations. The results are shown in Fig. 9a, where MO is significantly degraded by BHec-RP (live cells). Table 6 summarizes the data for the kinetics of MO degradation through BHec-RP (live cells), expressed by the first-order reaction model (R2 > 0.90). The biodegradation rate constant k is directly proportional to the initial concentration of MO, with the rate constant ranging from 0.025 to 0.0017 mg L−1 h−1 at 50–150 mg L−1, and concentrations above the value show a gradual decrease in the rate.
| MO (mg L−1) | BHec-RP | Free R. pickettii | ||||
|---|---|---|---|---|---|---|
| k (mg L−1 h−1) | t1/2 (h) | R2 | k (mg L−1 h−1) | t1/2 (h) | R2 | |
| 50 | 0.025 | 27.73 | 0.9034 | 0.015 | 46.21 | 0.9642 |
| 100 | 0.022 | 31.51 | 0.9384 | 0.014 | 49.51 | 0.9361 |
| 150 | 0.017 | 40.77 | 0.9754 | 0.007 | 99.02 | 0.9726 |
| 200 | 0.010 | 69.31 | 0.9471 | 0.003 | 231.05 | 0.9777 |
| 250 | 0.008 | 86.64 | 0.9525 | 0.003 | 231.05 | 0.9563 |
| 300 | 0.008 | 86.64 | 0.9561 | 0.003 | 231.05 | 0.9847 |
Similarly, as listed in Table 6, it also reports data on the kinetics of MO degradation by free R. pickettii cells, with the maximum rate being 0.015–0.014 mg L−1 h−1 at 50–100 mg L−1 MO, and concentrations >100 mg L−1 showing a decrease in the constant. These results show that higher MO concentrations reduce the biodegradation activity of BHec-RP and free R. pickettii. Based on the constant biodegradation rate k and half-time t1/2, MO degradation by BHec-RP (live cells) is higher and faster than free R. pickettii cells. Zhang et al.40 reported that immobilized cells are always superior. These results were consistent with other studies that used immobilized cells for the biodegradation of methyl violet,65 ammonia,40 fenol,36 naftalen,37 and azo dyes (Malachite green, Auramine yellow, MO).66
Factors affecting the biodegradation of methyl orange
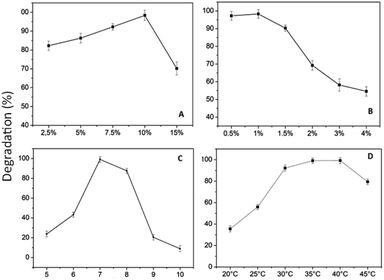
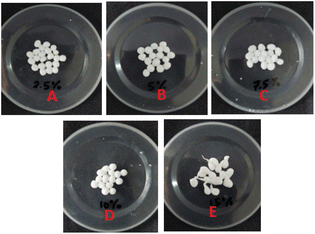
Fig. 10 shows that the optimal levels of immobilization carriers for R. pickettii are PVA 10% (w/v) and hectorite 1% (w/v). In Fig. 10a, the matrix's PVA concentration significantly affects the MO degradation rate. The appropriate PVA content determines the mechanical properties of BHec-RP beads. This research found that 2.5–7.5% PVA levels showed a perfect round shape but low mechanical properties, as shown by breakage when pressed with fingers. A PVA concentration of 10% showed high mechanical stability, resisting breakage when pressed and producing perfectly round beads (Fig. 11). In contrast, a PVA concentration of 15% resulted in very rigid or hard beads. A PVA concentration of 10% showed optimum mechanical properties and a degradation rate.36,37,40,65 El-Naas et al.67 reported that a PVA content of 10% produces high porosity and a stable microstructure with pore distribution. The porous structure enhances the substrate and oxygen diffusion rates required by cells. Increasing the PVA concentration affects the thickness or strength of the bead walls and reduces the number and size of macro pores.68 However, this condition has been addressed by adding inorganic materials such as kaolin,41 bentonite,69 activated sludge,70 and hectorite.
The influence of hectorite concentration, as shown in Fig. 10b shows that when the concentration is above 1%, the rate of MO degradation sharply decreases, ranging from 10% to 40%. High concentrations in the beads may have obstructed the cell space, adversely affecting bacterial activity.41 The reported range of inorganic material concentrations supporting pollutant degradation efficiency in the immobilization systems is between 1% and 2.5%.36,37,40,65 Generally, increasing the concentration of inorganic material in the immobilization matrix affects the mechanical properties of beads but has a negative influence on the ability of cells to degrade pollutants.37,41,71,72 Based on the variations in PVA and hectorite concentrations, the optimal decolorization formulation consists of PVA 10% and hectorite 1%.
Another factor influencing MO degradation by BHec-RP is temperature, as shown in Fig. 10d. These results show that the optimum temperature is achieved at 40 °C. Generally, the optimum biodegradation temperature range is around 30–40 °C,12,74 showing that R. pickettii is a mesophilic bacterium, and higher optimum temperatures can be found in thermophilic bacteria.75 At high temperatures, cell viability decreases, and enzymes included in MO degradation can denature.76 For some bacteria, such as Aeromonas hydrophila, Pseudomonas sp, and Shewanella oneidensis MR-1, the optimum temperature is achieved in the range of 35–40 °C.12,59,77
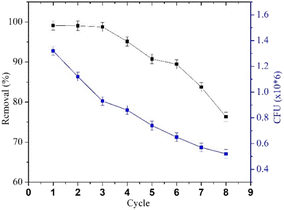
The decline in MO removal activity is consistent with the decrease in R. pickettii CFU counts. The reduction in immobilized cell numbers can be attributed to a combination of cell death, matrix leakage (if entrapped), diffusion pathway blockage, and waste toxicity.79 Wojcieszynska et al.80 reported that while this immobilization system offers several advantages, increasing the number of immobilized cell cycles leads to matrix pore blockage, limiting oxygen and nutrient diffusion. These conditions negatively impact the cells within the beads and their degradation efficiency. For instance, R. pickettii immobilized using an alginate–polyvinyl alcohol–bentonite matrix exhibited a significant decrease in OD600 and demonstrated degradation effectiveness for only two cycles.81 In contrast, studies on immobilized bacterial-fungal consortium cells in a PVA matrix reported Direct Fast Scarlet 4BS degradation effectiveness for up to 30 cycles,82 a consortium on B. laterosporus/G. geotrichum immobilized on coconut peat showed textile effluent degradation effectiveness (>80%) for up to 7 cycles.83 These cases highlight that several other factors influence the performance of immobilized bacteria in pollutant degradation over multiple cycles. Cell type, consortium composition, matrix quality, and immobilization method appear to significantly impact cell stability.
Identification of enzymes and degradation metabolites
Enzymes found in the decolorization reaction are broadly categorized into two main groups, namely reducing and oxidizing. Lignin, peroxidase, laccase, tyrosinase, azoreductase, riboflavin reductase, NADH-DCIP reductase, and aminopyrine N-demethylase were reported to be included in the degradation of azodyes.59,84,85 Srinivasan et al.13 reported that enzymes produced by each bacterial species are responsible for the dye molecule's structure fragmentation. This research stated the activity of azoreductase and NADH-DCIP reductase, as reducing enzymes, and laccase, representing oxidizing enzymes, as summarized in Table 7.To get insight into the MO decolorization mechanism by R. pickettii, the activities of azoreductase, NADH-DCIP reductase, and laccase were determined before (just after inoculation, i.e., 0 h) and after decolorization (i.e., within 48 h of incubation). The azoreductase assay was performed in a 2.0 mL reaction mixture containing 4.45 μM× methyl red, 0.2 mL enzyme solution, and 50 mM potassium phosphate buffer (pH 7.5). After the addition of 100 μM NADH to initiate the reaction, the reductive cleavage of methyl red was monitored spectrophotometrically at 430 nm (δ 430 nm = 23![[thin space (1/6-em)]](https://www.rsc.org/images/entities/char_2009.gif) 360 M−1 cm−1).86 NADH–DCIP reductase activity was measured using a reaction mixture containing 25 μM DCIP and 0.2 mL of enzyme solution in 50 mM potassium phosphate buffer (pH 7.5). A 2.0 mL aliquot from the reaction mixture was combined with 250 μM NADH. The nicotinamide adenine dinucleotide-dichlorophenol indophenol (NADH-DCIP) reductase assay involved monitoring the reduction in color intensity of DCIP at a wavelength of 590 nm, which was monitored spectrophotometrically (ε = 19 mM−1 cm−1).87 Laccase enzyme activity was conducted through the observation of an increase in absorbance at 420 nm, which was attributed to the oxidation of the 2,2′-azino-bis(3-ethylbenzthiazoline)-6-sulfonate (ABTS) compound.88 One unit of laccase activity is defined as the amount of enzyme required to oxidize 1 nmol of ABTS per minute at 28 °C.
360 M−1 cm−1).86 NADH–DCIP reductase activity was measured using a reaction mixture containing 25 μM DCIP and 0.2 mL of enzyme solution in 50 mM potassium phosphate buffer (pH 7.5). A 2.0 mL aliquot from the reaction mixture was combined with 250 μM NADH. The nicotinamide adenine dinucleotide-dichlorophenol indophenol (NADH-DCIP) reductase assay involved monitoring the reduction in color intensity of DCIP at a wavelength of 590 nm, which was monitored spectrophotometrically (ε = 19 mM−1 cm−1).87 Laccase enzyme activity was conducted through the observation of an increase in absorbance at 420 nm, which was attributed to the oxidation of the 2,2′-azino-bis(3-ethylbenzthiazoline)-6-sulfonate (ABTS) compound.88 One unit of laccase activity is defined as the amount of enzyme required to oxidize 1 nmol of ABTS per minute at 28 °C.
Table 7 shows that the extracellular crude enzyme activity in the control group is lower than in free R. pickettii and immobilized cells (BHec-RP). Similar results were reported in Kocuria rosea (MTCC 1532), showing an increase in laccase, azoreductase, and NADH-DCIP reductase activities after induction with MO and malachite green.76,89 In this research, the activity of laccase, azoreductase, and NADH-DCIP reductase enzymes was higher than undere immobilization conditions. The significant difference in enzyme activity between free and immobilized cells is attributed to position. In free cells, secreted enzymes are suspended in the decolorization medium. In immobilized cells, a significant portion of enzymes is protected within the matrix, resulting in lower measured activity. The detection of extracellular enzyme activity shows that a part of the decolorization process occurs extracellularly. The three types of enzymes analyzed are most commonly reported in the decolorization of azo dyes.49,51,75 The knowledge regarding the types of enzymes shows the character of the produced metabolites. For example, azoreductase is responsible for symmetric cleavage, while laccase and LiP function asymmetrically,8 and NADH-DCIP reductase is included in reduction reactions.90 These enzymes play a crucial role in breaking down the azo dyes, leading to the decolorization process.75,91–93 The different functions of each enzyme provide insight into the specific mechanisms involved in the degradation of these compounds. Understanding the types of enzymes involved can also help in optimizing bioremediation processes for more efficient and effective dye removal from industrial wastewater.94 Additionally, further research on the metabolites produced by these enzymes can provide valuable information for designing tailored enzyme cocktails for enhanced decolorization performance.
Identification of metabolites and proposed determination of biodegradation pathway
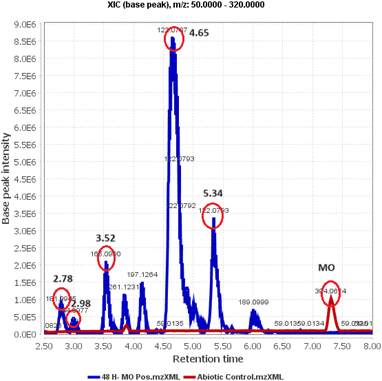
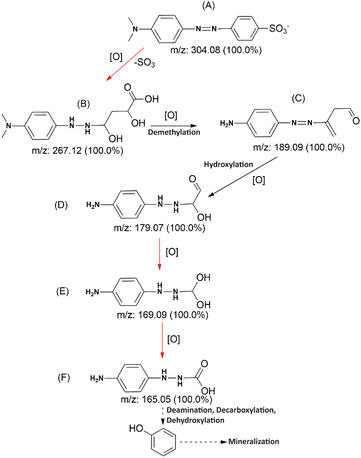
Identification of post-degradation dye metabolites is crucial to understanding the extent of pollutant degradation. The search for microbial strains with exceptional pollutant mineralization capabilities is the focus of different studies since microbial processes are categorized as environmentally safe green processes. However, the capabilities of microbial cells vary, specifically in the ability to produce enzymes that play a role in breaking down the molecular structure of pollutants. In this analysis, the identification of metabolites was performed using LC-QTOF-MS, as shown in Fig. 14. The chromatogram shows five different peaks compared to the control, predicted to be metabolites at retention times of 2.78, 2.98, 3.52, 4.65, and 5.97 minutes. Meanwhile, the control peak for MO is present at a retention time of 7.28 minutes.Raw data from the LC-QTOF-MS analysis was processed using MZmine software version 2.53 to obtain specific spectra for the target peaks. Different chromatographic peaks at specific retention times are suspected to be metabolites resulting from the degradation of MO by immobilized R. pickettii. Based on the mass spectra, fragments of the suspected metabolites were obtained, as shown in Table 8. The molecular structure prediction of MO metabolites was based on reference methods and PathPred (https://www.genome.jp/tools/pathpred/).8 This resulted in several predicted molecular fragmentations with successive m/z values following the sequence of symbols (B) 267.12; (C) 189.09; (D) 179.07; (E) 169.09; and (F) 165.05. Symbol A represents the basic structure of MO. This data shows that MO is subjected to fragmentation towards simpler molecules by opening the aromatic ring. Similar patterns have been observed in some bacteria applied for MO degradation and certain azo dyes, such as Franconibacter sp. 1 MS,8 Kocuria rosea MTCC 1532 (ref. 89), and Aeromonas hydrophila.59
| RT | M/Z | Name | Molecular formula | Structure |
|---|---|---|---|---|
| 2.78 | 267.12 | 4-(2-(4-(Dimethylamino)phenyl)hydrazinyl)-2,4-dihydroxybutanoic acid | C12H19N3O4 | B |
| 2.98 | 189.09 | 3-((4-Aminophenyl)diazenyl)but-3-enal | C10H11N3O | C |
| 3.52 | 179.07 | 2-(2-(4-Aminophenyl)hydrazinyl)-2-hydroxyacetaldehyde | C8H11N3O2 | D |
| 4.65 | 169.09 | (2-(4-Aminophenyl)hydrazinyl)methanediol | C7H11N3O2 | E |
| 5.34 | 165.05 | 2-(4-Aminophenyl)hydrazinecarboxylic acid | C7H9N3O2 | F |
Fig. 15 shows the predicted biodegradation pathway of MO, where a desulfonation and aromatic structure oxidation reaction occurs from molecule A to B. Enzymatic reactions leading to the transformation of molecule B into an open-chain structure have been obtained using the Predicted Pathway application. The first reaction in this pathway includes desulfonation and hydroxylation on the aromatic ring, which dioxygenase enzymes can catalyze. Mono- and dioxygenase enzymes, phenol hydroxylase, and catechol-2,3-dioxygenase are commonly found in R. pickettii, catalyzing the oxidation of aromatic rings such as toluene. Meanwhile, hydroxylation is an enzymatic mechanism that facilitates the transformation of functional groups into carbonyl, acetyl, and decarboxylation. The proposed degradation sequence seems logical due to the similar patterns formed.95
Molecular fragmentation from B to F comprises complex reactions that may include various oxidoreductase and oxygenase enzymes, based on the PathPred application. However, the identified enzymes are azoreductase and NADH-DCIP reductase, which are included in the reduction of azo bonds.75 These two enzymes show higher activity than the control, showing that MO and its fragments successfully induce the biosynthesis of reducing enzymes. These two enzymes show higher activity than the control, showing that MO and Its fragments successfully induce the biosynthesis of reducing enzymes. Overall, the degradation pathway of MO involves a series of intricate reactions mediated by specific enzymes. Through the reduction of azo bonds by enzymes such as azoreductase and NADH-DCIP reductase, MO and its fragments are successfully broken down into simpler molecules.49,96 This process demonstrates the effectiveness of MO in inducing the biosynthesis of reducing enzymes, ultimately aiding in the breakdown of the compound into carbonyl, acetyl, and decarboxylation functional groups. The logical progression of molecular fragmentation seen in this study further supports the proposed degradation sequence for MO.
The fragmentation of MO varies significantly depending on the microbial strain used. Different strains will undoubtedly adopt their own pathways and enzymes. Several studies have shown that MO is subjected to both symmetric and asymmetric fragmentations, which are catalyzed by azoreductase and lignin peroxidase, respectively.8,97 Furthermore, laccase is strongly included in thiazole yellow G's desulfonation and demethylation reactions.98 This confirms that R. pickettii laccase is used in molecule A's desulfonation and demethylation reactions, resulting in the production of fragments B and C. Overall, the diverse enzymatic activities of different microbial strains play a crucial role in the fragmentation of MO. The involvement of azoreductase, lignin peroxidase, and laccase in these reactions highlights the complexity of the process.26,75,99 The specific pathways and enzymes utilized by each strain further underscore the variability in MO fragmentation. These findings shed light on the intricate mechanisms involved in the degradation of MO by microbial communities.
Author contributions
Asranudin: conceptualization, methodology, investigation, validation, writing – original draft. Holilah: methodology, validation, supervision, writing – review & editing. Adi Setyo Purnomo: supervision, validation, writing – review & editing. Didik Prasetyoko: validation, supervision, writing – review & editing. Riki Subagyo: conceptualization, supervision. Noureddine El Messaoudi: validation, conceptualization. Alya Awinatul Rohmah: editing. Alvin Romadhoni Putra Hidayat: editing.Conflicts of interest
There are no conflicts to declare.Acknowledgements
The authors convey sincere thanks to Kemenristek-Dikti-Indonesia for their financial support through the Penelitian Disertasi Doktor (PDD) programme fund under contract number 1890/PKS/ITS/2023.References
- W. Song, J. Li, X. Zhang, J. Feng, X. Du, Q. Wang, C. Fu, W. Qiu, Z. Wang and X. Gao, J. Environ. Manage., 2022, 308, 114397 CrossRef CAS PubMed.
- Asranudin, A. S. Purnomo, D. Prasetyoko, H. Bahruji and Holilah, Mater. Chem. Phys., 2022, 291, 126749 CrossRef CAS.
- Asranudin, Holilah, A. S. Purnomo, H. Bahruji, D. Allouss, I. El Alaoui-elbalrhiti, R. Subagyo and A. Rohmah, RSC Adv., 2022, 13, 790–801 RSC.
- Z. M. Şenol, N. El Messaoudi, Z. Ciğeroglu, Y. Miyah, H. Arslanoğlu, N. Bağlam, E. S. Kazan-Kaya, P. Kaur and J. Georgin, Food Chem., 2024, 450, 139398 CrossRef PubMed.
- M. El Khomri, N. El Messaoudi, A. Dbik, S. Bentahar, Y. Fernine, A. Bouich, A. Lacherai and A. Jada, Emergent Mater., 2022, 5, 1679–1688 CrossRef.
- Z. Cigeroglu, N. El Messaoudi, Z. M. Senol, G. Baskan, J. Georgin and S. Gubernat, Mater. Today Sustain., 2024, 26, 100735 CrossRef.
- B. B. Hameed and Z. Z. Ismail, Biochem. Eng. J., 2018, 137, 71–77 CrossRef CAS.
- D. Baena-Baldiris, A. Montes-Robledo and R. Baldiris-Avila, Omega, 2020, 5, 28146–188157 CrossRef CAS PubMed.
- R. El Kaim Billah, A. Zaghloul, H. A. Ahsaine, A. BaQais, I. Khadoudi, N. El Messaoudi, M. Agunaou, A. Soufiane and R. Jugade, Int. J. Environ. Anal. Chem., 2022, 1–17 CrossRef.
- F. Qu, K. Elomari, A. Wagner, A. De Simone and K. Beis, Biochem. J., 2019, 476, 3649–3660 CrossRef CAS PubMed.
- L. Ayed, E. Khelifi, H. Ben Jannet, H. Miladi, A. Cheref, S. Achour and A. Bakhrouf, Chem. Eng. J., 2010, 165, 200–208 CrossRef CAS.
- U. Roy, S. Sengupta, P. Banerjee, P. Das, A. Bhowal and S. Datta, J. Environ. Manage., 2018, 223, 185–195 CrossRef CAS PubMed.
- S. Srinivasan, K. P. M and S. Nagaraj, Latest Innovations in Bacterial Degradation of Textile Azo Dyes, INC, 2020 Search PubMed.
- H. Lade, S. Govindwar and D. Paul, Int. J. Environ. Res. Public Health, 2015, 12, 6894–6918 CrossRef CAS PubMed.
- Y. Wang, L. Jiang, H. Shang, Q. Li and W. Zhou, Environ. Technol. Innovation, 2020, 19, 100810 CrossRef.
- K. O. Iwuozor, J. O. Ighalo, E. C. Emenike, L. A. Ogunfowora and C. A. Igwegbe, Curr. Res. Green Sustainable Chem., 2021, 4, 100179 CrossRef CAS.
- A. Haji and M. Naebe, J. Cleaner Prod., 2020, 265, 121866 CrossRef CAS.
- Y. Jin, Y. Wu, J. Cao and Y. Wu, J. Taiwan Inst. Chem. Eng., 2014, 45, 589–595 CrossRef CAS.
- N. El Messaoudi, Z. Ciğeroğlu, Z. M. Şenol, M. El Hajam and L. Noureen, J. Water Process Eng., 2023, 55, 104150 CrossRef.
- N. El Messaoudi, Z. Ciğeroğlu, Z. M. Şenol, E. S. Kazan-Kaya, Y. Fernine, S. Gubernat and Z. Lopicic, Biomass Convers. Biorefin., 2024, 2024, 1–22 Search PubMed.
- S. Chowdhury, R. Mishra, P. Saha and P. Kushwaha, Desalination, 2011, 265, 159–168 CrossRef CAS.
- Z. Irshad, I. Bibi, A. Ghafoor, F. Majid, S. Kamal, S. Ezzine, Z. M. Elqahtani, N. Alwadai, N. El Messaoudi and M. Iqbal, Results Phys., 2022, 42, 106006 CrossRef.
- B. Saba, A. D. Christy, T. Park, Z. Yu, K. Li and O. H. Tuovinen, Appl. Biochem. Biotechnol., 2018, 186, 1017–1033 CrossRef CAS PubMed.
- T. R. Alkas, R. Ediati, T. Ersam, R. Nawfa and A. S. Purnomo, Arabian J. Chem., 2022, 15, 104129 CrossRef CAS.
- M. B. Kurade, T. R. Waghmode, J. Q. Xiong, S. P. Govindwar and B. H. Jeon, J. Cleaner Prod., 2019, 213, 884–891 CrossRef CAS.
- S. K. Sen, S. Raut, P. Bandyopadhyay and S. Raut, Fungal Biol. Rev., 2016, 30(3), 112–133 CrossRef.
- M. Zhao, P. Sun, L. Du and G. Wang, Environ. Sci. Pollut. Res., 2014, 6136–6145 CrossRef CAS PubMed.
- J. Cao, E. Sanganyado, W. Liu, W. Zhang and Y. Liu, J. Environ. Manage., 2019, 242, 229–237 CrossRef CAS PubMed.
- X. Zhang, H. Song, Y. Chen, M. Zhuang and W. Liu, Int. Biodeterior. Biodegrad., 2021, 157, 105142 CrossRef CAS.
- S. Srinivasan and S. K. Sadasivam, J. Water Process Eng., 2018, 22, 180–191 CrossRef.
- S. C. D. Sharma, Q. Sun, J. Li, Y. Wang, F. Suanon, J. Yang and C. P. Yu, Int. Biodeterior. Biodegrad., 2016, 112, 88–97 CrossRef CAS.
- Y. Cheng, H. Y. Lin, Z. Chen, M. Megharaj and R. Naidu, Ecotoxicol. Environ. Saf., 2012, 83, 108–114 CrossRef CAS PubMed.
- M. N. Kathiravan, S. A. Praveen, G. H. Gim, G. H. Han and S. W. Kim, Bioprocess Biosyst. Eng., 2014, 37, 2149–2162 CrossRef CAS PubMed.
- T. R. Alkas, A. S. Purnomo, R. Ediati and T. Ersam, RSC Adv., 2023, 13, 30885–30897 RSC.
- S. H. Liu, Z. T. Zeng, Q. Y. Niu, R. Xiao, G. M. Zeng, Y. Liu, M. Cheng, K. Hu, L. H. Jiang, X. F. Tan and J. J. Tao, Sci. Total Environ., 2019, 655, 1279–1287 CrossRef CAS PubMed.
- B. Ruan, P. Wu, M. Chen, X. Lai, L. Chen, L. Yu, B. Gong, C. Kang, Z. Dang, Z. Shi and Z. Liu, Ecotoxicol. Environ. Saf., 2018, 162, 103–111 CrossRef CAS PubMed.
- C. Lin, L. Gan, Z. Chen, M. Megharaj and R. Naidu, Biochem. Eng. J., 2014, 90, 1–7 CrossRef CAS.
- A. S. Purnomo, S. R. Putra, H. S. Putro, A. Hamzah, N. A. Rohma, A. A. Rohmah, H. D. Rizqi, Asranudin, B. V. Tangahu, I. D. A. A. Warmadewanthi and K. Shimizu, RSC Adv., 2023, 13, 21163–21170 RSC.
- A. Dzionek, D. Wojcieszyńska and U. Guzik, Electron. J. Biotechnol., 2016, 23, 28–36 CrossRef.
- Y. Zhang, Z. Yu, Y. Hu, C. Song, F. Li, W. He, X. Wang, Z. Li and H. Lin, Environ. Technol. Innovation, 2021, 22, 101407 CrossRef CAS.
- H. Lin, Z. Chen, M. Megharaj and R. Naidu, Appl. Clay Sci., 2013, 83–84, 336–342 CrossRef CAS.
- R. R. Pawar, Lalhmunsiama, P. Gupta, S. Y. Sawant, B. Shahmoradi and S. M. Lee, Int. J. Biol. Macromol., 2018, 114, 1315–1324 CrossRef CAS PubMed.
- G. A. Płaza, J. Wypych, C. Berry and R. L. Brigmon, World J. Microbiol. Biotechnol., 2007, 23, 533–542 CrossRef.
- A. S. Purnomo, D. Maulianawati and I. Kamei, J. Microbiol. Biotechnol., 2019, 29, 1424–1433 CrossRef CAS PubMed.
- A. S. Purnomo, A. Sariwati and I. Kamei, Heliyon, 2020, 6, e04027 CrossRef PubMed.
- P. A. Setyo, R. H. Dwi, F. Sri, P. H. Sulistyo and K. Ichiro, Res. J. Chem. Environ., 2018, 22, 151–156 Search PubMed.
- A. S. Purnomo, H. D. Rizqi, L. Harmelia, S. D. Anggraeni, R. E. Melati, Z. H. Damayanti and O. M. Shafwah, Malays. J. Fundam. Appl. Sci., 2019, 15, 377–380 CrossRef.
- R. A. Hashem, R. Samir, T. M. Essam, A. E. Ali and M. A. Amin, AMB Express, 2018, 1–12 CAS.
- M. M. Haque, M. A. Haque, M. K. Mosharaf and P. K. Marcus, Saudi J. Biol. Sci., 2021, 28, 793–804 CrossRef CAS PubMed.
- S. Barathi, C. Karthik and I. A. Padikasan, Toxicol. Rep., 2020, 7, 16–22 CrossRef CAS PubMed.
- I. Uribe-Arizmendi, M. A. Anducho-Reyes, M. R. Ramírez-Vargas, A. Cadena-Ramírez, C. R. Muro-Urista and A. Téllez-Jurado, Water, Air, Soil Pollut., 2020, 231(307), 1–14 Search PubMed.
- Lalhmunsiama, R. R. Pawar, S. M. Hong, K. J. Jin and S. M. Lee, J. Mol. Liq., 2017, 240, 497–503 CrossRef CAS.
- J. Zhang, C. H. Zhou, S. Petit and H. Zhang, Appl. Clay Sci., 2019, 177, 114–138 CrossRef CAS.
- I. Darah, M. Nisha and L. Sheh-Hong, Appl. Biochem. Biotechnol., 2015, 175, 2629–2636 CrossRef CAS PubMed.
- H. Ayama, P. Sumpavapol and S. Chanthachum, Songklanakarin J. Sci. Technol., 2014, 36, 291–299 Search PubMed.
- C. M. Earnest, Thermochim. Acta, 1983, 63, 277–289 CrossRef CAS.
- A. M. Shanmugharaj, K. Yop and S. Hun, J. Colloid Interface Sci., 2006, 298, 854–859 CrossRef CAS PubMed.
- M. Asgari, A. Abouelmagd and U. Sundararaj, Appl. Clay Sci., 2017, 146, 439–448 CrossRef CAS.
- K. Velusamy, S. Periyasamy, P. S. Kumar, C. F. Caroline, T. Jayaraj, M. Gokulakrishnan and P. Keerthana, Environ. Technol. Innovation, 2022, 25, 102126 CrossRef CAS.
- K. Akansha, D. Chakraborty and S. Ghosh, Biocatal. Agric. Biotechnol., 2019, 18, 101044 CrossRef.
- D. Ş. Arslan, H. Ertap, Z. M. Şenol, N. El Messaoudi and V. Mehmeti, J. Polym. Environ., 2024, 32, 573–587 CrossRef CAS.
- A. R. P. Hidayat, D. O. Sulistiono, I. K. Murwani, B. F. Endrawati, H. Fansuri, L. L. Zulfa and R. Ediati, J. Environ. Chem. Eng., 2021, 9, 106675 CrossRef CAS.
- A. El Mouden, N. El Messaoudi, A. El Guerraf, A. Bouich, V. Mehmeti, A. Lacherai, A. Jada and J. H. Pinê Américo-Pinheiro, Environ. Res., 2023, 225, 115606 CrossRef CAS PubMed.
- Z. M. Şenol, E. Elma, N. El Messaoudi and V. Mehmeti, J. Mol. Liq., 2023, 391, 123310 CrossRef.
- Y. Cheng, H. Lin, Z. Chen, M. Megharaj and R. Naidu, Ecotoxicol. Environ. Saf., 2012, 83, 108–114 CrossRef CAS PubMed.
- N. Khan, A. Ahmad, V. Sharma, A. K. Saha, A. Pandey and P. Chaturvedi Bhargava, Renewable Energy, 2022, 200, 1589–1601 CrossRef CAS.
- M. H. El-Naas, A. I. Mourad and R. Surkatti, Int. Biodeterior. Biodegrad., 2013, 85, 413–420 CrossRef CAS.
- Z. Li-sheng, W. U. Wei-zhong and W. Jian-long, J. Environ. Sci., 2007, 19, 1293–1297 CrossRef PubMed.
- B. Gong, P. Wu, Z. Huang, Y. Li, Z. Dang, B. Ruan, C. Kang and N. Zhu, Chemosphere, 2016, 148, 388–394 CrossRef CAS PubMed.
- M. F. Bergero and G. I. Lucchesi, J. Biotechnol., 2018, 272–273, 1–6 CrossRef CAS PubMed.
- L. Yu, J. qiu Hua, H. cheng Fan, O. George and Y. Lu, J. Hazard. Mater., 2020, 387, 121697 CrossRef CAS PubMed.
- S. Mnasri Ghnimi and N. Frini-Srasra, Appl. Clay Sci., 2018, 158, 150–157 CrossRef CAS.
- G. Guo, X. Li, F. Tian, T. Liu, F. Yang, K. Ding, C. Liu, J. Chen and C. Wang, Chemosphere, 2020, 244, 125510 CrossRef CAS PubMed.
- S. K. Garg and M. Tripathi, Res. J. Microbiol., 2017, 12, 1–19 CrossRef CAS.
- G. Guo, J. Hao, F. Tian, C. Liu, K. Ding, C. Zhang, F. Yang and J. Xu, Bioresour. Technol., 2020, 316, 123923 CrossRef CAS PubMed.
- G. Parshetti, S. Kalme, G. Saratale and S. Govindwar, Acta Chim. Slov., 2015, 53, 492–498 Search PubMed.
- P. Cai, X. Xiao, Y. He, W. Li, J. Chu and C. Wu, Appl. Microbiol. Biotechnol., 2012, 1769–1776 CrossRef CAS PubMed.
- J. Y. Wu, S. C. J. Hwang, C. T. Chen and K. C. Chen, Enzyme Microb. Technol., 2005, 37, 102–112 CrossRef CAS.
- J. Liu, S. Li, X. Li, Y. Gao and W. Ling, Environ. Technol., 2018, 39, 2423–2433 CrossRef CAS PubMed.
- D. Wojcieszynska, A. Marchlewicz and U. Guzik, Molecules, 2020, 25, 4473 CrossRef CAS PubMed.
- A. S. Purnomo, F. W. Hairunnisa, Misdar, V. P. Maria, A. A. Rohmah, S. R. Putra, H. S. Putro and H. D. Rizqi, Heliyon, 2024, 10, e27871 CrossRef CAS PubMed.
- F. He, W. Hu and Y. Li, Chemosphere, 2004, 57, 293–301 CrossRef CAS PubMed.
- M. B. Kurade, T. R. Waghmode, S. M. Patil, B. H. Jeon and S. P. Govindwar, Chem. Eng. J., 2017, 307, 1026–1036 CrossRef CAS.
- S. A. Misal and K. R. Gawai, Bioresour. Bioprocess., 2018, 5(17), 1–9 Search PubMed.
- R. L. Singh, P. K. Singh and R. P. Singh, Int. Biodeterior. Biodegrad., 2015, 104, 21–31 CrossRef CAS.
- G. D. Saratale, R. G. Saratale, J. S. Chang and S. P. Govindwar, Int. Biodeterior. Biodegrad., 2011, 65, 494–503 CrossRef CAS.
- H. S. Lade, T. R. Waghmode, A. A. Kadam and S. P. Govindwar, Int. Biodeterior. Biodegrad., 2012, 72, 94–107 CrossRef CAS.
- R. Al-Tohamy, S. S. Ali, R. Xie, M. Schagerl, M. A. Khalil and J. Sun, Ecotoxicol. Environ. Saf., 2023, 263, 115258 CrossRef CAS PubMed.
- G. K. Parshetti, A. A. Telke, D. C. Kalyani and S. P. Govindwar, J. Hazard. Mater., 2010, 176, 503–509 CrossRef CAS PubMed.
- L. N. Du, M. Zhao, G. Li, F. C. Xu, W. H. Chen and Y. H. Zhao, Int. Biodeterior. Biodegrad., 2013, 78, 108–116 CrossRef CAS.
- S. Barathi, K. N. Aruljothi, C. Karthik, I. Arulselvi and I. A. Padikasan, Biotechnol. Rep., 2020, 28, e00522 CrossRef PubMed.
- M. Bilal, M. Asgher, R. Parra-Saldivar, H. Hu, W. Wang, X. Zhang and H. M. N. Iqbal, Sci. Total Environ., 2017, 576, 646–659 CrossRef CAS PubMed.
- M. M. Haque, M. N. Hossen, A. Rahman, J. Roy, M. R. Talukder, M. Ahmed, M. Ahiduzzaman and M. A. Haque, Chemosphere, 2024, 346, 140568 CrossRef CAS PubMed.
- G. Guo, J. Hao, F. Tian, C. Liu, K. Ding, J. Xu, W. Zhou and Z. Guan, Ecotoxicol. Environ. Saf., 2020, 204, 111073 CrossRef CAS PubMed.
- M. P. Ryan, J. T. Pembroke and C. C. Adley, J. Appl. Microbiol., 2007, 103, 754–764 CrossRef CAS PubMed.
- J. Cong, X. Xie, Y. Liu, Y. Qin, J. Fan, Y. Fang, N. Liu, Q. Zhang, X. Song and W. Sand, RSC Adv., 2022, 12, 1968–1981 RSC.
- A. S. Purnomo, Asranudin, N. Rachmawati, H. D. Rizqi, R. Nawfa and S. R. Putra, HAYATI J. Biosci., 2022, 29, 146–154 CrossRef.
- P. O. Bankole, A. A. Adekunle and S. P. Govindwar, Biotechnol. Rep., 2019, 23, e00327 CrossRef PubMed.
- H. Nadaroglu, G. Mosber, A. A. Gungor, G. Adıguzel and A. Adiguzel, J. Water Process Eng., 2019, 31, 100866 CrossRef.
| This journal is © The Royal Society of Chemistry 2024 |

