 Open Access Article
A study on the bio-based surfactant sodium cocoyl alaninate as a foaming agent for enhanced oil recovery in high-salt oil reservoirs
Hongda Hao a,
Hongze Wua,
Haoyu Diaob,
Yixin Zhanga,
Shuo Yanga,
Song Deng*a,
Qiu Lia,
Xiaopeng Yana,
Mingguo Penga,
Ming Quc,
Xinyu Lid,
Jiaming Xud and
Erlong Yange
aSchool of Petroleum and Natural Gas Engineering, School of Energy, Changzhou University, Changzhou, 213164, China. E-mail: dengsong@cczu.edu.cn; Tel: +86 15261180955
bCNPC Engineering Technology Research and Development Co. Ltd, Beijing, 100083, China
cSanya Offshore Oil & Gas Research Institute, Northeast Petroleum University, Sangya, 572024, China
dChina Yangtze Power Co. Ltd, Yichang, 443000, China
eSchool of Petroleum Engineering, Northeast Petroleum University, Daqing, 163318, China
First published on 31st January 2024
Abstract
Environmental awareness is receiving increasing attention in the petroleum industry, especially when associated with chemical agents applied in enhanced oil recovery (EOR) technology. The bio-based surfactant sodium cocoyl alaninate (SCA) is environmentally friendly and can be easily biodegraded, which makes it a promising alternative to traditional surfactants. Herein, the SCA surfactant is proposed as a foaming agent for enhanced oil recovery. Laboratory investigations on the surfactant concentration, foaming performance, microbubble characterization, interfacial tension, and foam-flooding of the traditional surfactants SDS and OP-10 have been conducted. In particular, the anti-salt abilities of these three surfactants have been studied, taking into consideration the reservoir conditions at Bohai Bay Basin, China. The results show that concentrations of 0.20 wt%, 0.20 wt% and 0.50 wt% for SCA, SDS and OP-10, respectively, can achieve optimum foaming ability and foaming stability under formation salinity conditions, and 0.20 wt% SCA achieved the best foaming ability and stability compared to 0.20 wt% SDS and 0.50 wt% OP-10. Sodium fatty acid groups and amino acid groups present in the SCA molecular structure have high surface activities under different salinity conditions, making SCA an excellent anti-salt surfactant for enhanced oil recovery. The microstructure analysis results showed that most of the SCA bubbles were smaller in size, with an average diameter of about 150 μm, and the distribution of SCA bubbles was more uniform, which can reduce the risk of foam coalescence and breakdown. The IFT value of the SCA/oil system was measured to be 0.157 mN m−1 at 101.5 °C, which was the lowest. A lower IFT can make liquid molecules more evenly distributed on the surface, and enhance the elasticity of the foam film. Core-flooding experimental results showed that a 0.30 PV SCA foam and secondary waterflooding can enhance oil recovery by more than 15% after primary waterflooding, which can reduce the mobility ratio from 3.7711 to 1.0211. The more viscous SCA foam caused a greater flow resistance, and effectively reduced the successive water fingering, leading to a more stable driving process to fully displace the remaining oil within the porous media. The bio-based surfactant SCA proposed in this paper has the potential for application in enhanced oil recovery in similar high-salt oil reservoirs.
1. Introduction
It is estimated that the global demand for energy in 2040 will be 1.3 times higher than that was in 2010, and oil consumption will increase to 111.1 million barrels per day.1,2 Faced with more and more depleted oil reservoirs, using surfactants to enhance oil recovery is a reliable method. Surfactants in oil reservoirs can reduce the surface tension of displacement agents, improve the wettability of the rock, and increase the displacement efficiencey for the crude oil.3 However, in oil reservoirs with high salinity, the structure, solubility and aggregation behavior at the gas–liquid interface of traditional surfactants will change, which will also affect the performance of the foam and reduce the production of the remaining oil from the reservoirs.Traditional foam flooding technology has been extensively studied. Zhang et al. fabricated fourteen alkyl sulfonated fluorobetaines with sodium dodecyl sulfate (SDS) and obtained good foam stability. Compared to a single foam system, the constructed foam system improved the oil displacement efficiency by 4–6%. Subsequent research focused on improving foam stability with nanoparticles.4 Gu et al. used nano-SiO2 particles to improve the stability of SDS foam. The experimental results showed that the addition of SiO2 increased the overall oil recovery to over 62%, which was higher than that achieved by SDS-foam flooding and water flooding.5 Rezaee et al. used fly ash nanoparticles extracted from industrial waste to improve the foam stability of the C19H42BrN (CTAB) surfactant. The experiment showed that fly ash nanoparticles can reduce the interfacial tension between oil and water and improve oil recovery.6 However, there are certain problems with foam flooding technology, which limit its large-scale applications. Most of the surfactants extracted from petroleum are toxic, expensive, difficult to biodegrade, and harmful to the environment.7 Therefore, there is an urgent need to develop new high-efficiency and pollution-free surfactants suitable for the high-salt reservoirs.
Surfactants synthesized from renewable plants (leaves, flowers, roots of trees) or animals can be called bio-based surfactants.8 Although they also have a certain degree of toxicity, they are easily biodegradable as compared with traditional surfactants. The classification of bio-based surfactants is consistent with that of traditional surfactants, and they are usually classified according to their charge. They are divided into four types: anionic, cationic, amphoteric and non-ionic. The head of an anionic surfactant carries a negative charge, the cationic carries a positive charge, the polar head group of the amphoteric ion carries both positive and negative charges at the same time, resulting in a net charge of zero, while the non-ionic does not produce ions when dissolved in water. Because researchers have found that bio-based surfactants have an aromatic and ionic nature,9,10 further studies need to be conducted to determine whether bio-based surfactants can be used as displacement agents to enhance oil recovery. Anionic bio-based surfactants extracted or synthesized from plants have been proven to have good surface activity and have the potential to improve oil recovery.11–17 Moreover, plant-based anionic bio-based surfactants have become a research hotspot for enhanced oil recovery with the replacement of traditional surfactants.18–21
Many bio-based surfactants extracted from plants will precipitate at high temperatures and under high salinity conditions. However, the bio-based surfactant sodium methyl ester sulfonate extracted or synthesized from jatropha oil has been proven to have thermal stability and is brine (NaCl) tolerant up to 8.00 wt%, with an optimum salinity of 3.20 wt% and hardness tolerance.22–25 The methyl ester sulfonate surfactant extracted from palm oil has also been proven to have good thermal stability and can withstand brine containing Ca2+ and Mg2+.26 N-lauroyl-L-lysine extracted from lysine, with a critical micelle concentration (CMC) of 0.4, can alter rock wettability in high salinity brine, reduce IFT by more than 40%, and has a recovery factor of about 29.61%.27,28 Alkyl polyglucoside sodium hydroxypropyl sulfonate extracted from glucoside is effective in combination with cationic surfactant for application in low-permeability reservoirs and can maintain ultra-low IFT and low CMC.29 Some other bio-based surfactants have also been proven to be less affected by high temperature and high salinity.30–34
However, there are few studies on amino acids and their derivatives as recovery rate enhancers.35–41 It has been reported that N-lauryl sarcosine and lauryl glutamic acid are both amino acid surfactants and exhibit relatively high resistance to salinity. It is worth noting that the resistance to salinity of N-lauroyl sarcosine is not affected by its concentration, while lauroyl glutamic acid only exhibits resistance to salinity when it is below CMC.42 Sodium cocoyl alaninate (SCA), derived from alanine and coconut fatty acid, has been proven to be superior to SDS in reducing interfacial tension and changing wettability. It still has good surfactant properties in 29.00 wt% NaCl solution, with a hydrophilic-lipophilic balance (HLB) value of 29.43,44 At the same time, further research has found that the oil recovery enhanced by SCA surfactant was 29.53%, while the oil recovery enhanced by SDS surfactant was 23.83%.45
Although some scholars have researched bio-based surfactants as displacement agents, few people have used them in foaming systems, or they have been used in foaming systems but few people have used them in high-salt oil reservoirs. Based on the high-salt condition of an oil reservoir located in the Bohai Bay Basin, China, the bio-based surfactant SCA has been proposed as the foam agent for enhanced oil recovery, and its foaming performance, anti-salt ability, microstructure, interfacial tension and EOR effect are all compared with the traditional surfactants of SDS and OP-10. The optimum concentrations of these three surfactants were first screened with the evaluation of foaming ability, foaming stability and the foaming comprehensive index. Then, the anti-salt abilities of these three surfactants were compared under different water salinity conditions (ranging from 5000 mg L−1 to 13![[thin space (1/6-em)]](https://www.rsc.org/images/entities/char_2009.gif) 000 mg L−1). During the microstructure characterization of microbubbles, an average diameter and a variable coefficient were defined to characterize the size and distribution of different microbubbles, respectively. The interfacial tensions between these three surfactants and formation oil were also compared to study the foaming ability and stability with the existence of formation oil and water. During the EOR effect investigation, foam flooding followed by secondary waterflooding was conducted after primary waterflooding using artificial cores, and different surfactants of SCA, SDS and OP-10 were also considered in the core-flooding experiments.
000 mg L−1). During the microstructure characterization of microbubbles, an average diameter and a variable coefficient were defined to characterize the size and distribution of different microbubbles, respectively. The interfacial tensions between these three surfactants and formation oil were also compared to study the foaming ability and stability with the existence of formation oil and water. During the EOR effect investigation, foam flooding followed by secondary waterflooding was conducted after primary waterflooding using artificial cores, and different surfactants of SCA, SDS and OP-10 were also considered in the core-flooding experiments.
2. Experiments
2.1 Chemical reagents
Sodium cocoyl alaninate (SCA) with a purity of 90%, sodium dodecyl sulfate (SDS) with a purity of 90%, and emulsifier OP-10 (OP-10), also with a purity of 90%, which are all anionic surfactants, were used as foaming agents in this study, and were supplied by Shandong Youso, Co., LTD, China. Nitrogen with a purity of 99.99% was used as the gas phase in the foam system.The oil and water samples used in this study were collected from an oil reservoir located in Bohai Bay Basin, China. This reservoir is a low-permeability reservoir with an average permeability of 49.8 × 10⁻³ μm2. The formation pressure is 32.37 MPa, and the formation temperature is 101.5 °C. The formation oil in this block has a density of 0.8308 g cm−3 and a viscosity of 6.93 mPa s. The salinity of formation water ranged from 4981 mg L−1 to 12![[thin space (1/6-em)]](https://www.rsc.org/images/entities/char_2009.gif) 698 mg L−1, and the average salinity was 9096.4 mg L−1, which indicate that this reservoir is also a high-salt reservoir. The ion composition of the formation water is listed in Table 1.
698 mg L−1, and the average salinity was 9096.4 mg L−1, which indicate that this reservoir is also a high-salt reservoir. The ion composition of the formation water is listed in Table 1.
| Iron content (mg L−1) | Total salinity (mg L−1) | ||||||
|---|---|---|---|---|---|---|---|
| K+ + Na+ | Ca2+ | Mg2+ | CI− | SO42− | HCO3− | CO32− | |
| 2978.6 | 87.0 | 56.5 | 3357.2 | 195.5 | 2411.4 | 10.2 | 9096.5 |
2.2 Performance evaluation of different foaming systems
Three kinds of foaming systems were formed in the laboratory with the change of surfactants (SCA, SDS and OP-10). The foaming performances, including foaming ability, foaming stability, and foaming comprehensive index (FCI), were compared first. Considering the large range of salinity in this reservoir, the influence of salinity on foaming performances was also studied during the comparison. The microstructures of these three foaming systems were evaluated using a scanning electron microscope, and the interfacial tension (IFT) between these three surfactants and the crude oil was also measured to study its influence on foaming ability and stability.First, a concentration of 0.10 wt% SCA was mixed with 50 mL of formation water to form an SCA foaming agent. Then, the agent was stirred at a speed of 10![[thin space (1/6-em)]](https://www.rsc.org/images/entities/char_2009.gif) 000 rpm for 1 minute with a stirrer. The agent was then poured into a 500 mL graduated cylinder to measure the foaming volume (VF). The foaming volume can be used to represent the foaming ability. The higher the volume, the stronger the foaming ability. Then, the concentration of SCA was changed from 0.15 wt% to 0.30 wt% to form a series of SCA foaming systems, and the foaming volumes of the SCA system series were measured with the above procedures.
000 rpm for 1 minute with a stirrer. The agent was then poured into a 500 mL graduated cylinder to measure the foaming volume (VF). The foaming volume can be used to represent the foaming ability. The higher the volume, the stronger the foaming ability. Then, the concentration of SCA was changed from 0.15 wt% to 0.30 wt% to form a series of SCA foaming systems, and the foaming volumes of the SCA system series were measured with the above procedures.
Then, different concentrations (ranging from 0.10 wt% to 0.30 wt%) of SDS were mixed with brine to form a series of SDS foaming systems. Different concentrations (ranging from 0.20 wt% to 0.60 wt%) of OP-10 were mixed with brine to form an OP-10 foaming system series, and then the foaming volumes of the SDS system series and OP-10 system series were measured. The foaming abilities of these three surfactants under different concentrations were studied, with the comparison of foaming volumes.
![[thin space (1/6-em)]](https://www.rsc.org/images/entities/char_2009.gif) 000 mg L−1, 13
000 mg L−1, 13![[thin space (1/6-em)]](https://www.rsc.org/images/entities/char_2009.gif) 000 mg L−1. The detailed procedures are as follows.
000 mg L−1. The detailed procedures are as follows.First, the optimum concentration of SCA was mixed with 50 mL of formation water with a concentration of 5000 mg mL−1, stirred, and then poured into a 500 mL graduated cylinder to measure the foaming volume. Then, the cylinder was placed in the thermostat to measure the half-life. The FCI value was calculated according to the foaming volume and half-life. The salinity of brine was then changed from 7000 mg L−1 to 13![[thin space (1/6-em)]](https://www.rsc.org/images/entities/char_2009.gif) 000 mg L−1 to form an SCA system series. The anti-salt ability of SCA was evaluated using the foaming volume, half-life and FCI value.
000 mg L−1 to form an SCA system series. The anti-salt ability of SCA was evaluated using the foaming volume, half-life and FCI value.
The optimum concentration of SDS was mixed with different salinities (ranging from 5000 mg L−1 to 13![[thin space (1/6-em)]](https://www.rsc.org/images/entities/char_2009.gif) 000 mg L−1) of brine to form an SDS foaming system series, and the optimum concentration of OP-10 was mixed with different salinities (also ranging from 5000 mg L−1 to 13
000 mg L−1) of brine to form an SDS foaming system series, and the optimum concentration of OP-10 was mixed with different salinities (also ranging from 5000 mg L−1 to 13![[thin space (1/6-em)]](https://www.rsc.org/images/entities/char_2009.gif) 000 mg L−1) of brine to form an OP-10 foaming system series. The foaming volumes and half-lives were recorded, and the FCI values were calculated for the SDS foam series and the OP-10 foam series. Finally, the salt resistance abilities of these three surfactants were compared via the different performances of foaming volume, foaming stability and FCI value.
000 mg L−1) of brine to form an OP-10 foaming system series. The foaming volumes and half-lives were recorded, and the FCI values were calculated for the SDS foam series and the OP-10 foam series. Finally, the salt resistance abilities of these three surfactants were compared via the different performances of foaming volume, foaming stability and FCI value.
![[thin space (1/6-em)]](https://www.rsc.org/images/entities/char_2009.gif) 000 mg L−1) of brine, respectively. The foaming agents were then poured into a Petri dish after stirring. The dish was placed under the electron microscope, and 300 times magnification was selected to obtain the SEM image of the foam system. The diameter (di) of each microbubble in the image was measured using the SEM image, and the average diameter (
000 mg L−1) of brine, respectively. The foaming agents were then poured into a Petri dish after stirring. The dish was placed under the electron microscope, and 300 times magnification was selected to obtain the SEM image of the foam system. The diameter (di) of each microbubble in the image was measured using the SEM image, and the average diameter (![[d with combining macron]](https://www.rsc.org/images/entities/i_char_0064_0304.gif) ) of the foam system was calculated as follows:
) of the foam system was calculated as follows:
 | (1) |
The standard deviation σd of diameters for different microbubbles in one foam system was calculated as follows:
 | (2) |
The variable coefficient (Cv) of the microbubble diameters was calculated as follows:
Cv = σd/![[d with combining macron]](https://www.rsc.org/images/entities/i_char_0064_0304.gif)
| (3) |
According to Afifi et al.,52 the foaming stability can be reflected by the diameter of the microbubbles. In general, if the microbubbles' diameters are more uniform in distribution, a more stable foam will be formed. The Cv value proposed above can be used to reflect the diameters' distribution for the microbubbles. The lower the Cv value, the more uniform the microbubble distribution, and the foam system is more stable.
The microstructures of the SCA, SDS and OP-10 foaming systems were first scanned in the laboratory, and then the microbubble distributions for these three systems were compared using the Cv value. The effects of salinity on microbubble distributions for the SCA foam were also studied with the comparison of the Cv value.
First, 10 mL of SDS, OP-10 and SCA solutions were prepared with the optimum concentration, respectively. The temperature of the interfacial tensiometer was set as 101.5 °C. After the tensiometer warmed up, the measuring tube was filled with the SCA solution, then an oil droplet was dropped into the measuring tube using a micro syringe. The tube was rotated at a speed of 5000 rpm for 30 min, and then the IFT value of the SCA/oil system was recorded automatically by a camera device. The liquid was changed to SDS and OP-10 solutions, and the procedures above repeated, and then the IFT values of SDS/oil system and OP-10/oil system were also determined.
2.3 Oil displacement experiments using different foaming systems
To compare the oil displacement effects of different foaming systems, core flooding experiments were conducted in the laboratory. Artificial cores with a size of 30 × 4.5 × 4.5 cm3 were used in the experiments. The average permeability of the core was 48.28 × 10⁻³ μm2, and the average porosity was 17.43%. Detailed physical parameters of the cores are listed in Table 2. The formation oil used in the displacement experiments is as mentioned above with a density of 0.83 g cm−3 and a viscosity of 7.00 mPa s, and the water had a salinity of 9000 mg L−1. The detailed experimental procedures are as follows.| No. | Apparent volume (mL) | Pore volume (mL) | Saturated oil volume (mL) | Porosity (%) | Permeability (mD) | Oil saturation (%) |
|---|---|---|---|---|---|---|
| 1 | 600.42 | 98.59 | 64.18 | 16.42 | 44.63 | 65.10 |
| 2 | 614.33 | 113.10 | 75.73 | 18.41 | 51.62 | 66.96 |
| 3 | 610.31 | 106.62 | 69.93 | 17.47 | 48.59 | 65.59 |
(1) The artificial core was put into a core holder and then vacuumed. The core was then saturated with formation water, and the porosity of the core can be calculated as a ratio of saturated water volume to apparent volume. (2) The formation water was injected into the core with the different injection rates of 0.10 mL min−1, 0.20 mL min−1 and 0.30 mL min−1, respectively, and the differential pressure between the inlet and outlet was recorded during the injection. The average permeability of the core was determined using Darcy's Law. (3) The core holder was placed into a thermostat, and the outlet of the core was connected to a backpressure regulator (BPR). The experimental temperature was set at 101.5 °C, and the BPR pressure was set at the formation pressure of 32 MPa. (4) The core was then saturated with formation oil at a constant rate of 0.10 mL min−1. The oil saturation process was stopped when no water was produced from the outlet. The initial oil saturation can be calculated as a ratio of the produced water volume to the pore volume. (5) Primary waterflooding was first conducted in this core with an injection rate of 0.30 mL min−1. When the water cut reached 98%, the primary water flooding was stopped. (6) Then, foam flooding was conducted after primary water flooding. Here, 0.025 PV of N2 and 0.025 PV of SCA solutions (under the optimum concentration) were injected alternatively into the core with the same rate of 0.30 mL min−1 (reservoir condition, RC), and the total injection volume was 0.30 PV. (7) Then, secondary water flooding was conducted after the foam flooding. The injection rate of water was set at 0.30 mL min−1. When the water cut reached 98% again, the secondary water flooding was stopped. The produced oil, water, gas and the differential pressure between the inlet and the outlet were recorded during the entire experiment. The oil recovery enhanced by the SCA foam could finally be determined. (8) The foaming system was changed to SDS foam and OP-10 foam (both with the optimum concentrations), and primary waterflooding + foam flooding + secondary waterflooding was also conducted using the other two cores. The experimental procedures were the same as mentioned above. After the oil recovery enhanced by SDS foam and OP-10 foam were determined, they were compared with the recovery enhanced by SCA foam. The dynamic production performances including oil, water, gas production and differential pressure were also compared to analyze the EOR mechanisms of different foaming systems.
3. Results and discussion
3.1 Performance comparison of different foaming systems
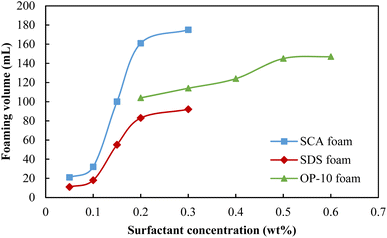
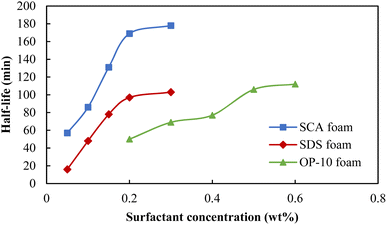
The foaming performances are key factors for enhanced oil recovery using foam flooding, and the surfactants that can achieve better foaming ability and stability are usually selected as the foaming systems. The optimum concentrations of surfactants SCA, SDS and OP-10 were first studied via the comparison of foaming volume, half-life and the foaming comprehensive index (FCI). The foaming volumes of these three surfactants are shown in Fig. 1. The foaming volumes all showed increasing trends with the increase in surfactant concentration. For the SCA foam and SDS foam, their foaming volumes both increased sharply when the concentrations exceeded 0.10 wt%, and then increased gently when the concentrations reached 0.20 wt%. However, the foaming volume of SCA foam is much higher than that of the SDS foam. The volume foamed by 0.20 wt% SCA was almost 2 times that of the 0.20 wt% SDS, and the SCA surfactant had a better foaming ability. For the OP-10 foam, its foaming volume increased gradually when the concentration increased from 0.20 wt% to 0.50 wt% and then increased gently when it exceeded 0.50 wt%. Although OP-10 has a better foaming ability as compared with SDS, it is still weaker than SCA. Moreover, the optimum OP-10 concentration of 0.50 wt% is much higher than the optimum SCA concentration of 0.20 wt%, which indicates that SCA can realize a better foaming ability with a smaller usage.The half-lives of these three surfactants are shown in Fig. 2, and they also show increasing trends with the increases in concentrations. For the SCA foam and SDS foam, their half-lives both increased sharply when the concentrations were less than or equal to 0.20 wt%, and then increased gently when the concentrations exceeded 0.20 wt%. The half-life of the 0.20 wt% SCA foam is 1.74 times that of the 0.20 wt% SDS, and the SCA surfactant has better foaming stability. For the OP-10 foam, its half-life increased gradually when the concentration increased from 0.20 wt% to 0.50 wt% and then increased gently when it exceeded 0.50 wt%. The stability of the 0.50 wt% OP-10 foam is similar to the 0.20 wt% SDS foam, both of which are much lower than the stability of the 0.20 wt% SCA foam.
Fig. 3 compares the foaming comprehensive index (FCI) of these three surfactants at different concentrations. Because SCA has the best foaming volume and half-life when its concentration reaches 0.20 wt%, it achieved the highest FCI value as compared with the other two surfactants. Here, 0.50 wt% OP-10 achieved the second-highest FCI value because it has a relatively better foaming ability as compared with 0.20 wt% SDS. The 0.20 wt% SDS had the poorest foaming ability and stability, so its FCI value was the lowest among these three surfactants. Because an inflection point is shown when the concentration is 0.20 wt%, 0.50 wt% and 0.20 wt% for the SCA, OP-10 and SDS, respectively, the optimum concentrations of these three surfactants were selected as 0.20 wt%, 0.50 wt% and 0.20 wt% for the following experiments.
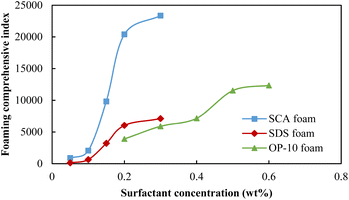 | ||
| Fig. 3 The foaming comprehensive index of different foaming systems at different surfactant concentrations. | ||
The foaming volumes affected by the formation salinity for different foaming systems are shown in Fig. 4. For these three systems, the foaming volumes all showed downward trends with the increase in salinity. For the 0.20 wt% SDS foam, the foaming volume was relatively better at a salinity of 5000 mg L−1 but then decreased sharply when the salinity exceeded 7000 mg L−1. Its foaming ability is weaker as compared to SCA and OP-10 under different salinities. Similar foaming abilities were observed for 0.20 wt% SCA and 0.50 wt% OP-10 with much higher foaming volumes. For the OP-10 foam, the foaming volume at the salinity of 5000 mg L−1 was even higher than the SCA foam but then decreased sharply when the salinity was equal to or more than 7000 mg L−1. For the SCA foam, it showed the best foaming ability when the salinity was equal to or more than 7000 mg L−1.
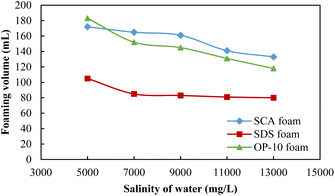 | ||
| Fig. 4 The foaming volumes of different foaming systems under different salinities of formation water. | ||
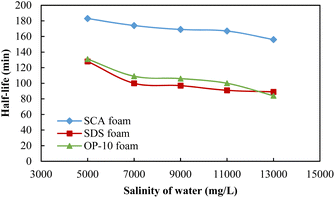
The foaming half-lives affected by the formation salinity for different foaming systems are shown in Fig. 5. The half-lives also showed downward trends with the increase in salinity; 0.20 wt% SDS and 0.50 wt% OP-10 have similar foaming stabilities with similar values of half-lives, which are much lower than that of the 0.20 wt% SCA. The foaming stability of 0.20 wt% SCA is always the best under different formation salinities, which indicates that SCA is a strong anti-salt surfactant.
The foaming comprehensive index (FCI) affected by the formation salinity for different foaming systems is shown in Fig. 6. Because of the lowest foaming volume and half-life of the 0.20 wt% SDS foam, the FCI values are the lowest among these three foams under different salinity conditions. The quality of the 0.50 wt% OP-10 foam is between the SDS foam and SCA foam because it has a better foaming ability as compared with SDS under different salinity conditions. The 0.20 wt% SCA foam achieved the highest FCI value among these three foams because it has both an excellent foaming ability and the best foaming stability under different salinity conditions.
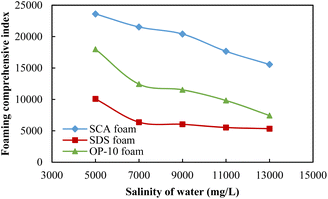 | ||
| Fig. 6 The foaming comprehensive index of different foaming systems under different salinities of formation water. | ||
The molecular structural formulas of SCA, SDS, and OP-10 surfactants are shown in Fig. 7. Sodium fatty acid groups (–COONa) exist in the hydrophobic portion of the SCA surfactant, which have proved that they can retain high surface activities at fairly high salinities. Moreover, the SCA surfactant contains amino acid groups (–COONH), which have properties of good solubility and stability. These amino acid groups can also maintain good surface activities at high-salt conditions. The sodium fatty acid groups and the amino acid groups both enhanced the anti-salt ability of the SCA surfactant (Fig. 7a). However, the OP-10 and SDS surfactants lack sodium fatty acid groups and amino acid groups (Fig. 7b and c), and cannot perform better in high-salt conditions. The outstanding anti-salt ability of the SCA surfactant makes it suitable for foam flooding in high-salt oil reservoirs.42
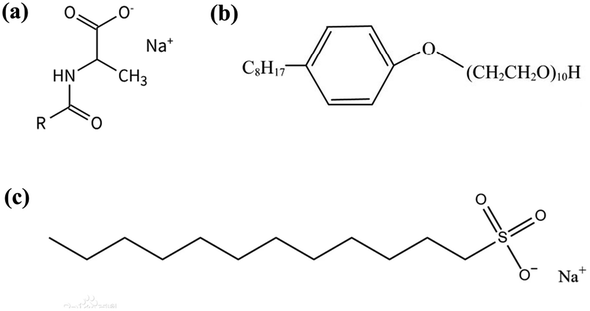 | ||
| Fig. 7 The molecular structural formulas of three kinds of surfactant. (a) SCA, (b)SDS, (c) OP-10 (ref. 42). | ||
3.2 The analysis of the microstructures of different foaming systems
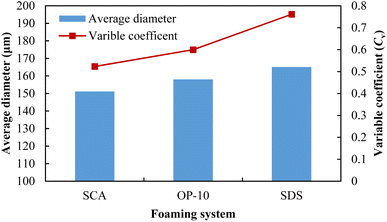
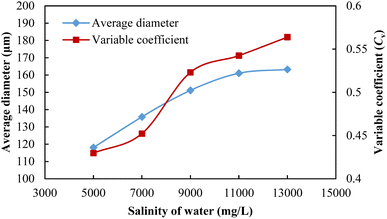
After a macro-comparison of the foaming performances of these three foaming systems, a micro-comparison was then conducted using SEM scanning. The salinity of formation water was set at 9000 mg L−1, and the microstructures of the 0.20 wt% SCA foam, 0.50 wt% OP-10 foam and 0.20 wt% SDS foam are shown in Fig. 8. The microbubbles of these three foaming systems are all ununiform with a salinity of 9000 mg L−1, however, differences in size distributions could still be observed after comparison. For the SCA foam, although the large sizes of microbubbles can be observed in the image, most of the bubbles were distributed in small sizes. For the OP-10 foam, the proportion of large bubbles was higher than that of the SCA foam. For the SDS foam, the large bubbles were more abundant in the distribution, and their boundaries are usually polygonal.The average diameters and the variable coefficients (calculated from eqn (3)) of the microbubbles for these three foaming systems are shown in Fig. 9. The average diameters of SCA bubbles, OP-10 bubbles and SDS bubbles are 151.1 μm, 158.0 μm and 165.1 μm, respectively. The SCA foam has the smallest average microbubble diameter. For a foaming system, smaller spherical bubbles can usually form a high-quality foaming system.52 Thus, the foaming quality of the SCA surfactant is better than the OP-10 and SDS. The Cv values of the SCA bubbles, OP-10 bubbles and SDS bubbles were 0.5231, 0.5996 and 0.7611, respectively. The SCA foam also achieved the lowest variable coefficient in microbubble distribution. Foam is usually a thermodynamically unstable system after its generation, The uneven distribution of microbubbles will cause differential pressures between them. For one foaming system, if the pressure inside the small bubbles is greater than the pressure inside the larger bubbles, it would cause the gas to spread from the smaller bubbles to the larger bubbles. The bigger the size difference between small and large bubbles, the greater the differential pressure, and the more unstable the foaming system.53 The variable coefficient of SCA foam is the smallest, indicating that it is relatively more uniform in microbubble distribution as compared with OP-10 and SDS. The differential pressures between small and large bubbles are relatively lower, which will cause a lower spreading rate of the gas phase. As a result, the SCA bubbles will not easily coalesce and break down. Thus, the SCA foam is a more stable system as compared with the OP-10 foam and SDS foam at a salinity of 9000 mg L−1.
The microstructures of SCA foam with different salinities of formation water are shown in Fig. 10. On the one hand, the microbubble diameter grows with the increase in water salinity, and the foaming quality gets worse. On the other hand, the bubble distribution is also increasingly uneven as the salinity increases. The average diameters and the variable coefficients of SCA microbubbles in water with different salinities are shown in Fig. 11. The average diameter of SCA bubbles increased gradually from 133.8 μm to 182.5 μm when the salinity increased from 5000 mg L−1 to 11![[thin space (1/6-em)]](https://www.rsc.org/images/entities/char_2009.gif) 000 mg L−1, and then increased gently when the salinity exceeded 11
000 mg L−1, and then increased gently when the salinity exceeded 11![[thin space (1/6-em)]](https://www.rsc.org/images/entities/char_2009.gif) 000 mg L−1. The Cv value also increased with the salinity of water, however, it was much less when the salinity was less than or equal to 7000 mg L−1. Fig. 10a and b show that the microbubbles are smaller and relatively more uniform. When the salinity reached 9000 mg L−1 as shown in Fig. 10c, the heterogeneity of the microbubbles became obvious and then got worse with the continued increase in salinity (Fig. 10d and e). The increasingly uneven trend in size distribution will cause higher differential pressures, and then induce an easier coalescence of bubbles. Moreover, the presence of salt ions supplied by formation water will decrease the surface potential on the gas–liquid interfaces, and thus decrease the double layer repulsion. This reduction will promote liquid drainage from the bubble lamella.54 With the easier coalescence and liquid drainage, the foaming stability will become worse as the water salinity increases.
000 mg L−1. The Cv value also increased with the salinity of water, however, it was much less when the salinity was less than or equal to 7000 mg L−1. Fig. 10a and b show that the microbubbles are smaller and relatively more uniform. When the salinity reached 9000 mg L−1 as shown in Fig. 10c, the heterogeneity of the microbubbles became obvious and then got worse with the continued increase in salinity (Fig. 10d and e). The increasingly uneven trend in size distribution will cause higher differential pressures, and then induce an easier coalescence of bubbles. Moreover, the presence of salt ions supplied by formation water will decrease the surface potential on the gas–liquid interfaces, and thus decrease the double layer repulsion. This reduction will promote liquid drainage from the bubble lamella.54 With the easier coalescence and liquid drainage, the foaming stability will become worse as the water salinity increases.
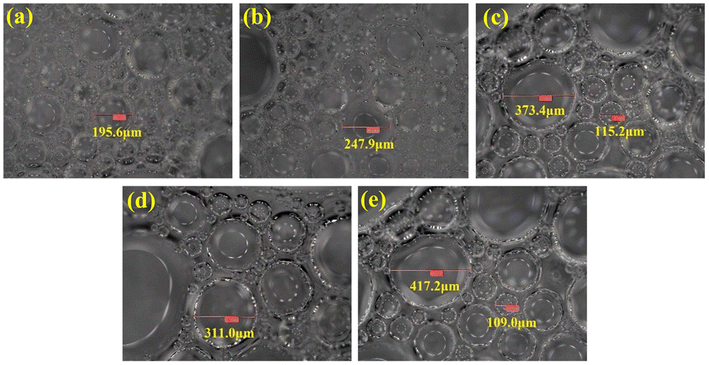 | ||
Fig. 10 SEM images of SCA foam in water of different salinites. (a) 5000 mg L−1, (b) 7000 mg L−1, (c) 9000 mg L−1, (d) 11![[thin space (1/6-em)]](https://www.rsc.org/images/entities/char_2009.gif) 000 mg L−1, (e) 13 000 mg L−1, (e) 13![[thin space (1/6-em)]](https://www.rsc.org/images/entities/char_2009.gif) 000 mg L−1. 000 mg L−1. | ||
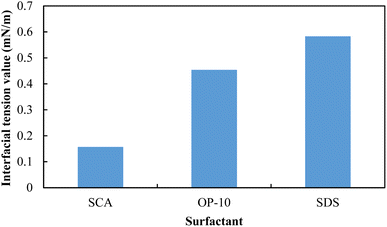
To further reveal the foaming ability and stability with the existence of formation oil and water, the interfacial tensions (IFT) between SCA, OP-10, SDS solutions and the formation oil, respectively, were then measured in the laboratory, and the results are shown in Fig. 12. The 0.20 wt% SCA, 0.50 wt% OP-10 and 0.20 wt% SDS can all reduce the IFT value to the order of 10−1 mN m−1, and 0.20 wt% SCA achieved the lowest IFT value among these three surfactants. The IFT value of the SCA/oil system is 0.157 mN m−1, which is 0.35 times that of the OP-10/oil system, and 0.27 times that of the SDS/oil system. On the one hand, a lower interfacial tension usually leads to a better foaming ability, and the lowest IFT value of the SCA/oil system makes the SCA the best foaming agent in the presence of formation oil and water. On the other hand, a lower interfacial tension can cause the liquid molecules to be more evenly distributed on the surface, and then enhance the elasticity of the foam film. This elasticity enables the film to better withstand the pressure changes between the inside and outside of the microbubble and then reduces the risk of foam coalescence and breakdown.55 The 0.20 wt% SCA achieved the lowest IFT value and as a result, it can form the most stable foam among these three surfactants with the existence of formation oil and water.
3.3 EOR effects using different foaming systems
After the macro- and micro-evaluations of different foaming systems, the EOR effects of SDS, OP-10 and SCA foams were then studied using core flooding experiments in the laboratory. The concentrations of the SDS, OP-10 and SCA surfactants were 0.20 wt%, 0.50 wt% and 0.20 wt%, respectively, and the salinity of formation was set at 9000 mg L−1 to simulate the high-salt oil reservoir. The experimental results are shown in Fig. 13. After a primary waterflooding with an injection volume of 1.60 PV-1.70 PV, a similar oil recovery factor was obtained with 44.97–46.64%, which indicated that a similar remaining oil saturation was achieved in different cores. After the injection of 0.30 PV foam followed by secondary waterflooding, the oil recoveries enhanced by SDS, OP-10 and SCA foams were 8.27%, 11.49% and 15.09%, respectively. The best oil recovery was achieved by SCA foam, with an increment of 6.82% higher than that of SDS foam and 3.6% higher than that of OP-10 foam. The SCA also achieved the highest ultimate oil recovery of more than 60% under this high-salt condition (Fig. 13a).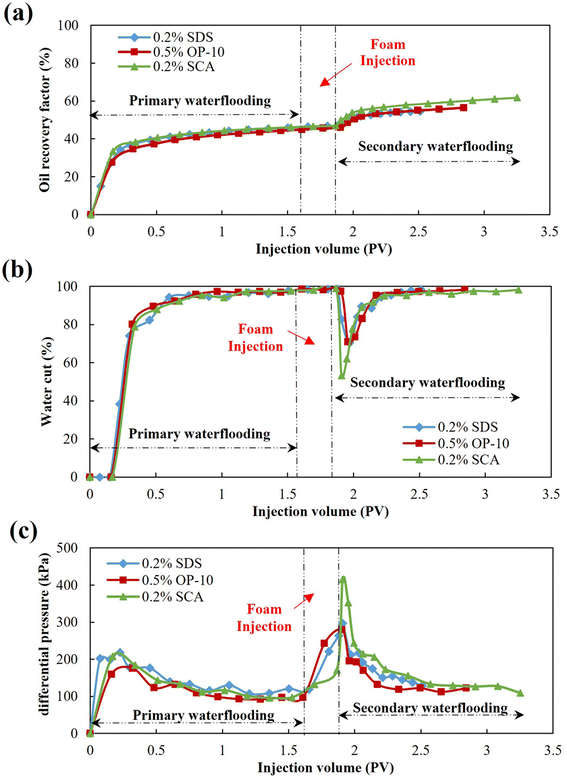 | ||
| Fig. 13 Dynamics curves of foam flooding using different foaming systems. (a) Oil recovery factor curves, (b) water cut curves, (c) differential pressure curves. | ||
Fig. 13b shows the changes in the water cut of different foaming systems. After the water cut reached 98% at the end of waterflooding, it was observed that the water cut did not drop immediately at the initial stage of foam injection. On the contrary, it increased continually to more than 98% until the end of the foam injection. The injected foam mainly displaces the water in large pores and throats and then remains in the large pores and throats for plugging. Due to the lower viscosity of water as compared with foam, the successive water is then diverted to the small pores and throats to displace the remaining oil. As a result, the water cut drops immediately in the initial stage of secondary waterflooding. The water cut of SDS foam and OP-10 foam dropped to around 70%, however, the water cut of SCA foam dropped to as low as 53.31%, which means that more oil was displaced by the successive water after SCA foam plugging. Moreover, the effective period of secondary waterflooding was at 1.25 PV after SCA foam injection, which is 2.23 times that of SDS foam, and 1.34 times that of OP-10 foam. The SCA foam not only achieved the best plugging performance with the lowest water cut, but it also achieved the best foaming stability with the longest effective period.
Fig. 13c shows the differential pressure of different foaming systems. During the primary waterflooding, the differential pressure first increased to 150 kPa–200 kPa to fully start the oil in the core and then dropped gradually to about 100 kPa when water channels formed in the porous media. The differential pressure increased gradually after the foaming system was injected, and then reached the maximum at the initial stage of secondary waterflooding. The pressure was the highest after the SCA foam injection, which was about 1.4 times that of SDS foam and OP-10 foam. It also illustrated that the SCA foam achieved the best plugging effect as compared with the other two foams. The SCA foam also achieved the highest differential pressure in the subsequent period of secondary waterflooding. The higher flow resistance achieved by SCA foam caused the successive water to displace more oil in the small pores and throats, which is beneficial for enhanced oil recovery.
The mobility ratio (Magent/oil) is defined as the ratio of the mobility of the displacing agent (λagent) to the mobility of the formation oil (λo). It has been proved that a lower mobility ratio could lead to better mobility control of the injecting agent, and then improve the sweeping area in the porous media, and finally achieve a better oil recovery.56 According to the mobility ratio calculation derived from Darcy's Law,57 it can be calculated as follows:
 | (4) |
The effective permeabilities (kagent and koil) are the functions of the absolute permeability (k) of the core and the relative permeabilities of agent and oil (kr-agent, kr-oil), and the relationships are as follows:
| kagent = k·kr-agent(Sor),koil = k·kr-oil(Swc) | (5) |
The mobility ratio can be calculated as follows:
 | (6) |
The kr-water(Sor) value and kr-oil(Swc) value are obtained from the relative permeability curves of water and oil, which were provided by CNPC Engineering Technology Research and Development Company Limited, where kr-water(Sor) = 0.3031 and kr-oil(Swc) = 1. Taking the assumption that the surfactants would not affect the relative permeabilities of water and oil, then kr-SCA(Sor) = kr-SCA(Sor) = kr-OP-10(Sor) = kr-SDS(Sor) = kr-water(Sor) = 0.3031, and kr-oil(Swc) = 1 at different conditions. The viscosities of formation water (μwater), SCA foam (μSCA), OP-10 foam (μOP-10) and SDS foam (μSDS) were measured at 101.5 °C in the laboratory, and then the mobility ratios of different foaming agents were calculated as shown in Table 3.
| No. | Before foam flooding | After foam flooding | ||||
|---|---|---|---|---|---|---|
| Water viscosity (mPa s) | Oil viscosity (mPa s) | Mobility ratio | Agent viscosity (mPa s) | Oil viscosity (mPa s) | Mobility ratio | |
| a Where: kr-SCA(Sor) = kr-SCA(Sor) = kr-OP-10(Sor) = kr-SDS(Sor) = kr-water(Sor) = 0.3031, kr-oil(Swc) = 1. | ||||||
| Core 1 with SDS foam flooding | 0.577 | 6.93 | 3.7711 | 1.242 | 6.93 | 1.7308 |
| Core 2 with OP-10 foam flooding | 1.406 | 1.4939 | ||||
| Core 3 with SCA foam flooding | 2.057 | 1.0211 | ||||
The calculation results show that the mobility ratio of water to oil (Mwater/oil) was as high as 3.7711 before foam injection. This high mobility ratio causes water to flow unevenly within the porous media, which is mostly due to the obvious viscosity difference between injecting water and oil. This viscosity difference will cause water fingering near the outlet, leaving plenty of crude oil in the core. The injected foams can lower the viscosity difference, and thus reduce the mobility ratio between agents and oil. The SDS foam reduces the mobility ratio to 1.7308, which is 0.46 times that of Mwater/oil. The OP-10 foam reduces the mobility ratio to 1.4939, which is 0.40 times that of Mwater/oil. The SCA foam achieved the lowest mobility ratio of 1.0211, which is only 0.27 times that of Mwater/oil. The higher viscous SCA foam not only causes a higher flow resistance within the porous media but also achieves better mobility control of the successive injecting water. After the SCA foam injection, the water fingering is effectively reduced, and a more stable driving process is formed to fully displace the remaining oil within the core. As a result, the SCA foam achieved the best oil recovery increment as compared with the SDS foam and the OP-10 foam. This SCA foam showed good foaming ability and stability and can realize excellent mobility control within the porous media, which has the potential for application in enhanced oil recovery in similar high-salt oil reservoirs.
4. Conclusion
A bio-based surfactant, sodium cocoyl alaninate (SCA), is proposed as the foaming agent for enhanced oil recovery in a high-salt oil reservoir. After the evaluation of the foaming performance and the EOR experiments compared with SDS and OP-10, some conclusions were made, which are summarized as follows.(1) The optimum concentrations of SCA, OP-10 and SDS surfactants were screened as 0.20 wt%, 0.20 wt% and 0.50 wt%, respectively, where the inflection points appeared at the foaming volume, foam half-time and FCI curves. The 0.20 wt% SCA has the best foaming ability and stability as compared with 0.20 wt% SDS and 0.50 wt% OP-10.
(2) The 0.20 wt% SCA also has the best anti-salt ability as compared with 0.20 wt% SDS and 0.50 wt% OP-10 at different water salinities. The sodium fatty acid groups and amino acid groups that existed in the microstructure of SCA can maintain high surface activities under high-salt conditions, making the SCA an excellent anti-salt surfactant for enhanced oil recovery.
(3) The microstructure analysis results showed that most of the SCA bubbles were smaller with an average diameter of about 150 μm, and the distribution of SCA bubbles was more uniform with a variable coefficient of 0.5231. The smaller size and more uniform distribution of microbubbles can reduce the risk of foam coalescence and breakdown, and then enhance the stability at high-salt conditions.
(4) The IFT value of the SCA/oil system was measured as 0.157 mN m−1 at 101.5 °C, which is 0.35 times that of the OP-10/oil system, and 0.27 times that of the SDS/oil system. The lower IFT can make liquid molecules more evenly distributed on the surface, enhance the elasticity of the film, and then form a more stable foam with the existence of formation oil and water.
(5) Core flooding experimental results showed that a 0.30 PV SCA foam + secondary waterflooding can enhance oil recovery by more than 15% after primary waterflooding, which is 1.83 times that of SDS foam and 1.31 times that of OP-10 foam. The SCA foam can reduce the mobility ratio from 3.7711 to 1.0211, the higher viscous SCA foam caused a greater flow resistance, and then effectively reduced the water fingering, leading to a more stable driving process to fully displace the remaining oil within the porous media.
Conflicts of interest
There are no conflicts to declare.Acknowledgements
This project is supported by Local Efficient Reform and Development Funds for Personnel Training Projects Supported by the Central Government (Study on Nanosystem Displacement Method of Tight Reservoir in Daqing Oilfield), National Key Research and Development Program of China (Grant no. 2022YFC2806403) and Scientific Research and Technology Development Project of CNPC, China (Grant no. 2021DJ1401). The authors wish to acknowledge all the colleagues from Changzhou University, CNPC Engineering Technology Research and Development Co. Ltd, Northeast Petroleum University, and China Yangtze Power Co. Ltd, who all helped with this research.References
- M. Karatayev, G. Movkebayeva and Z. Bimagambetova, Increasing utilisation of renewable energy sources: Comparative analysis of scenarios until 2050, Energy Security (Policy Challenges and Solutions for Resource Efficiency), 2019, ch. 3, pp. 37–68 Search PubMed.
- J. H. Zhang, H. Gao and Q. H. Xue, Potential applications of microbial enhanced oil recovery to heavy oil, Crit. Rev. Biotechnol., 2020, 40, 1–16 CrossRef PubMed.
- F. Hakiki, A. Aditya, D. T. Ulitha, M. Shidqi, W. S. Adi, K. H. Wibowo and M. Barus, Well and inflow performance relationship for heavy oil reservoir under heating treatment, SPE/IATMI Asia Pacific Oil & Gas Conference and Exhibition, Indonesia, 2017 Search PubMed.
- C. L. Zhang, P. Wang and G. L. Song, Study on enhanced oil recovery by multi-component foam flooding, J. Pet. Sci. Eng., 2019, 177, 181–187 CrossRef CAS.
- Z. H. Gu, T. Lu, Z. M. Li and Z. X. Xu, Experimental investigation on the SiO2 nanoparticle foam system characteristics and its advantages in the heavy oil reservoir development, J. Pet. Sci. Eng., 2022, 214, 10438 CrossRef.
- M. Rezaee, S. M. Hosseini-Nasab, J. Fahimpour and M. Sharifi, New insight on improving foam stability and foam flooding using fly-ash in the presence of crude oil, J. Pet. Sci. Eng., 2022, 214, 110534 CrossRef CAS.
- D. Y. Atta, B. M. Negash, N. Yekeen and A. D. Habte, A state-of-the-art review on the application of natural surfactants in enhanced oil recovery, J. Mol. Liq., 2021, 321, 114888 CrossRef CAS.
- K. Holmberg, Natural surfactants, Curr. Opin. Colloid Interface, 2001, 6, 148–159 CrossRef CAS.
- J. F. B. Pereira, R. Costa, N. Foios and J. A. P. Coutinho, Ionic liquid enhanced oil recovery in sand-pack columns, Fuel, 2014, 134, 196–200 CrossRef CAS.
- A. Z. Hezave, S. Dorostkar, S. Ayatollahi, M. Nabipour and B. Hemmateenejad, Dynamic interfacial tension behaviour between heavy crude oil and ionic liquid solution (1dodecyl-3-methylimidazolium chloride ([C12mim][Cl] + distilled or saline water/heavy crude oil)) as a new surfactant, J. Mol. Liq., 2013, 187, 83–89 CrossRef CAS.
- A. Kumar and A. Mandal, Synthesis and physiochemical characterization of zwitterionic surfactant for application in enhanced oil recovery, J. Mol. Liq., 2017, 243, 61–71 CrossRef CAS.
- S. Kumar, A. Kumar and A. Mandal, Characterizations of surfactant synthesized from Jatropha oil and its application in enhanced oil recovery, AIChE J., 2017, 63, 2731–2741 CrossRef CAS.
- N. Saxena, N. Pal, S. Dey and A. Mandal, Characterizations of surfactant synthesized from palm oil and its application in enhanced oil recovery, J. Taiwan Inst. Chem. Eng., 2017, 81, 343–355 CrossRef CAS.
- N. Pal, N. Saxena and A. Mandal, Phase behavior, solubilization, and phase transition of a microemulsion system stabilized by a novel surfactant synthesized from castor oil, J. Chem. Eng. Data, 2017, 62, 1278–1291 CrossRef CAS.
- N. Pal, N. Saxena, K. V. Laxmi and A. Mandal, Interfacial behaviour, wettability alteration and emulsification characteristics of a novel surfactant: implications for enhanced oil recovery, Chem. Eng. Sci., 2018, 187, 200–212 CrossRef CAS.
- N. Saxena, A. Goswami, P. Dhodapkar, M. C. Nihalani and A. Mandal, Bio-based surfactant for enhanced oil recovery: interfacial properties, emulsification and rock-fluid interactions, J. Pet. Sci. Eng., 2019, 176, 299–311 CrossRef CAS.
- N. Pal, S. Kumar, A. Bera and A. Mandal, Phase behaviour and characterization of microemulsion stabilized by a novel synthesized surfactant: implications for enhanced oil recovery, Fuel, 2019, 235, 995–1009 CrossRef CAS.
- S. Mujumdar, P. Joshi and N. Karve, Production, characterization, and applications of bio-emulsifiers (BE) and biosurfactants (BS) produced by Acinetobacter spp.: A review, J. Basic Microbiol., 2019, 59, 277–287 CrossRef CAS PubMed.
- R. Jahan, A. M. Bodratti, M. Tsianou and P. A. Biosurfactants, natural alternatives to synthetic surfactants: Physicochemical properties and applications, Adv. Colloid Interface Sci., 2019, 275, 102061 CrossRef PubMed.
- B. N. Tackie-Otoo, M. A. A. Mohammed, N. Yekeen and B. M. Negash, Alternative chemical agents for alkalis, surfactants and polymers for enhanced oil recovery: Research trend and prospects, J. Pet. Sci. Eng., 2019, 187, 106828 CrossRef.
- Z. Bachari, A. A. Isari, H. Mahmoudi, S. Moradi and E. H. Mahvelati, Application of natural surfactants for enhanced oil recovery – Critical review, IOP Conf. Ser., 2019, 221, 012039 Search PubMed.
- B. Sami, A. Azdarpour, B. Honarvar, M. Nabipour and A. Keshavarz, Application of a novel natural surfactant extracted from Avena Sativa for enhanced oil recovery during low salinity water flooding: Synergism of natural surfactant with different salts, J. Mol. Liq., 2022, 362, 119693 CrossRef CAS.
- S. Majidaie, M. Muhammad, I. M. Tan and B. Demiral, Green surfactant for enhanced oil recovery, 2011 National Postgraduate Conference, Malaysia, 2011 Search PubMed.
- S. Kumar, N. Saxena and A. Mandal, Synthesis and evaluation of physicochemical properties of anionic polymeric surfactant derived from Jatropha oil for application in enhanced oil recovery, J. Ind. Eng. Chem., 2016, 43, 106–116 CrossRef CAS.
- K. A. Elraies, I. M. Tan, M. Awang and I. Saaid, The synthesis and performance of sodium methyl ester sulfonate for enhanced oil recovery, Pet. Sci. Technol., 2010, 28, 1799–1806 CrossRef CAS.
- S. Mahendran, P. Siwayanan, N. A. Shafie, S. K. Subbiah and B. Azeem, Exploring the potential application of palm methyl ester sulfonate as an interfacial tension reducing surfactant for chemical enhanced oil recovery, Key Eng. Mater., 2019, 797, 402–410 Search PubMed.
- A. Rostami, A. Hashemi, M. A. Takassi and A. Zadehnazari, Rocks: Mechanistic and core displacement analysis surfactant for enhanced oil recovery in carbonate, J. Mol. Liq., 2017, 232, 310–318 CrossRef CAS.
- M. A. Takassi, A. Hashemi, A. Rostami and A. Zadehnazari, A lysine amino acid-based surfactant: Application in enhanced oil recovery, Pet. Sci. Technol., 2016, 34, 1521–1526 CrossRef CAS.
- G. R. Szilvay, T. Nakari-Setälä and M. B. Linder, The behaviour of Trichoderma reesei hydrophobins in solution: Interactions, dynamics, and multimer formation, Biochemistry, 2006, 45, 8590–8598 CrossRef CAS PubMed.
- K. Babu, N. Pal, A. Bera, V. K. Saxena and A. Mandal, Studies on interfacial tension and contact angle of synthesized surfactant and polymeric from castor oil for enhanced oil recovery, Appl. Surf. Sci., 2015, 353, 1126–1136 CrossRef CAS.
- N. Saxena, N. Pal, K. Ojha, S. Dey and A. Mandal, Synthesis, characterization, physical and thermodynamic properties of a novel anionic surfactant derived from Sapindus laurifolius, RSC Adv., 2018, 8, 24485–24499 RSC.
- A. M. Rabiu, S. Elias and O. Oyekola, Evaluation of surfactant synthesized from waste vegetable oil to enhance oil recovery from petroleum reservoirs, Energy Procedia, 2016, 100, 188–192 CrossRef CAS.
- S. Mohammed and S. S. Ikiensikimama, Vegetable oils as surfactant feedstocks for enhanced oil recovery: A review, Chem. Eng. Res. Des., 2023, 200, 693–705 CrossRef CAS.
- I. Nowrouzi, A. H. Mohammadi and A. K. Manshad, Primary evaluation of a synthesized surfactant from waste chicken fat as a renewable source for chemical slug injection into carbonate oil reservoirs, J. Mol. Liq., 2020, 306, 112843 CrossRef CAS.
- M. Madani, G. Zargar, M. A. Takassi, A. Daryasafar, D. A. Wood and Z. E. Zhang, Fundamental investigation of an environmentally-friendly surfactant agent for chemical enhanced oil recovery, Fuel, 2019, 238, 186–197 CrossRef CAS.
- H. F. Asl, G. Zargar, A. K. Manshad, M. A. Takassi, J. A. Ali and A. Keshavarz, Experimental investigation into l-Arg and l-Cys eco-friendly surfactants in enhanced oil recovery by considering IFT reduction and wettability alteration, Pet. Sci., 2020, 17, 105–117 CrossRef CAS.
- D. B. Tripathy, A. Mishra, J. Clark and T. Farmer, Synthesis, chemistry, physicochemical properties and industrial applications of amino acid surfactants: A review, C. R. Chim., 2018, 21(2), 112–130 CrossRef CAS.
- H. F. Asl, G. Zargar, A. K. Manshad, M. A. Takassi, J. A. Ali and A. Keshavarz, Effect of SiO2 nanoparticles on the performance of L-Arg and L-Cys surfactants for enhanced oil recovery in carbonate porous media, J. Mol. Liq., 2020, 300, 112290 CrossRef CAS.
- C. Rondel, I. Alric, Z. Mouloungui, J. Blanco and F. Silvestre, Synthesis and properties of lipoamino acid–fatty acid mixtures: influence of the amphiphilic structure, J. Surfactants Deterg., 2009, 12, 269–275 CrossRef CAS.
- B. N. Tackie-Otoo, M. A. A. Mohammed, J. Y. S. Tze and A. M. Hassan, Experimental investigation of N-lauroyl sarcosine and N-lauroyl-L-glutamic acid as green surfactants for enhanced oil recovery application, J. Mol. Liq., 2022, 362, 119738 CrossRef CAS.
- B. N. Tackie-Otoo and M. A. A. Mohammed, Experimental investigation of the behaviour of a novel amino acid-based surfactant relevant to EOR application, J. Mol. Liq., 2020, 316, 113848 CrossRef CAS.
- B. N. Tackie-Otoo, M. A. A. Mohammed and E. B. Owusu, Investigation of the enhanced oil recovery potential of sodium cocoyl alaninate: an eco-friendly surfactant, J. Pet. Explor. Prod. Technol., 2022, 12, 2785–2799 CrossRef CAS.
- S. A. Jones, V. van der Bent, R. Farajzadeh, W. R. Rossen and S. Vincent-Bonnieu, Surfactant screening for foam EOR: Correlation between bulk and core-flood experiments, Colloids Surf., A, 2016, 500, 166–176 CrossRef CAS.
- N. Nazari, H. Hosseini, J. S. Tsau, K. S. Shafer-Peltier, C. Marshall, Q. Ye and R. B. Ghahfarokhi, Development of highly stable lamella using polyelectrolyte complex nanoparticles: An environmentally friendly scCO2 foam injection method for CO2 utilization using EOR, Fuel, 2020, 261, 116360 CrossRef CAS.
- F. Guo and S. Aryana, An experimental investigation of nanoparticle-stabilized CO2 foam used in enhanced oil recovery, Fuel, 2016, 15, 430–442 CrossRef.
- A. Hassan, M. S. Azad and M. Mahmoud, An analysis of nitrogen EOR screening criteria parameters based on the up-to-date review, J. Pet. Sci. Eng., 2023, 220, 111123 CrossRef CAS.
- X. M. Liu, Z. Chen and Z. G. Cui, Synergistic effects between anionic and sulfobetaine surfactants for stabilization of foams tolerant to crude oil in foam flooding, J. Surfactants Deterg., 2021, 24, 683–696 CrossRef CAS.
- M. Zhou, J. C. Bu, J. Wang, X. Guo, J. Huang and M. Huang, Study on three phase foam for enhanced oil recovery in extra-low permeability reservoirs, Oil Gas Sci. Technol., 2018, 73, 55 CrossRef CAS.
- B. R. B. Fernandes, K. Sepehrnoori, M. Delshad and F. Marcondes, New fully implicit formulations for the multicomponent surfactant-polymer flooding reservoir simulation, Appl. Math. Model., 2022, 105, 751–799 CrossRef.
- X. M. Liu, Z. Chen and Z. G. Cui, Foaming systems for foam flooding with both high foaming performance and ultralow oil/water interfacial tension, J. Mol. Liq., 2022, 355, 118920 CrossRef CAS.
- E. Dressaire, R. Bee, D. C. Bell, A. Lips and H. A. Stone, Interfacial polygonal nanopatterning of stable microbubbles, Science, 2008, 320, 1198–1201 CrossRef CAS PubMed.
- H. R. Afifi, S. Mohammadi, A. M. Derazi, S. Moradi, F. M. Alemi, E. H. Mahvelati and K. F. H. Abad, A comprehensive review on critical affecting parameters on foam stability and recent advancements for foam-based EOR scenario, J. Mol. Liq., 2021, 340, 116808 CrossRef.
- J. C. Wang, Y. J. Cao, G. S. Li, L. J. Deng and S. L. Li, Effect of CTAB concentration on foam properties and discussion based on liquid content and bubble size in the foam, Int. J. Oil, Gas Coal Technol, 2018, 6, 18–24 CrossRef CAS.
- Q. P. Nguyen, W. R. Rossen, P. L. J. Zitha and P. K. Currie, Determination of gas trapping with foam using x-ray ct and effluent analysis, SPE J., 2005, 14, 222–236 CrossRef.
- J. P. Tao, C. L. Dai, W. L. Kang, G. Zhao, Y. F. Liu, J. C. Fang, M. W. Gao and Q. You, Experimental study on low interfacial tension foam for enhanced oil recovery in high-temperature and high-salinity reservoirs, Energy Fuels, 2017, 31(12), 13416–13426 CrossRef CAS.
- Z. B. Wu, H. Q. Liu, Z. X. Pang, C. Wu and M. Gao, Pore-scale experiment on blocking characteristics and EOR mechanisms of nitrogen foam for heavy oil: A 2D visualized study, Energy Fuels, 2016, 30(11), 9106–9113 CrossRef CAS.
- F. L. Zhao, H. D. Hao, J. R. Hou, L. B. Hou and Z. J. Song, CO2 mobility control and sweep efficiency improvement using starch gel or ethylenediamine in ultra-low permeability oil layers with different types of heterogeneity, J. Pet. Sci. Eng., 2015, 133, 52–65 CrossRef CAS.
| This journal is © The Royal Society of Chemistry 2024 |

