 Open Access Article
Adsorption of lead ions from wastewater using electrospun zeolite/MWCNT nanofibers: kinetics, thermodynamics and modeling study†
Urwa
Mahmood
 a,
Ali S.
Alkorbi
 bc,
Tanveer
Hussain
 a,
Ahsan
Nazir
 *ad,
Muhammad Bilal
Qadir
 *ae,
Zubair
Khaliq
 fe,
Sajid
Faheem
 a and
Mohammed
Jalalah
 bgh
bgh
aDepartment of Textile Engineering, National Textile University, Faisalabad 37610, Pakistan. E-mail: urwa93@hotmail.com; hussain.tanveer@gmail.com; msajidfaheem@gmail.com
bScience and Engineering Research Center, Najran University, Najran 11001, Saudi Arabia
cDepartment of Chemistry, Faculty of Science and Arts at Sharurah, Najran University, Sharurah 68342, Saudi Arabia. E-mail: assalem@nu.edu.sa
dLaboratoire de Physique et Mécanique Textiles (LPMT), Université de Haute-Alsace | UHA, Mulhouse, France. E-mail: ahsan@ntu.edu.pk
eDepartment of Organic and Nano Engineering, Hanyang University, Seoul 04763, South Korea. E-mail: zubntu@yahoo.com; bilal_ntu81@hotmail.com
fDepartment of Materials, National Textile University, Faisalabad, 37610, Pakistan
gDepartment of Electrical Engineering, College of Engineering, Najran University, Najran 11001, Saudi Arabia. E-mail: msjalalah@nu.edu.sa
hAdvanced Materials and Nano-Research Centre (AMNRC), Najran University, Najran 11001, Saudi Arabia
First published on 15th February 2024
Abstract
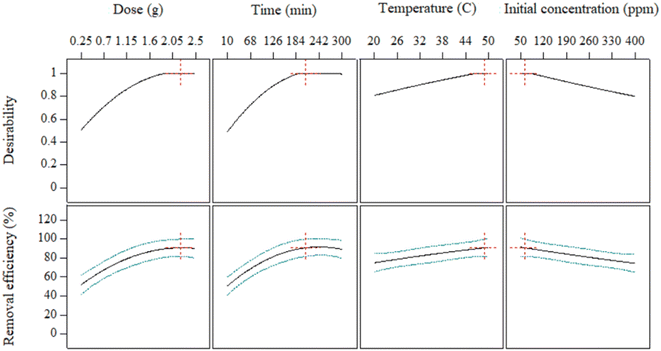
Heavy metal contamination in water is a serious environmental issue due to the toxicity of metals like lead. This study developed zeolite and multi-walled carbon nanotube (MWCNT) incorporated polyacrylonitrile (PAN) nanofibers via needleless electrospinning and examined their potential for lead ion adsorption from aqueous solutions. The adsorption process was optimized using response surface methodology (RSM) and artificial neural network (ANN) modeling approaches. The adsorbent displayed efficient lead removal of 84.75% under optimum conditions (adsorbent dose (2.21 g), adsorption time (207 min), temperature (48 °C), and initial concentration (62 ppm)). Kinetic studies revealed that the adsorption followed pseudo-first-order kinetics governed by interparticle diffusion. Isotherm analysis indicated Langmuir monolayer adsorption with improved 5.90 mg g−1 capacity compared to pristine PAN nanofibers. Thermodynamic parameters suggested the adsorption was spontaneous and endothermic. This work demonstrates the promise of electrospun zeolite/MWCNT nanofibers as adsorbents for removing lead from wastewater.
1 Introduction
Over the past few decades, the uncontrolled discharge of industrial wastewater due to various chemical processes in industries such as PVC production, metal plating, pharmaceutical drug synthesis and dyes, pigment and pesticide manufacturing, etc., has adversely contaminated water resources.1 Wastewater enriched in heavy metals is a serious concern because of its ill health effects, such as neurological, cardiological, and kidney damage, cancer, and cognitive impairments.2 Therefore, these heavy metals, i.e., mercury (Hg+), arsenic (As3+ & As5+), chromium (Cr6+), lead (Pb2+), nickel (Ni2+), etc., seriously threaten the ecosystem.3–5 Among all the heavy metals, lead is considered the most hazardous pollutant in wastewater, which, when ingested by humans, causes severe health issues such as cardiovascular disease, hemolytic anemia, Fanconi's syndrome, encephalopathy, nervous system disruption, hypertension, kidneys, and brain disorders.6 The detrimental effects of heavy metals on numerous life forms have raised significant concerns among scientists and engineers, emphasizing the crucial need for their effective removal.7,8Various water treatment techniques have been employed by researchers to reduce Pb2+, including ion exchange,9 flocculation,10 membrane separation,11 and adsorption.12,13 Out of various proposed techniques, adsorption has been deemed a superior technology because it facilitates the swift removal of contaminants through a straightforward and cost-effective design. Furthermore, this process yields no harmful by-products, enhancing its overall environmental and practical appeal.14 Various adsorbents have been proposed to remove Pb2+ from the polluted wastewater.15
Researchers have also evaluated the adsorption potential of fly ash (FA), an inexpensive and readily available industrial waste material, though it has a lower surface area when compared to other adsorbents.16 To adsorb Pb2+ ions, researchers have produced FA using a “circulating fluidized bed combustion” method. The adsorption capacity of FA was found to be up to 51 mg g−1 with a dosage of 5 g L−1 and followed the pseudo-II order and Freundlich isotherm kinetics.16,17 Abdullah et al. incorporated manganese oxide in electrospun PAN nanofibers (ACNF/MnO2) and reported that the Pb2+ percentage removal was higher in the case of ACNF and ACNF/MnO2 as compared to granules of activated carbon.18 Mikal et al. prepared zinc oxide nanoparticles (ZnO) decorated with PAN nanofibers using electrospinning for the Pb2+ adsorption. The adsorption was found to be exothermic and followed a pseudo-second order kinetic model.19
The current study incorporated ethylenediaminetetraacetic acid-activated MWCNTs and zeolite into electrospun nanofibers. These nano-adsorbents were examined for their ability to adsorb Pb2+ ions from an aqueous solution, with factors such as adsorbent dose, temperature, initial concentration, and contact time being considered. Pb2+ ions' adsorption onto nano-adsorbents was predicted using response surface methodology and artificial neural network approaches, which were not previously reported for these nano-adsorbents. The data collected from the adsorption studies were analyzed for kinetics, isotherms, thermodynamics, and equilibrium studies.
2 Materials and methods
Multiwalled carbon nanotubes (MWCNTs) with a length of 10–30 μm and diameter of 10–20 nm were procured from SAT Nano Technology Material Co., Ltd, China. Polyacrylonitrile (PAN, analytical grade), with a molecular weight (Mw) of 150![[thin space (1/6-em)]](https://www.rsc.org/images/entities/char_2009.gif) 000 g mol−1, was obtained from Exlan Corp, Japan. Coal fly ash was obtained from Sitara Chemicals, Pakistan, whereas ethylenediaminetetraacetic acid (EDTA), nitric acid (HNO3), sulphuric acid (H2SO4), phosphoric acid (H3PO4), dimethylformamide (DMF), and lead nitrate (Pb(NO3)2) salt of lab grade with 99.9% purity were supplied by Sigma-Aldrich, Germany.
000 g mol−1, was obtained from Exlan Corp, Japan. Coal fly ash was obtained from Sitara Chemicals, Pakistan, whereas ethylenediaminetetraacetic acid (EDTA), nitric acid (HNO3), sulphuric acid (H2SO4), phosphoric acid (H3PO4), dimethylformamide (DMF), and lead nitrate (Pb(NO3)2) salt of lab grade with 99.9% purity were supplied by Sigma-Aldrich, Germany.
2.1. Activation of MWCNTs
For the activation of MWCNTs, 0.1 g of MWCNTs were dispersed ultrasonically in 50 ml of ethanol for 2.5 h to obtain a homogeneous dispersion. Then, 1.5 mmol of EDTA was added to 30 ml of ethanol, followed by the gradual addition of MWCNTs/ethanol into the solution. The solution was continuously stirred at 65–70 °C for 12 h. MWCNTs were then vacuum filtered and washed ten times. The activated MWCNTs (ACNTs) were dried at 60 °C in an oven (Thermo Fisher Scientific, United States).2.2. Synthesis of zeolite
Coal fly ash was subjected to drying in an oven at 80 °C overnight to remove any retained moisture. The characterization of raw coal fly ash and zeolite is mentioned in the ESI file.† A mixture containing 16 M of HNO3, 18 M of H2SO4, and 18 M of H3PO4, with a volume ratio of 40![[thin space (1/6-em)]](https://www.rsc.org/images/entities/char_2009.gif) :
:![[thin space (1/6-em)]](https://www.rsc.org/images/entities/char_2009.gif) 20
20![[thin space (1/6-em)]](https://www.rsc.org/images/entities/char_2009.gif) :
:![[thin space (1/6-em)]](https://www.rsc.org/images/entities/char_2009.gif) 40, respectively, was prepared in a sealed glass bottle. 5 g of coal fly ash was added to the acid mixture and placed on the magnetic stirrer for 3–4 h at 125 °C. The zeolite was filtered and rinsed several times with distilled water. The obtained zeolite was then dried at 110 °C for 6 h.20
40, respectively, was prepared in a sealed glass bottle. 5 g of coal fly ash was added to the acid mixture and placed on the magnetic stirrer for 3–4 h at 125 °C. The zeolite was filtered and rinsed several times with distilled water. The obtained zeolite was then dried at 110 °C for 6 h.20
2.3. Fabrication of nanofibrous membrane
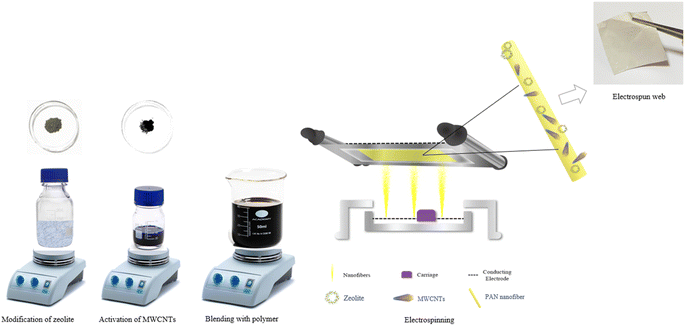
PAN 8% (w/v) was dissolved in DMF while stirring for 12 h to get a homogenous dope solution. A weighed amount of activated MWCNTs was dispersed in the PAN solution and sonicated for 6 h to obtain a homogenous dispersion. The zeolite was added to the solution, followed by sonication for another 6 h before electrospinning.The prepared dope dispersion was poured into a liquid carriage and placed in a needleless electrospinning machine (Nanospider, ELMARCO, Czech Republic). The operating parameters for the electrospinning were set at a voltage of 40 kV, a carriage speed of 90 mm s−1, and an electrospinning distance of 200 mm. The process has been presented in Fig. 1.21
The following pre-trials were performed as mentioned in Table 1 and then subjected to characterizations.
| Sample ID | PAN concentration | Concentration of activated MWCNTs | Concentration of zeolite |
|---|---|---|---|
| A1 | 8% | 100 mg | 50 mg |
| A2 | 8% | 100 mg | 100 mg |
| A3 | 8% | 100 mg | 150 mg |
| A4 | 8% | 100 mg | 200 mg |
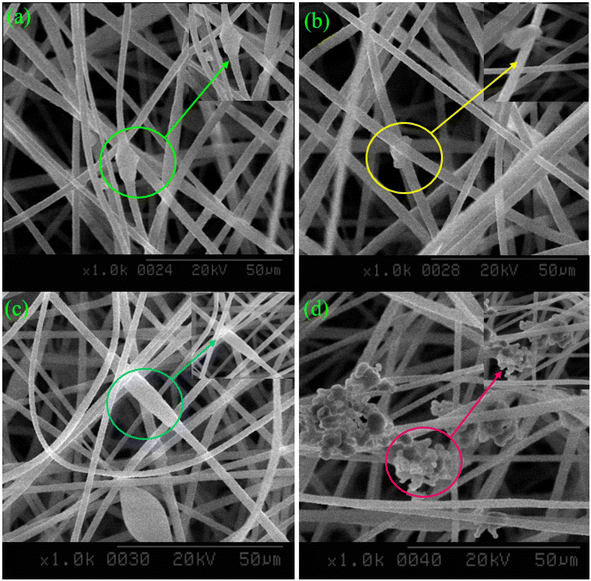
The sample containing maximum zeolite concentration was selected based on SEM results (as mentioned in Section 3.1 & Fig. 2) for further batch adsorption studies.
2.4. Statistical modeling
The adsorptive behavior of Pb2+ on the nano-adsorbent was studied and optimized using statistical techniques, i.e., Response Surface Methodology (RSM). The adsorbent dose, adsorption time, and temperature were selected as independent factors to study their influence on the Pb2+ removal efficiency. The central composite design of the experiment (CCD) was developed using Design Expert Pro. The selected experimental factors and their respective levels are given in Table 2.| Factors | Symbols | Levels | |
|---|---|---|---|
| Low | High | ||
| Adsorbent dose (g) | x D | 0.25 | 2.5 |
| Adsorption time (min) | x t | 10 | 300 |
| Temperature (°C) | x T | 20 | 50 |
| Initial concentration (mg l−1) | x IC | 50 | 400 |
The batch adsorption experimentation was implemented according to the design matrix, containing 30 runs, as mentioned in Table 3.
| Sr. | Dose (g) | Time (min) | Temperature (°C) | Initial concentration (mg l−1) |
|---|---|---|---|---|
| 1 | 1.375 | 155 | 35 | 225 |
| 2 | 1.375 | 155 | 35 | 225 |
| 3 | 2.5 | 155 | 35 | 225 |
| 4 | 0.25 | 10 | 50 | 50 |
| 5 | 0.25 | 155 | 35 | 225 |
| 6 | 2.5 | 10 | 20 | 50 |
| 7 | 2.5 | 300 | 20 | 400 |
| 8 | 0.25 | 300 | 20 | 50 |
| 9 | 2.5 | 10 | 50 | 400 |
| 10 | 1.375 | 155 | 35 | 225 |
| 11 | 1.375 | 155 | 35 | 225 |
| 12 | 2.5 | 10 | 50 | 50 |
| 13 | 0.25 | 10 | 20 | 50 |
| 14 | 1.375 | 10 | 35 | 225 |
| 15 | 0.25 | 10 | 50 | 400 |
| 16 | 0.25 | 300 | 50 | 50 |
| 17 | 1.375 | 300 | 35 | 225 |
| 18 | 1.375 | 155 | 50 | 225 |
| 19 | 0.25 | 300 | 20 | 400 |
| 20 | 1.375 | 155 | 35 | 400 |
| 21 | 1.375 | 155 | 20 | 225 |
| 22 | 0.25 | 10 | 20 | 400 |
| 23 | 2.5 | 300 | 50 | 400 |
| 24 | 2.5 | 300 | 50 | 50 |
| 25 | 1.375 | 155 | 35 | 225 |
| 26 | 1.375 | 155 | 35 | 225 |
| 27 | 2.5 | 10 | 20 | 400 |
| 28 | 0.25 | 300 | 50 | 400 |
| 29 | 1.375 | 155 | 35 | 50 |
| 30 | 2.5 | 300 | 20 | 50 |
2.5. Artificial neural network modelling
Artificial Neural Network (ANN) is a mathematical modelling tool, inspired by the functioning of human-brain.22 ANN is based on the principles of the Takagi–Sugeno fuzzy inference system using input and output layers with one or multiple hidden layers (neurons).23 These neurons predict the interrelation of input and output layers.242.6. Characterization
| ΔpH = pHf − pH0 | (1) |
2.7. Batch adsorption studies
Adsorption capacities of optimized absorbents towards Pb2+ ions were investigated in batch experimentation. Each batch adsorption experiment was performed according to the developed design of experiment. After each experiment, the adsorbate was filtered using a sterile CA membrane filter having a pore size of 0.22 μm. The filtered adsorbate was diluted with double distilled water and further analyzed using the “Inductively Coupled Plasma Optical Emission Spectrometer” (ICP-OES 5110, Agilent, USA) at 220.353 nm wavelength. The 100 ppm stock solution was prepared using Pb(NO3)2 and 1% HNO3, which was then diluted to prepare calibration solutions of 0.2 ppm, 0.3 ppm, 0.5 ppm, 1 ppm, 1.5 ppm, and 2 ppm. The uptake capacity of Pb2+ adsorption at equilibrium and adsorption efficiency was calculated using eqn (2) and (3):25,26 | (2) |
 | (3) |
The effect of time and kinetic studies were performed by varying adsorption time i.e., 10 to 300 minutes while keeping other parameters constant. Weighed amount of adsorbent was added to 100 ppm Pb2+ solution, followed by orbital shaking and adsorbate was filtered and diluted prior to ICP analysis. Different temperatures (293 K to 323 K) were employed to study the effect of temperature and thermodynamics while keeping other parameters constant. Adsorption experiments were conducted at different temperatures and then subjected to ICP analysis.
The pseudo-first order model assumes the Pb2+ adsorption is a relationship between the rate of occupied adsorption sites by the Pb2+ ions and the unoccupied sites available on the surface of adsorbents. It indicates the adsorption rate is directly proportionate to the available adsorption sites on the adsorbent's surface. A non-linear equation for the pseudo-first order kinetic model is as follows.28
| qt = qe(1 − exp(−k0t)) | (4) |
The pseudo-second order describes the chemisorption, which involves the creation of chemical bonds between adsorbent and adsorbate and is represented in mathematical form.29,30
 | (5) |
The pseudo-nth order model is non-linear and provides the accurate kinetic processes order depending on the adsorption capacity of the adsorbent. The expression of the pseudo-nth order model in the case of adsorption is given as.31
 | (6) |
The adsorption data is further analyzed by the Weber and Morris kinetic model (intra-particle diffusion), which determines the diffusion mechanism of the Pb2+ adsorption. The equation of the Weber and Morris model is.32
| qt = kwb(t1/2)∅1 | (7) |
Bangham's model evaluates that the Pb2+ ions adsorption is based on the pore diffusion mechanism and is expressed as.33
 | (8) |
 | (9) |
 | (10) |
| qe = KFCe1/n | (11) |
ΔG° = −RT![[thin space (1/6-em)]](https://www.rsc.org/images/entities/char_2009.gif) ln ln![[thin space (1/6-em)]](https://www.rsc.org/images/entities/char_2009.gif) Kth Kth | (12) |
| ΔG° = ΔH° − TΔS° | (13) |
 | (14) |
![[thin space (1/6-em)]](https://www.rsc.org/images/entities/char_2009.gif) Kth.40
Kth.40
3 Results and discussion
3.1. SEM analysis
SEM micrographs ascertain the morphological structure of the developed adsorbents, as shown below in Fig. 2. The micrographs reveal that the nanofibers were loaded with the composite of ACNTs, and zeolite, as marked in Fig. 2. By incorporating the ACNTs and zeolite, the PAN nanofibers possess a more irregular and rougher surface. The roughness on the surface of nanofibers can also be due to the evaporation of DMF.41 The SEM analysis indicated that the incorporation of ACNTs and zeolite well in nanofibers.Moreover, the A4 adsorbent has a highly rough and irregular surface, which could be due to higher concentrations of ACNTs, and zeolite exposed to the surface, thus improving the surface area of nanofibers.42 SEM analysis of the A4 adsorbent confirmed the presence of ACNTs and zeolite clusters on the nanofibers' surface and in the core. Incorporating highly conducting ACNTs into PAN results in the high charge density of the spinning dope solution and the excess of charge carriers present on the jet surface, leading to the formation of defect-free and finer fibers.43,44
EDX analysis confirmed the incorporation of zeolite and ACNTs into PAN nanofibers, and the elemental composition is mentioned in Table 4. It was evident that the adsorbents contained traces of aluminum, copper, silicon, and titanium due to the presence of zeolite and high weight % of carbon as the contribution of ACNTs embedded in the nanofibers. The presence of ACNTs and zeolite in the nanofibers led to the formation of more active sites and high surface area, contributing to the high removal efficiencies.45,46
| Adsorbents | Elements | Weight, % |
|---|---|---|
| A1 | Carbon | 84.59 |
| Oxygen | 12.87 | |
| Aluminum | 0.29 | |
| Silicone | 0.51 | |
| Copper | 0.36 | |
| Gold | 1.25 | |
| Titanium | 0.13 | |
| A2 | Carbon | 86.68 |
| Oxygen | 10.45 | |
| Aluminum | 0.39 | |
| Silicone | 0.62 | |
| Copper | 0.45 | |
| Gold | 1.23 | |
| Titanium | 0.18 | |
| A3 | Carbon | 87.37 |
| Oxygen | 9.44 | |
| Aluminum | 0.55 | |
| Silicone | 0.74 | |
| Copper | 0.51 | |
| Gold | 1.18 | |
| Titanium | 0.21 | |
| A4 | Carbon | 89.77 |
| Oxygen | 6.93 | |
| Aluminum | 0.67 | |
| Silicone | 0.84 | |
| Copper | 0.53 | |
| Gold | 1.01 | |
| Titanium | 0.25 |
3.2. FTIR analysis
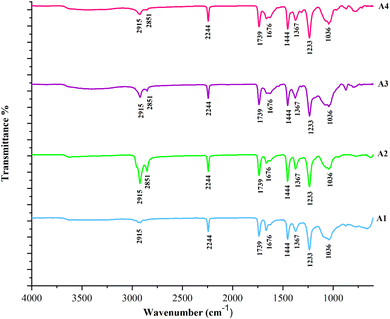
Fig. 3 represents the IR spectrum of the developed electrospun composite adsorbents (A1, A2, A3, and A4). The overlapping absorption peaks in the qualitative FTIR analysis of composite adsorbents show that identical bands are present in the adsorbents which concludes that by changing the concentration of composites (zeolite/ACNTs) the IR spectra of all adsorbents does not show any significant change.47 The use of H2SO4 in the synthesis of zeolite results in reducing the number of hydroxyl groups, due to a dehydrating nature of H2SO4. The peaks at 2915 and 2851 cm−1 may be ascribed to the sp3 CH stretching of the hydrocarbon structure that confirmed the presence of aliphatic acid and OH vibrations, respectively.20 The sharp peak at 2244 cm−1 appears due to the stretching of the nitrile group (C![[triple bond, length as m-dash]](https://www.rsc.org/images/entities/char_e002.gif) N), evidenced by the existence of PAN in adsorbents.42,48
N), evidenced by the existence of PAN in adsorbents.42,48
The peak at 1739 cm−1 assigned to the C![[double bond, length as m-dash]](https://www.rsc.org/images/entities/char_e001.gif) O group of carboxyl and lactones, which indicates the presence of zeolite in the adsorbents. The zeolite exhibits oxygenated acid groups on its surface, such as carboxylic, hydroxyl, and lactone.49 Whereas, at 1676 cm−1, the peak indicates the C
O group of carboxyl and lactones, which indicates the presence of zeolite in the adsorbents. The zeolite exhibits oxygenated acid groups on its surface, such as carboxylic, hydroxyl, and lactone.49 Whereas, at 1676 cm−1, the peak indicates the C![[double bond, length as m-dash]](https://www.rsc.org/images/entities/char_e001.gif) C stretching of aromatic rings.50,51 The peak at 1444 cm−1 is assigned to the O–H bending associated with the carboxylic group. An asymmetric stretching of the S
C stretching of aromatic rings.50,51 The peak at 1444 cm−1 is assigned to the O–H bending associated with the carboxylic group. An asymmetric stretching of the S![[double bond, length as m-dash]](https://www.rsc.org/images/entities/char_e001.gif) O group that appears at 1367 cm−1 may be associated with the functional sites exiting on the zeolite's surface.52 The peak at 1036 cm−1 corresponds to the EDTA's vibrational stretching and bending caused by the N–H group which shows the EDTA activation.53 The IR spectra verified the presence of functional sites that can serve as the potential adsorption sites in the Pb2+ ions adsorption and successful incorporation of zeolite/ACNTs in PAN nanofibers.
O group that appears at 1367 cm−1 may be associated with the functional sites exiting on the zeolite's surface.52 The peak at 1036 cm−1 corresponds to the EDTA's vibrational stretching and bending caused by the N–H group which shows the EDTA activation.53 The IR spectra verified the presence of functional sites that can serve as the potential adsorption sites in the Pb2+ ions adsorption and successful incorporation of zeolite/ACNTs in PAN nanofibers.
3.3. Point of zero charge
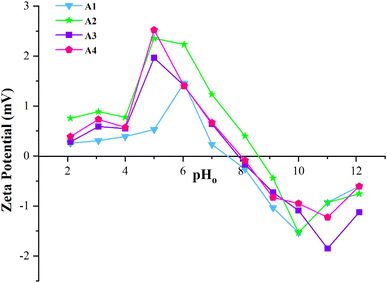
Fig. 4 presents the effect of pH (2–12) on the surface charge of the developed adsorbents (A1, A2, A3 and A4). The isoelectric points are 7.5, 7.9, 8.0, and 8.6 for A1, A2, A3, and A4 adsorbents. These values indicate that the surface of adsorbents possesses a negative charge above their isoelectric point and positively charged below their isoelectric point. At the isoelectric point, the adsorbent's surface carries an equal number of positive and negative charges. Thus, at this point, the net charge on the surface is zero, which means it is electrically neutral.54,55As the pH of Pb2+ contaminated aqueous solution is higher than the isoelectric point of adsorbents, the surface of adsorbents possesses negative charges. Thus, the negative surface of adsorbents is favorable for binding Pb2+ ions (cations).56 However, the surface becomes positively charged when the Pb2+ contaminated aqueous solution's pH is lower than the adsorbent's isoelectric point. This phenomenon considerably limits the electrostatic interaction and ion exchange between adsorbent and adsorbate, thus stalling the cations (Pb2+) adsorption.57,58
3.4. Statistical analysis
The Pb2+ adsorption studies were performed according to the DOE given in Table 2. The removal efficiency% of the experiments is mentioned in Table 5.| Sr. | Dose (g) | Time (min) | Temperature (°C) | Initial concentration (mg l−1) | Removal efficiency (%) |
|---|---|---|---|---|---|
| 1 | 1.375 | 155 | 35 | 225 | 68.35 |
| 2 | 1.375 | 155 | 35 | 225 | 70.58 |
| 3 | 2.5 | 155 | 35 | 225 | 76.47 |
| 4 | 0.25 | 10 | 50 | 50 | 30.13 |
| 5 | 0.25 | 155 | 35 | 225 | 32.96 |
| 6 | 2.5 | 10 | 20 | 50 | 38.41 |
| 7 | 2.5 | 300 | 20 | 400 | 51.32 |
| 8 | 0.25 | 300 | 20 | 50 | 34.48 |
| 9 | 2.5 | 10 | 50 | 400 | 33.73 |
| 10 | 1.375 | 155 | 35 | 225 | 67.09 |
| 11 | 1.375 | 155 | 35 | 225 | 70.16 |
| 12 | 2.5 | 10 | 50 | 50 | 45.92 |
| 13 | 0.25 | 10 | 20 | 50 | 18.47 |
| 14 | 1.375 | 10 | 35 | 225 | 29.74 |
| 15 | 0.25 | 10 | 50 | 400 | 19.35 |
| 16 | 0.25 | 300 | 50 | 50 | 39.97 |
| 17 | 1.375 | 300 | 35 | 225 | 72.36 |
| 18 | 1.375 | 155 | 50 | 225 | 75.92 |
| 19 | 0.25 | 300 | 20 | 400 | 20.16 |
| 20 | 1.375 | 155 | 35 | 400 | 53.69 |
| 21 | 1.375 | 155 | 20 | 225 | 57.26 |
| 22 | 0.25 | 10 | 20 | 400 | 12.98 |
| 23 | 2.5 | 300 | 50 | 400 | 72.81 |
| 24 | 2.5 | 300 | 50 | 50 | 89.75 |
| 25 | 1.375 | 155 | 35 | 225 | 67.79 |
| 26 | 1.375 | 155 | 35 | 225 | 69.93 |
| 27 | 2.5 | 10 | 20 | 400 | 30.96 |
| 28 | 0.25 | 300 | 50 | 400 | 25.31 |
| 29 | 1.375 | 155 | 35 | 50 | 81.81 |
| 30 | 2.5 | 300 | 20 | 50 | 66.94 |
The quadratic model was selected in regression modeling to define the relationship between independent and dependent variables to predict the Pb2+ removal efficiency of the developed adsorbent. The mathematical regression equation for the response (removal efficiency %) prediction is as follows.
| YRe = 4.21 + 32.26xD + 0.26xt + 0.39xT − 0.025xIC + 0.036xDxt + 0.096xDxT − 0.002xDxIC + 0.0008xtxT − 6.31 × 10⁻⁵xtxIC − 0.00028xTxIC − 9.88xD2 − 0.00077xt2 − 0.003xT2 + 1.72 × 10⁻⁵xIC2 | (15) |
The effectiveness of developed model is quantified by the RSM model equation and ANOVA (analysis of variance) helps to determine the contribution of each variable towards explaining the variance in the response variable. Variables with low p-values in the ANOVA analysis are considered statistically significant and have a more substantial impact on the response.
| Source | DF | Adj SS | Adj MS | F-value | p-Value |
|---|---|---|---|---|---|
| Model | 14 | 13![[thin space (1/6-em)]](https://www.rsc.org/images/entities/char_2009.gif) 934.33 934.33 |
995.31 | 25.94 | <0.0001 |
| x D | 1 | 4125.41 | 4125.41 | 107.52 | <0.0001 |
| x t | 1 | 2530.90 | 2530.90 | 65.96 | <0.0001 |
| x T | 1 | 576.83 | 576.83 | 15.03 | 0.0015 |
| x IC | 1 | 875.78 | 875.78 | 22.82 | 0.0002 |
| x D x t | 1 | 538.30 | 538.30 | 14.03 | 0.0019 |
| x D x T | 1 | 41.97 | 41.97 | 1.09 | 0.3122 |
| x D x IC | 1 | 3.00 | 3.00 | 0.078 | 0.7836 |
| x t x T | 1 | 44.34 | 44.34 | 1.16 | 0.2994 |
| x t x IC | 1 | 41.08 | 41.08 | 1.07 | 0.3172 |
| x T x IC | 1 | 8.58 | 8.58 | 0.22 | 0.6432 |
| x D 2 | 1 | 405.41 | 405.41 | 10.57 | 0.0054 |
| x t 2 | 1 | 677.90 | 677.90 | 17.67 | 0.0008 |
| x T 2 | 1 | 1.04 | 1.04 | 0.027 | 0.8716 |
| x IC 2 | 1 | 0.72 | 0.72 | 0.019 | 0.8932 |
| Residual | 15 | 575.55 | 38.37 | ||
| Lack of fit | 10 | 565.42 | 56.54 | 27.90 | 0.03 |
| Pure error | 5 | 10.13 | 2.03 | ||
| Total | 29 | 14![[thin space (1/6-em)]](https://www.rsc.org/images/entities/char_2009.gif) 509.88 509.88 |
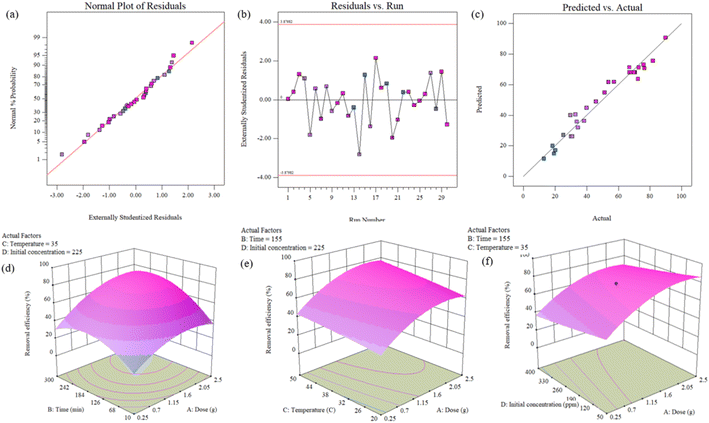
As per the data mentioned above in Table 4, the regression model has a high degree fit and is verified by the coefficients of regression, i.e., R2 (0.9603), R2 adj (0.9233), and R2 predicted (0.7994). The value of R2 = 0.9603 indicates that the model can predict the data and the experimental data is very close to the estimated data.60 These values suggest that the mathematical model explains the relationship between the response (removal efficiency) and the process variables (dose, time, temperature, and initial concentration).61 The significance of linear (xD, xt, xT, xIC), interactive (xDxD, xtxt, xTxT, xICxIC) and quadratic parameters (xDxt, xDxT, xDxIC, xTxIC) on the response (removal efficiency) can be evaluated by the p-values and F-values.62,63
The F-values for dose, time, temperature, and initial concentration are 107.52, 65.96, 15.03, and 22.82, respectively, showing that varying these parameters directly influences the removal efficiency, suggesting that the models are significant. At the same time, the p-values of model, independent variables (dose, time, temperature, and initial concentration), and lack of fit is less than the 0.05 which showed that these factors are significant and validate the adsorption process and also influence removal efficiency.
Similarly, the 3D plot Fig. 5(d) illustrates that increasing the adsorption time increases the removal efficiency, allowing enough time for adsorption until it reaches equilibrium.66 Further, it can also be observed that the increasing temperature contributes to the removal efficiency.67 However, Fig. 5(f) shows that adsorption decreases by increasing the initial concentration of Pb2+ ions. The surface plots depict that the removal efficiency directly relates to the dose, time, and temperature while indirectly related to the initial concentration of Pb2+ ions. These results are consistent with the regression equation of the model (eqn (15)).
3.5. Artificial neural network modelling
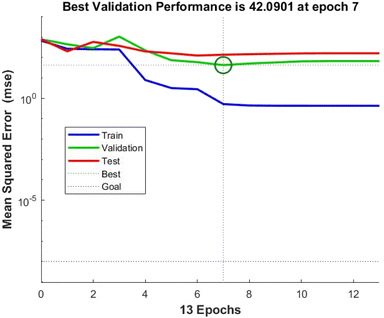
The experimental dataset acquired through RSM can effectively be used to assess the ANN model. In addition to evaluate the correlation between input and output parameters, the correlation coefficient and mean square error were also employed to ascertain the predictability of the model.68 The optimal ANN topology was designed as 4-6-6-1 (an input layer with 4 neurons representing dose, time, temperature, and initial concentration; two hidden layers with 6 neurons each and an output layer corresponding to the removal efficiency). The regression plots of the ANN model for training, validation, testing and all prediction data sets are shown in Fig. 7. It is observed that the ANN model established a strong correlation using the training data with an optimized structure with correlation coefficient i.e., 0.9994 as depicted in Fig. 7(a). Additionally, it also performed well using validation and testing data with some scattering. The correlation coefficients for validation and testing are 0.9817 and 0.9885, respectively. It can also be observed that the output values of ANN model lies close to the experimental ones. For an overall prediction, the correlation coefficient is 0.9793; it can be affirmed that the ANN model effectively interpolates the experimental data, indicating its satisfactory performance. The validation performance plot, as shown in Fig. 8, evaluates the training process's reliability. Fig. 8 illustrates the predicted values of normalized removal efficiency through ANN model for both training and testing data compared to the experimental normalized data.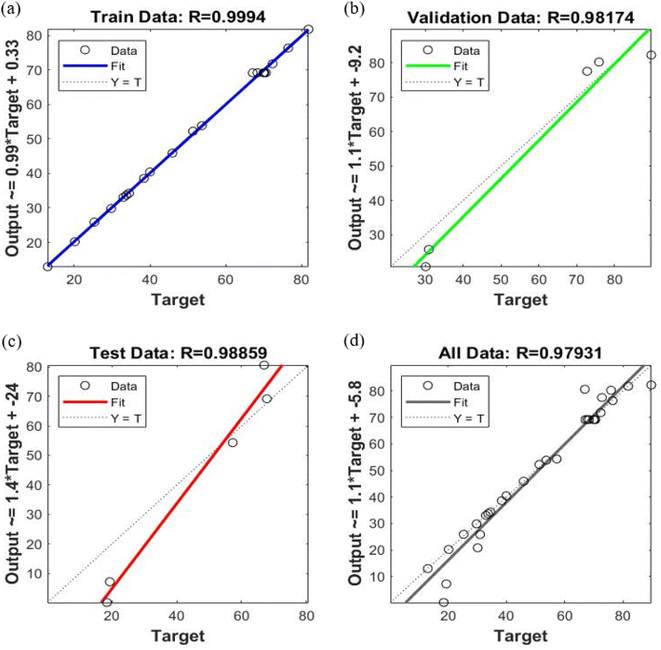 | ||
| Fig. 7 ANN regression plots for (a) training, (b) validation, (c) testing and (d) all data prediction sets. | ||
The assessment of the predictive and generalization abilities of both the RSM and ANN models was conducted using their respective R2 values as mentioned in Table 7. The values of R2 for both models indicates that they effectively forecast the experimental values as both values approaches unity. Thus, both models are considered as effective in foreseeing the experimental removal efficiency of developed adsorbents.
| Parameter | ANN | RSM |
|---|---|---|
| R 2 | 0.979 | 0.960 |
3.6. Adsorption kinetics
The influence of time on the Pb2+ ions adsorption is illustrated in Fig. 9(a), and it was observed that equilibrium is achieved at approximately 120 min. At the initial stage, a steep slope is observed in the curve owing to the high adsorption rate. The initial adsorption rate is considerably high due to many active species on the adsorbent.69 As the contact time tends to increase, the adsorption rate decreases due to the saturation of the available active species, thus implying that the equilibrium has been accomplished. This situation proves that the adsorption kinetics is based on the rate of adsorbate transferred from the aqueous solution to the surface of the adsorbent.70,71 Furthermore, the mechanism for the Pb2+ ions adsorption on the adsorbent is explored by employing non-linear pseudo first order, pseudo-second order, nth order kinetics, Weber and Morris, and Bangham's model to the experimental results. Plots for the respective models are demonstrated in Fig. 9(b)–(d).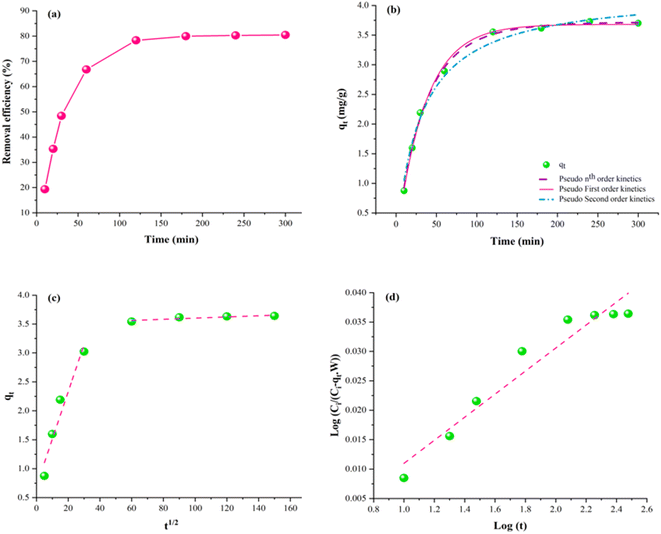 | ||
| Fig. 9 Kinetic modelling. (a) Effect of time. (b) Non-linear kinetics (pseudo first order, pseudo second order & nth-order Kinetics). (c) Intra-particle diffusion model. (d) Bangham's model. | ||
The plot shown in Fig. 9(b) depicts the correlation of experimental values with the nth-order kinetic model rather than pseudo-first-order and pseudo-second-order kinetics. The model with a minimum error value and higher R2 is considered the best fit for experimental data.72 However, the value of SSE implies that the pseudo nth-order kinetic model is the best fit for the experimental data of Pb2+ adsorption, which predicts the studied adsorption kinetics. The values of R2 and SSE for nth-order kinetics are 0.99 and 0.02, respectively, while SSE for pseudo-first-order and second-order are higher than the nth-order kinetics. The value of coefficient “n” of nth order is approximately 1.14 and is increasing as the initial concentration of Pb2+ ions increases in the aqueous solution. This might be due to the concentration gradient i.e., higher Pb2+ concentrations at the initial stage.73,74 The model's fitness reveals that complicated adsorption phenomenon has occurred and there might exist an interaction between the adsorbate and adsorbent.75,76
Furthermore, Bangham's model has 0.94 as the value of R2, which depicts that the model did not conform well with the experimental data, revealing that the pore diffusion phenomena is not dominating the adsorption process.77 Further, the Pb2+ adsorption is likely to be regulated by inter-particle diffusion or mass transfer. To estimate the rate-determining step, Weber and Morris (WM) model is applied.78 The WM model divides the adsorption process into two steps. The steep curve represents the immediate reaction step dominated by the surface diffusion phenomena in the first step. The second step exhibits a slow reaction step governed by the pore diffusion phenomena.79 It is evident from Table 8 that the value of ∅1 is less than the ∅2, and kwb has a higher value than kwb′. This suggests that the reaction is slowest in the second step owing to the greater thickness of the boundary layer, which leads to a larger ∅2. Thus, it is concluded that the interparticle diffusion phenomenon is the rate-determining step in Pb2+ adsorption.31,80
| Kinetic models | Parameters | Values |
|---|---|---|
| Pseudo-first-order | q e (mg g−1) | 3.62 |
| k o (min−1) | 0.02 | |
| R 2 | 0.99 | |
| Pseudo-second-order | q e (mg g−1) | 4.23 |
| k 1 (g mg−1 min−1) | 0.00 | |
| R 2 | 0.98 | |
| Pseudo-nth order | q e (mg g−1) | 3.27 |
| K n (min−1) | 0.02 | |
| N | 1.135 | |
| R 2 | 0.99 | |
| Intra particle diffusion | ∅ 1 | 1.19 |
| k wb (mg g−1 min−1/2) | 0.44 | |
| R 2 | 0.84 | |
| ∅ 2 | 3.6 | |
| k wb′ (mg g−1 min−1/2) | 0.0004 | |
| R 2 | 0.97 | |
| Bangham's | k b (g) | 0.99 |
| δ | 1.01 | |
| R 2 | 0.94 |
Intercept and slope of the above-illustrated plots are utilized for estimating the pertinent parameters of each model, and their respective correlation coefficient is summarized in Table 8.
3.7. Adsorption thermodynamics
The influence of temperature on Pb2+ adsorption is presented in Fig. 10(a), which depicts that elevation in temperature directly impacts the Pb2+ adsorption. This indicates that an increase in temperature results in an increase in Pb2+ adsorption.81 The rate of diffusion of adsorbate molecules is significantly enhanced within the pores and across the adsorbent's boundary layer owing to the temperature increase. This reduces the resistance against mass transfer, allowing the increased adsorbate molecule's mobility within the pores and across the boundary layer.82,83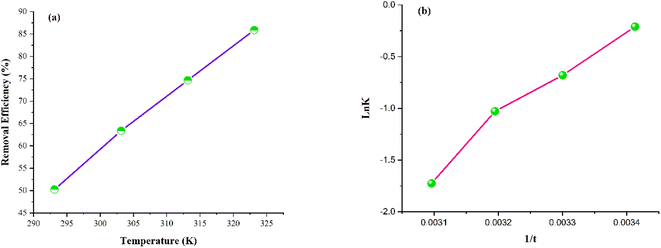 | ||
| Fig. 10 Adsorption thermodynamics plots. (a) Effect of temperature on the Pb2+ adsorption. (b) Van't Hoff plot. | ||
The thermodynamic behavior of the developed adsorbent is shown in Fig. 10(b) as Van't Hoff plot, and the calculated parameters are compiled in Table 9. The positive value of ΔS′ reveals the upsurge in augmented randomness around the adsorbent–adsorbate interface initiated by the adsorption. Furthermore, the ΔS′ has a low value, indicating that this system does not bring about any substantial change in entropy.84 The positive enthalpy value indicates the endothermic nature of the Pb2+ adsorption process.85 The negative ΔG′ values exhibit the spontaneity of the Pb2+ adsorption process. The ΔG′ values tend to decrease with an elevation in temperature, indicating that adsorption's spontaneity lowers at lower temperatures. The thermodynamic study suggests that the increasing temperature implies in an increased adsorption.85
| ΔG′ (kJ mol−1) | ΔS′ (J mol−1 K−1) | ΔH′ (kJ mol−1) | |||
|---|---|---|---|---|---|
| 293 K | 303 K | 313 K | 323 K | ||
| −0.51 | −1.71 | −2.67 | −4.63 | 0.124 | 38.37 |
The negative ΔG′ values exhibit the spontaneity of the adsorption process. The ΔG′ values tend to decrease with an elevation in temperature, indicating that adsorption's spontaneity lowers at lower temperatures. The thermodynamic study suggests that the Pb2+ adsorption process is feasible, and the increase in temperature implies an increase in adsorption.86,87
3.8. Adsorption isotherms
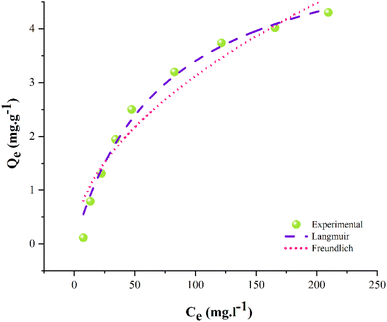
The non-linear Langmuir and Freundlich isotherm models are employed on experimental data for the adsorption of Pb2+. The pertinent correlation coefficients (R2) and parameters were estimated using Origin Pro (version 2021) software. The plots of isotherms are represented in Fig. 11, while the respective parameters for these isotherms are compiled in Table 10. The fitness of isotherm models is based on the value of R2.88 The parameters portray that the Langmuir isotherm fits well with the experimental data, having significantly higher R2 than the Freundlich isotherm. This depicts that the adsorbent's surface is homogenous with a Langmuir monolayer capacity of 5.90 mg g−1.89| Isotherm models | Parameters | ||||
|---|---|---|---|---|---|
| q max (mg g−1) | K l | K F (l g−1) | α | R 2 | |
| Langmuir | 5.90 | 0.014 | — | — | 0.98 |
| Freundlich | — | — | 0.28 | 1.91 | 0.93 |
The R2 of Freundlich is lower than that of Langmuir's i.e., 0.98. Hence, Table 10 reveals the order of model fitness as Langmuir > Freundlich. The Freundlich model was ruled out owing to poor fitness on the data. The separation factor for Langmuir (Kl) is 0.014 which is dimensionless that is higher than zero and less than 1, which suggests the Pb2+ adsorption is favorable on the adsorbent.90–92 If Kl is greater than 1, the adsorption is considered unfavorable, while if Kl = 0, it means the adsorption is irreversible.93 It is concluded that the Pb2+ adsorption is homogenous and monolayer as the Langmuir model postulates that monolayer adsorption occurs at homogenous adsorption sites of the adsorbent.94
The adsorption mechanism is a complex and multistep process as experimental values follows the nth-order kinetic model and Langmuir isotherm. The nth-order kinetic model indicates a high dependence on Pb2+ ions concentration. While combining both models, the adsorption process likely initiates with swift adsorption (as indicated by the nth-order kinetics), where adsorbate molecules promptly occupy surface sites. As saturation approaches, adsorption gradually slows down, transitioning into a regulated formation of a monolayer on the adsorbent's surface, which is consistent with the findings of the Langmuir model.
3.9. Regeneration study of adsorbent
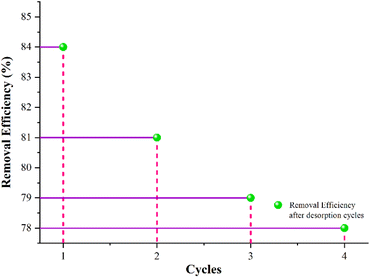
Regeneration study aids in elucidating the nature of adsorption and allows for the regeneration of the adsorbed heavy metal ions from the adsorbent; thus, the adsorbent can be further used repeatedly.95 In order to regenerate the developed adsorbent, Pb2+ ions adsorbed on the adsorbent can be efficiently removed in a beaker. The beaker contains 100 ml of 5% NaOH aqueous solution and is placed in a mechanical shaker at a speed of 80 rpm at 60 °C for 60 minutes.96 The regenerated adsorbent was then used in the adsorption–desorption. Adsorption–desorption cycles of the developed adsorbent were repeated up to 4 times and evaluated the adsorption capacity after each cycle. The developed adsorbent was regenerated in its original form, and its performance is mentioned in Fig. 12 below.4 Conclusion
Zeolite and activated MWCNTs were successfully embedded in PAN nanofibers via needleless electrospinning. The as-prepared nanofibrous adsorbent improved adsorption efficiency for Pb2+ ions. The prepared adsorbents were characterized to confirm the incorporation of zeolite and activated MWCNTs into the PAN nanofibrous matrix. By increasing the concentration of additives, the surface of nanofibers becomes rougher than at lower concentrations, as evidenced by SEM micrographs. FTIR analysis confirmed the successful incorporation of zeolite and activated MWCNTs. The thermodynamic and isotherm studies revealed that the Pb2+ adsorption is endothermic and followed Langmuir isotherm with qmax, i.e., 5.90 mg g−1. The kinetic study showed that the adsorption process was dominated by pseudo first-order kinetics and accompanied by interparticle diffusion as the rate-limiting step. The prepared adsorbent has good regeneration ability and has 78% removal efficiency after 4 cycles. Thus, the proposed adsorbent can potentially adsorb Pb2+ ions from water.Informed consent
All subjects participating in the research gave their informed consent.Data availability
Information is available upon request.Author contributions
Conceptualization, U. M. and A. N.; methodology, U. M.; software, M. J.; validation, T. H.; formal analysis, S. F. and M. J.; investigation, U. M., A. N.; resources, T. H. and A. S. A.; data curation, Z. K.; writing original draft, U. M.; review and editing, A. N., M. B. Q., and T. H.; visualization, Z. K. and S. F.; supervision, M. B. Q., A. N., and T. H.; project administration, M. B. Q. and A. N. All authors have read and agreed to the published version of the manuscript.Conflicts of interest
There are no conflicts to declare.Acknowledgements
The authors are thankful to the Deanship of Scientific Research under supervision of the Science and Engineering Research Center at Najran University for funding this work under the research centers funding program with grant (NU/RCP/SERC/12/9) and Pakistan Science Foundation (PSF) under the grant number (PSF/CRP/P-NTU-HELIX-194).References
- M. Vakili, S. Deng, G. Cagnetta, W. Wang, P. Meng, D. Liu and G. Yu, Sep. Purif. Technol., 2019, 224, 373–387 CrossRef CAS.
- K. K. Kesari, R. Soni, Q. M. S. Jamal, P. Tripathi, J. A. Lal, N. K. Jha, M. H. Siddiqui, P. Kumar, V. Tripathi and J. Ruokolainen, Water, Air, Soil Pollut., 2021, 232, 1–28 CrossRef.
- S. S. Fiyadh, M. A. AlSaadi, W. Z. Jaafar, M. K. AlOmar, S. S. Fayaed, N. S. Mohd, L. S. Hin and A. El-Shafie, J. Cleaner Prod., 2019, 230, 783–793 CrossRef CAS.
- S. Rajeshkumar, Y. Liu, X. Zhang, B. Ravikumar, G. Bai and X. Li, Chemosphere, 2018, 191, 626–638 CrossRef CAS PubMed.
- H. Zandavar, S. M. Pourmortazavi and S. Mirsadeghi, J. Mater. Res. Technol., 2021, 13, 25–37 CrossRef CAS.
- Z. Rahman and V. P. Singh, Environ. Monit. Assess., 2019, 191, 1–21 CrossRef CAS.
- K. L. Hon, C. K. Fung and K. C. Leung Alexander, Hong Kong Med. J., 2017, 23, 616–621 CAS.
- A. A. Alshahrani, M. AlQahtani, A. M. Almushaikeh, H. M. A. Hassan, M. Alzaid, A. N. Alrashidi and I. H. Alsohaimi, J. Mater. Res. Technol., 2022, 18, 2310–2319 CrossRef CAS.
- A. Wołowicz, K. Staszak and Z. Hubicki, J. Water Process Eng., 2023, 53, 103792 CrossRef.
- Z. Yang, Y. Sun, Z. Hou, H. Yu, M. Li, Y. Li, Y. Li, B. Gao and S. Xu, J. Hazard. Mater., 2023, 447, 130768 CrossRef CAS PubMed.
- X. Long, G.-Q. Zhao, Y. Zheng, J. Hu, Y. Zuo, W. Luo and F. Jiao, Chem. Eng. J., 2023, 144904 CrossRef CAS.
- Z. Raji, A. Karim, A. Karam and S. Khalloufi, Trends Food Sci. Technol., 2023, 137, 74–91 CrossRef CAS.
- S. R. Al-Mhyawi, D. M. D. Bader, M. A. Bajaber, S. M. A. El Dayem, A. H. Ragab, K. A. Abd El-Rahem, M. A. Gado, B. M. Atia and M. F. Cheira, J. Mater. Res. Technol., 2023, 22, 3058–3074 CrossRef CAS.
- L. Velarde, M. S. Nabavi, E. Escalera, M. L. Antti and F. Akhtar, Chemosphere, 2023, 328, 138508 CrossRef CAS.
- K. Ahmad, H. u. R. Shah, M. S. Khan, A. Iqbal, E. Potrich, L. S. Amaral, S. Rasheed, H. Nawaz, A. Ayub, K. Naseem, A. Muhammad, M. R. Yaqoob and M. Ashfaq, J. Cleaner Prod., 2022, 368, 133010 CrossRef CAS.
- U. O. Aigbe, K. E. Ukhurebor, R. B. Onyancha, O. A. Osibote, H. Darmokoesoemo and H. S. Kusuma, J. Mater. Res. Technol., 2021, 14, 2751–2774 CrossRef CAS.
- K. Tomasz, K. Anna and C. Ryszard, Microchem. J., 2019, 145, 1011–1025 CrossRef CAS.
- N. Abdullah, N. Yusof, A. F. Ismail, F. E. C. Othman, J. Jaafar, L. W. Jye, W. N. W. Salleh, F. Aziz and N. Misdan, Emergent Mater., 2018, 1, 89–94 CrossRef CAS.
- N. R. Mikal, S. Sadjadi, M. Rajabi-Hamane, S. J. Ahmadi and E. Iravani, J. Iran. Chem. Soc., 2016, 13, 763–771 CrossRef CAS.
- Z. Aslam, I. A. Hussein, R. A. Shawabkeh, M. A. Parvez, W. Ahmad and Ihsanullah, J. Air Waste Manage. Assoc., 2019, 69, 246–257 CrossRef CAS PubMed.
- J. A. A. Abdullah, V. Perez-Puyana, A. Guerrero and A. Romero, J. Appl. Polym. Sci., 2023, 140, e54345 CrossRef CAS.
- A. Malekian and N. Chitsaz, Advances in Streamflow Forecasting, 2021, pp. 115–147 Search PubMed.
- S. S. Fiyadh, S. M. Alardhi, M. Al Omar, M. M. Aljumaily, M. A. Al Saadi, S. S. Fayaed, S. N. Ahmed, A. D. Salman, A. H. Abdalsalm, N. M. Jabbar and A. El-Shafi, Heliyon, 2023, 9, e15455 CrossRef CAS PubMed.
- C. E. Onu, J. T. Nwabanne, P. E. Ohale and C. O. Asadu, S. Afr. J. Chem. Eng., 2021, 36, 24–42 Search PubMed.
- I. Mironyuk, I. Mykytyn, H. Vasylyeva and K. Savka, J. Mol. Liq., 2020, 316, 113840 CrossRef CAS.
- L. Qiao, S. Li, Y. Li, Y. Liu and K. Du, J. Cleaner Prod., 2020, 253, 120017 CrossRef CAS.
- U. A. Edet and A. O. Ifelebuegu, Process, 2020, 8, 1–15 Search PubMed.
- N. Sadeu Christian, S. Gabche Anagho, C. Sadeu Ngakou, G. Solomon Anagho, H. Manga Ngomo, M. Raziq Rahimi Kooh and U. Brunei Darussalam, Curr. J. Appl. Sci. Technol., 2019, 36, 1–18 Search PubMed.
- A. Hashem, S. M. Badawy, S. Farag, L. A. Mohamed, A. J. Fletcher and G. M. Taha, J. Environ. Chem. Eng., 2020, 8, 103966 CrossRef CAS.
- A. Nasrullah, A. H. Bhat, A. Naeem, M. H. Isa and M. Danish, Int. J. Biol. Macromol., 2018, 107, 1792–1799 CrossRef CAS PubMed.
- A. L. P. F. Caroni, C. R. M. de Lima, M. R. Pereira and J. L. C. Fonseca, J. Colloid Interface Sci., 2009, 340, 182–191 CrossRef CAS PubMed.
- S. Jiang, T. Yu, R. Xia, X. Wang and M. Gao, Mater. Chem. Phys., 2019, 232, 374–381 CrossRef CAS.
- B. Li, Q. Zhang and C. Ma, Int. J. Chem. Eng., 2021, 2021, 8886646 Search PubMed.
- B. C. Kelly, Astrophys. J., 2007, 665, 519947 Search PubMed.
- N. R. V. Derick, D. E. P. Sumalapao, J. R. Distor, I. D. Ditan, N. T. S. Domingo and L. F. Dy, J. Math. Comput. Sci., 2016, 6, 1157–1168 Search PubMed.
- A. Zahir, Z. Aslam, M. S. Kamal, W. Ahmad, A. Abbas and R. A. Shawabkeh, J. Mol. Liq., 2017, 244, 211–218 CrossRef CAS.
- S. Zarin, Z. Aslam, A. Zahir, M. S. Kamal, A. G. Rana, W. Ahmad and S. Ahmed, J. Iran. Chem. Soc., 2018, 15, 2689–2701 CrossRef CAS.
- Y. P. Zhang, V. S. K. Adi, H. L. Huang, H. P. Lin and Z. H. Huang, J. Ind. Eng. Chem., 2019, 76, 240–244 CrossRef CAS.
- M. Malhotra, S. Suresh and A. Garg, Environ. Sci. Pollut. Res., 2018, 25, 32210–32220 CrossRef CAS PubMed.
- M. N. Sahmoune, Environ. Chem. Lett., 2019, 17, 697–704 CrossRef CAS.
- N. Hoogesteijn von Reitzenstein, B. Sonmez Baghirzade, E. Pruitt, K. Hristovski, P. Westerhoff and O. G. Apul, Chem. Eng. J. Adv., 2022, 9, 100199 CrossRef CAS.
- S. Swaminathan, N. M. Imayathamizhan and A. Muthumanickkam, J. Elastomers Plast., 2020, 53, 48–67 CrossRef.
- S. Subramani and S. Rajiv, Ionics, 2021, 27, 2203–2218 CrossRef CAS.
- S. Subramani and S. Rajiv, Ionics, 2021, 27, 2203–2218 CrossRef CAS.
- A. Bayat, A. Tati, S. Ahmadipouya, S. A. Haddadi and M. Arjmand, J. Mol. Liq., 2021, 331, 115734 CrossRef CAS.
- M. Goswami and P. Phukan, J. Environ. Chem. Eng., 2017, 5, 3508–3517 CrossRef CAS.
- M. Koosha and H. Mirzadeh, J. Biomed. Mater. Res., Part A, 2015, 103, 3081–3093 CrossRef CAS PubMed.
- S. Kalantari, F. Golbabaei, M. Reza Monazzam, A. Ghasemi Koozekonan, M. Reza Monazzam Esmaeilpour, S. Kalantary, A. Karimi, K. Azam and V. Ahmadi Moshiran, J. Text. Inst., 2021, 112, 946–954 CrossRef.
- S. M. Abegunde, K. S. Idowu, O. M. Adejuwon and T. Adeyemi-Adejolu, Resour. Environ. Sustain., 2020, 1, 100001 Search PubMed.
- K. Zhang, Z. Dai, W. Zhang, Q. Gao, Y. Dai, F. Xia and X. Zhang, Coord. Chem. Rev., 2021, 434, 213809 CrossRef CAS.
- B. Huang, G. Liu, P. Wang, X. Zhao and H. Xu, Processes, 2019, 7, 167 CrossRef CAS.
- R. A. S. Rizwan Ali, Z. Aslam and I. A. H. Anam Asghar, Turk. J. Chem., 2020, 44, 279–295 CrossRef PubMed.
- L. Cui, Y. Wang, L. Gao, L. Hu, L. Yan, Q. Wei and B. Du, Chem. Eng. J., 2015, 281, 1–10 CrossRef CAS.
- M. Kragović, M. Stojmenović, J. Petrović, J. Loredo, S. Pašalić, A. Nedeljković and I. Ristović, Procedia Manuf., 2019, 32, 286–293 CrossRef.
- S. Zarin, Z. Aslam, A. Zahir, M. S. Kamal, A. G. Rana, W. Ahmad and S. Ahmed, J. Iran. Chem. Soc., 2018, 15, 2689–2701 CrossRef CAS.
- A. Aichour and H. Zaghouane-Boudiaf, Microchem. J., 2019, 146, 1255–1262 CrossRef CAS.
- C. Aniagor, A. Hashem, C. Onyeka Aniagor, M. Fathi Nasr and A. Abou-Okeil, Int. J. Biol. Macromol., 2018, 1–16 Search PubMed.
- D. Kouotou, M. Ghalit, J. N. Ndi, L. M. P. Martinez, M. El Ouahabi, J. M. Ketcha and E. K. Gharibi, Environ. Monit. Assess., 2021, 193, 1–15 CrossRef.
- M. Mourabet, A. El Rhilassi, H. El Boujaady, M. Bennani-Ziatni and A. Taitai, Arabian J. Chem., 2017, 10, S3292–S3302 CrossRef CAS.
- N. Sohrabi, R. Mohammadi, H. R. Ghassemzadeh and S. S. S. Heris, J. Mol. Liq., 2021, 328, 115384 CrossRef CAS.
- D. Allouss, Y. Essamlali, O. Amadine, A. Chakir and M. Zahouily, RSC Adv., 2019, 9, 37858–37869 RSC.
- Z. Wang, Y. Jia, W. Song, X. Li, K. Xu and Z. Wang, J. Cleaner Prod., 2021, 300, 126974 CrossRef CAS.
- A. A. H. Saeed, N. Y. Harun, S. Sufian, M. R. Bilad, B. A. Nufida, N. M. Ismail, Z. Y. Zakaria, A. H. Jagaba, A. A. S. Ghaleb and B. N. S. Al-Dhawi, Water, 2021, 13, 999 CrossRef CAS.
- S. Z. N. Ahmad, W. N. Wan Salleh, A. F. Ismail, N. Yusof, M. Z. Mohd Yusop and F. Aziz, Chemosphere, 2020, 248, 126008 CrossRef CAS PubMed.
- N. K. Soliman and A. F. Moustafa, J. Mater. Res. Technol., 2020, 9, 10235–10253 CrossRef CAS.
- R. V. Hemavathy, A. Saravanan, P. S. Kumar, D. V. N. Vo, S. Karishma and S. Jeevanantham, Chemosphere, 2021, 283, 131276 CrossRef CAS PubMed.
- Z. Wang, Y. Jia, W. Song, X. Li, K. Xu and Z. Wang, J. Cleaner Prod., 2021, 300, 126974 CrossRef CAS.
- A. Nighojkar, K. Zimmermann, M. Ateia, B. Barbeau, M. Mohseni, S. Krishnamurthy, F. Dixit and B. Kandasubramanian, Environ. Sci.: Adv., 2023, 2, 11–38 CAS.
- P. B. Vilela, A. Dalalibera, E. C. Duminelli, V. A. Becegato and A. T. Paulino, Environ. Sci. Pollut. Res., 2019, 26, 28481–28489 CrossRef CAS PubMed.
- R. S. Bangari, A. Yadav and N. Sinha, Soft Matter, 2021, 17, 2640–2651 RSC.
- A. Dargahi, M. R. Samarghandi, A. Shabanloo, M. M. Mahmoudi and H. Z. Nasab, Biomass Convers. Biorefin., 2021, 1–15 Search PubMed.
- A. Zahir, Z. Aslam, U. Aslam, A. Abdullah, R. Ali and M. M. Bello, Chem. Biochem. Eng. Q., 2020, 34, 93–104 CrossRef CAS.
- S. Haykin, IEEE J. Sel. Area. Commun., 2005, 23, 201–220 Search PubMed.
- R. L. Tseng, P. H. Wu, F. C. Wu and R. S. Juang, Chem. Eng. J., 2014, 237, 153–161 CrossRef CAS.
- Y. Tanimoto and S. I. Noro, RSC Adv., 2021, 11, 23707–23713 RSC.
- Z. Yang, G. Wu, Q. Li, H. Ai, X. Yao and H. Ji, Sep. Sci. Technol., 2021, 56, 860–869 CrossRef CAS.
- M. Benjelloun, Y. Miyah, G. Akdemir Evrendilek, F. Zerrouq and S. Lairini, Arabian J. Chem., 2021, 14, 103031 CrossRef CAS.
- T. R. Sahoo and B. Prelot, in Nanomaterials for the Detection and Removal of Wastewater Pollutants, Elsevier, 2020, pp. 161–222 Search PubMed.
- X. Liu, Y. Zhang, Y. Liu and T. Zhang, Polym. Bull., 2022, 1–20 Search PubMed.
- J. López-Luna, L. E. Ramírez-Montes, S. Martinez-Vargas, A. I. Martínez, O. F. Mijangos-Ricardez, M. d. C. A. González-Chávez, R. Carrillo-González, F. A. Solís-Domínguez, M. d. C. Cuevas-Díaz and V. Vázquez-Hipólito, SN Appl. Sci., 2019, 1, 1–19 Search PubMed.
- K. Kayalvizhi, N. M. I. Alhaji, D. Saravanakkumar, S. B. Mohamed, K. Kaviyarasu, A. Ayeshamariam, A. M. Al-Mohaimeed, M. R. AbdelGawwad and M. S. Elshikh, Environ. Res., 2022, 203, 111814 CrossRef CAS PubMed.
- T. C. Egbosiuba, A. S. Abdulkareem, J. O. Tijani, J. I. Ani, V. Krikstolaityte, M. Srinivasan, A. Veksha and G. Lisak, Chemosphere, 2021, 266, 128937 CrossRef CAS PubMed.
- S. Pandey, E. Fosso-Kankeu, M. J. Spiro, F. Waanders, N. Kumar, S. S. Ray, J. Kim and M. Kang, Mater. Today Chem., 2020, 18, 100376 CrossRef CAS.
- S. Khan, M. Idrees and M. Bilal, Colloids Surf., A, 2021, 623, 126711 CrossRef CAS.
- G. Hanbali, S. Jodeh, O. Hamed, R. Bol, B. Khalaf, A. Qdemat, S. Samhan and O. Dagdag, Processes, 2020, 8, 986 CrossRef CAS.
- M. Zulfiqar, S. Y. Lee, A. A. Mafize, N. A. M. A. Kahar, K. Johari and N. E. Rabat, Polymers, 2020, 12, 430 CrossRef CAS PubMed.
- S. F. Abo-Zahra, I. M. Abdelmonem, T. E. Siyam, A. M. El-Masry and H. M. Abdel-Aziz, Polym. Bull., 2022, 79, 4395–4415 CrossRef CAS.
- B. O. Isiuku, P. C. Okonkwo and C. D. Emeagwara, J. Dispers. Sci. Technol., 2021, 42, 1879–1897 CrossRef CAS.
- A. Zahir, Z. Aslam, M. S. Kamal, W. Ahmad, A. Abbas and R. A. Shawabkeh, J. Mol. Liq., 2017, 244, 211–218 CrossRef CAS.
- K. Kayalvizhi, N. M. I. Alhaji, D. Saravanakkumar, S. B. Mohamed, K. Kaviyarasu, A. Ayeshamariam, A. M. Al-Mohaimeed, M. R. AbdelGawwad and M. S. Elshikh, Environ. Res., 2022, 203, 111814 CrossRef CAS PubMed.
- A. Kokalj, Corros. Sci., 2023, 217, 111124 CrossRef CAS.
- Ş. Altun, A. E. Kadak, A. Küçükgülmez, O. Gülnaz and M. Çelik, Toxicol. Res., 2023, 39, 127–133 CrossRef PubMed.
- N. Hasani, T. Selimi, A. Mele, V. Thaçi, J. Halili, A. Berisha and M. Sadiku, Molecules, 2022, 27, 1856 CrossRef CAS PubMed.
- A. Hashem, C. O. Aniagor, G. M. Taha and M. Fikry, Curr. Res. Green Sustainable Chem., 2021, 4, 100056 CrossRef CAS.
- O. Pereao, C. Bode-Aluko, K. Laatikainen, A. Nechaev and L. Petrik, J. Polym. Environ., 2019, 27, 1843–1860 CrossRef CAS.
- Y. Luo, M. Liu, Y. Chen, T. Wang and W. Zhang, R. Soc. Open Sci., 2019, 6, 190764 CrossRef CAS PubMed.
Footnote |
| † Electronic supplementary information (ESI) available. See DOI: https://doi.org/10.1039/d3ra07720a |
| This journal is © The Royal Society of Chemistry 2024 |

