
 Open Access Article
 This Open Access Article is licensed under a Creative Commons Attribution-Non Commercial 3.0 Unported Licence
Pioneering method for the synthesis of lead sulfide (PbS) nanoparticles using a surfactant-free microemulsion scheme†
Hemant Tarkasa,
Abhilasha Rokadea,
Devashri Upasania,
Narendra Pardhia,
Avinash Rokadea,
Jaydeep Salib,
Shashikant P. Patole *c and
Sandesh Jadkar*a
*c and
Sandesh Jadkar*a
aDepartment of Physics, Savitribai Phule Pune University, Pune 411007, India. E-mail: sandesh@physics.unipune.ac.in
bDepartment of Physics, KBC North Maharashtra University, Jalgaon 425 001, India
cDepartment of Physics, Khalifa University of Science and Technology, Abu Dhabi 127788, UAE. E-mail: shashikant.patole@ku.ac.ae
First published on 31st January 2024
Abstract
In this study, we report the synthesis of PbS particles having dimensions in the quantum-dot regime (13.17 to 26.91 nm) using a cyclohexane:isopropanol:dimethyl-sulfoxide surfactant-free microemulsion (CID-SFME) scheme without a capping agent. We found that with an increase in the microemulsion concentration and particle size, there was a simultaneous reduction in band gap due to the quantum confinement effect. Furthermore, a microemulsion concentration of 0.0125 M was the optimum microemulsion concentration for the growth of uniformly distributed, small particle-sized, ordered PbS nanoparticles using CID-SFME at a constant temperature and other effective parameters. From the results obtained in the present study, we believe that during the reaction, it was not the low values of viscosity and dielectric constant that were responsible for keeping PbS stabilized inside the core of the micelle of the CID microemulsion, but rather the van der Waals forces that also controlled the growth of spherical PbS. We fabricated a highly stable FTO/TiO2/PbS/PANI/NiS/C photodetector at an optimized microemulsion solution concentration. The fabricated photodetector showed a rise time of ∼0.39 s and a decay time of ∼0.22 s, with a photoresponsivity of ∼5.466 μA W−1, external quantum efficiency of ∼0.116 × 10⁻⁴%, and detectivity of 6.83 × 10⁷ Jones. Therefore, the CID-SFME scheme is an easy, low-cost route to fabricate efficient, precise, stable, and fast-switching photodetector devices.
1. Introduction
In modern materials science, the synthesis of nanomaterials has attracted much attention because of their remarkable physical and chemical properties.1,2 Owing to the tunable properties of nanomaterials, semiconductor nanomaterials are often synthesized and investigated via traditional routes to obtain desired morphologies and dimensions.1 PbS is a group IV–VI binary element with a low band gap, large exciton Bohr radius (18 nm), extreme quantum confinement, high carrier mobility, low thermal conductivity, and other properties, which make strong quantization effects visible even for large particles or crystallites.3 Hence, it is a promising candidate to play an active role in various optoelectronic devices, such as infrared photodetectors,4 solar cells,5–8 infrared light-emitting diodes (LEDs),9 thermoelectric cells,10 near-infrared light-emitting field-effect transistors,11 and fillers in polymer nanocomposites,12 and other fields such as telecommunications and biomedical applications.3Usually, chemical routes are preferred for the synthesis of nanostructures owing to the simplicity and availability of many controlling key parameters. These chemical preparation methods include hydrothermal, solvothermal, chemical vapor deposition, ultrasonic, microwave approach, electrodeposition, sol–gel, in situ polymerization, intercalation, exfoliation, solution mixing process, and melt mixing process. The utilization of capping agents in synthesizing nanostructures has been observed to inhibit the inherent and distinctive features of nanomaterials, including their optical and electrical properties. Consequently, achieving the controlled synthesis of nanostructures in the quantum regime via a chemical route without capping agents poses a difficult challenge. Thus, searching for new preparative strategies that can avoid capping agents and retain the original properties of nanostructures has become essential.
The surfactant-free microemulsion (SFME) scheme has emerged as a promising approach for the controlled synthesis of nanostructures without the need of capping agents. SFME has been reported for the successful synthesis of PbS nanostructures with a variety of dimensions and morphologies, including clover-like cube-shaped, flower-shaped nano(micro)structures, dendrite-like nanostructures, closed PbS nanowires, and nanorods. The SFME is a facile and expeditious method for nanostructured synthesis and exhibits significant potential for scalability in industrial applications. Forming a microemulsion is one of the reliable ways of synthesizing nanoparticles. Microemulsions are optically isotropic, transparent, and thermodynamically stable systems containing water, oil, a surfactant, and cosurfactant.13 Our previous reports described the synthesis of SnS nanoparticles using a chlorobenzene:methanol:ethylene glycol (CME) surfactant-free microemulsion (SFME) scheme14 by varying the solution concentration and reaction temperature. However, microemulsions can also be prepared without traditional surfactants with the right oil, water, and amphisolvent composition. Amphisolvents can dissolve both oil and water. In this context, Winsor's initial dispersion phase, known as the oil-in-water phase, was employed for synthesizing nanoparticle surfactant-free microemulsions, offering several advantages, including precise control over the nanoparticle size during synthesis. Typically, polar liquids are designated as the aqueous phase due to their hydrophilic properties, while non-polar liquids are categorized as the oily phase due to their hydrophobic characteristics, and amphiphilic liquids play a crucial role in achieving a thermodynamically stable and optically isotropic dispersion of two immiscible liquids.
This paper describes a pioneering route for the controlled synthesis of PbS nanoparticles in the quantum-dot regime. The microemulsion scheme used here was a transparent ternary mixture of cyclohexane (non-polar component), DMSO (polar component), and IPA (amphiphilic surfactant-like component). This report also describes the use of the microemulsion solution concentration as a critical parameter to control the size of the nanoparticles. Again, during the reaction, the probable existence of synthesized PbS nanoparticles was also examined to elaborate the growth mechanism. In addition, we successfully fabricated an efficient photodetector based on PbS nanoparticles synthesized with the optimum microemulsion concentration. This work aimed to develop an easy and low-cost route to fabricate efficient, precise, stable, and fast-switching photodetector devices using synthesized PbS nanoparticles.
2. Experimental
2.1. Preparation of CID-SFME
Generally, for nanostructure synthesis, immiscible solvents are preferred for preparing the SFME scheme to maintain orthogonality. However, tests for selection of proper solvents was carried out by considering the solubility and reactivity of the source materials of the precursor solutions. Fortunately, we found cyclohexane:dimethyl sulfoxide to be the best-suited pair of immiscible solvents for synthesizing PbS nanoparticles to maintain orthogonality. However, owing to its miscibility in both cyclohexane (CyHX) (oil phase) and dimethyl sulfoxide (DMSO) (water phase), isopropanol (IPA) behaves like a surfactant and plays a vital role in forming the CID microemulsion. Boutonnet et al.15 demonstrated that the balance between the hydration force and entropy enabled the formation of a stable microemulsion of three solvents, in which two immiscible solvents maintained their orthogonality after mixing. However, the third component of the mixture, isopropanol (hydrotrope), combined these owing to the miscibility of the hydrotrope in any proportion.In this study, we demonstrated the use of the CID-SFME scheme for synthesizing PbS nanostructures. Because of its miscibility in both CyHX and DMSO components of the CID scheme, IPA played the role of hydrotrope to form a microemulsion. During the reaction, it could obviously maintain the thermodynamic stability of the microemulsion. Otherwise, there would have been a strong possibility of altering the reaction, thus influencing the properties of synthesized nanomaterials. Hence, to maintain the thermodynamic stability of the microemulsion, it was essential to identify the relation between the orthogonal solvents and surfactant-like components of SFME after selecting the solvent pair. Here, we experimentally checked the stability of CID-SFME by varying the respective amount of CyHx![[thin space (1/6-em)]](https://www.rsc.org/images/entities/char_2009.gif) :DMSO solvents and the required amount of IPA to form the stable microemulsion. This effort elucidated the experimentally optimized relation between a mixture of CyHX and DMSO components with particular ratios and the required amount of IPA.
:DMSO solvents and the required amount of IPA to form the stable microemulsion. This effort elucidated the experimentally optimized relation between a mixture of CyHX and DMSO components with particular ratios and the required amount of IPA.
The typical experiments for optimization were carried out simply by visual observations with 30 s bath sonication at laboratory conditions, with an ambient temperature of 25 °C and relative humidity of ∼40%, and recording the amount of the IPA required in a mixture of CyHX and DMSO components for different ratios. As the CyHx and DMSO components were mutually immiscible, we found a bilayered mixture of both phases. After the addition of a small amount of IPA (100 μl) with 30 s bath sonication, the boundary of this bilayered mixture was shifted (either up or down, depending on the selected CyHx and DMSO ratio) due to the formation of the partial microemulsion. The procedure was repeated until a certain critical amount of IPA was determined. At this stage, the boundary of this bilayered mixture vanished, indicating the formation of the stable microemulsion. The values of the calibration obtained are shown in Table 1.
| CyHX | DMSO | IPA | DMSO/CyHx |
|---|---|---|---|
| 4.0 | 1.0 | 1.4 | 0.25000 |
| 3.0 | 2.0 | 1.8 | 0.66667 |
| 2.5 | 2.5 | 2.0 | 1.00000 |
| 2.0 | 3.0 | 1.9 | 1.50000 |
| 1.0 | 4.0 | 1.6 | 4.00000 |
This relationship allowed plotting a calibration curve for the CID SFME scheme, as shown in Fig. 1. In our previously published study,14 when methanol was added in quantities below a critical threshold, we observed a white-turbid mixture of immiscible solvents, indicating partial emulsion formation. However, when methanol was added in an optimal critical amount, the white-turbid mixture of immiscible solvents transformed into a clear, transparent solution without any distinct phases. This transformation signified the creation of a thermodynamically stable microemulsion. The calibration curve generated from our experiments provided empirical equations that were invaluable for statistically estimating the required amount of isopropanol (IPA) for specific ratios of dimethyl sulfoxide (DMSO) and cyclohexane (CyHx) components in the CID SFME scheme. Importantly, this calibration curve also enabled us to choose an appropriate ratio, effectively addressing issues related to the solubility limits of the source materials within the microemulsion components.16
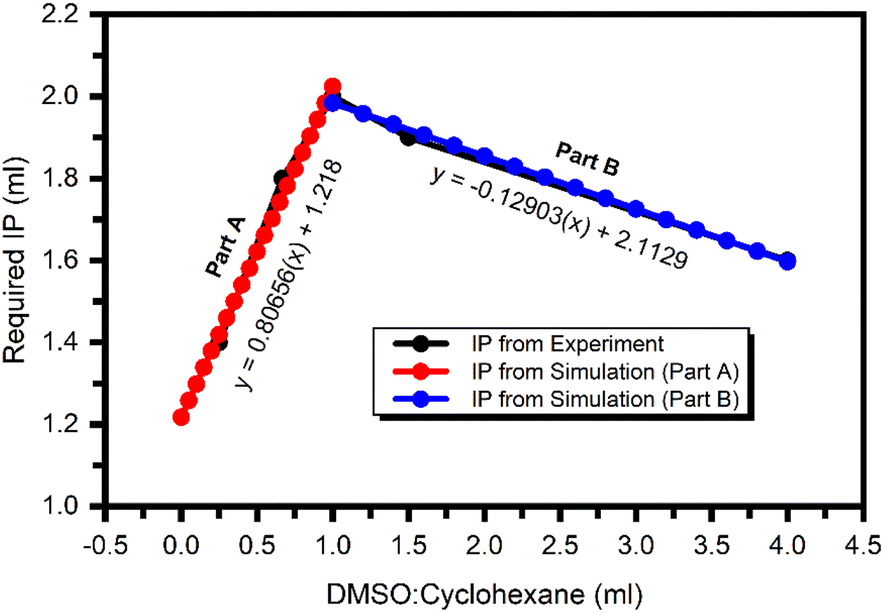 | ||
| Fig. 1 Calibration curve of the CID-SFME scheme for determining the stability of microemulsion at different ratios of components. | ||
The empirical equations obtained from the calibration curve for the CID SFME scheme are given below,
| Part A: If DSMO/CyHx ≤ 1, y = 0.80656(x) + 1.218 | (1) |
| Part B: If DSMO/CyHx ≥ 1, y = −0.12903(x) + 2.113 | (2) |
Part A of the curve is applicable only when the value of the DMSO:CyHx ratio is less than 1. However, Part B is helpful when the amount of CyHx is a minor portion of the CID compared to DMSO. Both equations are valid at the curve's apex when DMSO/CyHX = 1 (50:50%). The extrapolated values for a particular ratio of DMSO and CyHx components of the CID SFME scheme and the required amount of IPA for stabile microemulsion are listed in Table S1 (see ESI†).
2.2. Synthesis of PbS nanoparticles
In a typical synthesis of PbS nanoparticles with the help of the CID SFME scheme, lead acetate [Pb(C2H3O2)2] and sodium sulfide (Na2S·XH2O) were used as Pb2+ and S−2 ionic source materials, respectively. However, owing to the solubility limit of Na2S·XH2O in aprotic polar DMSO in the presence of non-polar CyHx, we chose a 1:4 ratio of the CyHx and DMSO components. First, a thermodynamically stable CID microemulsion was prepared by adding 10 ml of CyHx into 40 ml of DMSO, and then 17 ml of IPA was added dropwise with ultrasonic bath sonication. This ternary mixture was separated into two equal parts to prepare an equimolar solution of Pb2+ and S−2 ionic source materials. An appropriate amount of Pb2+ and S−2 ionic source materials was separately dissolved into these halves to form an equimolar microemulsion solution at room temperature and 40% relative humidity. Then, the S−2 ionic solution was slowly added dropwise into the Pb2+ solution with vigorous stirring for 5 min. The colorless solution turned dark brown/black, indicating PbS nanoparticle formation. After total mixing, the solution was continuously stirred for the next 10 min. After 10 min stirring, the product was washed and separated with methanol three times using centrifugation and separation; specifically, the product was centrifuged at 4500 rpm for 7 min. Finally, the obtained product was washed once with acetone and then allowed to dry at 80 °C on a hot plate and stored for further investigations. Since the microemulsion concentration was selected as a critical parameter to tune the reaction properties for synthesizing PbS nanoparticles, a similar procedure was repeated for five solutions with different microemulsion concentrations of 0.1, 0.05, 0.025, 0.0125, and 0.00625 M.
2.3. Reaction mechanism
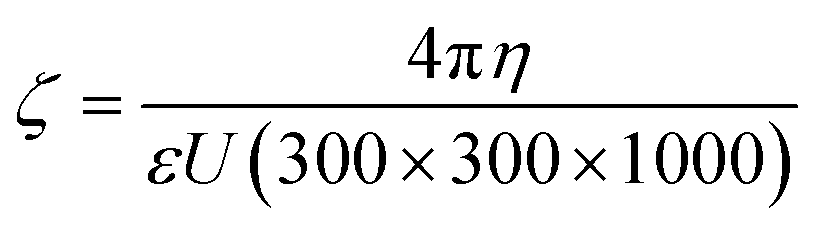
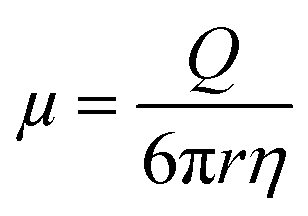
Lead acetate [Pb(C2H3O2)2] and sodium sulfide (Na2S·XH2O) were independently dissolved in half CID microemulsion to produce solutions containing Pb2+ and S−2 ions, respectively. Subsequently, upon combining these distinct Pb2+ and S−2 ion solutions and subjecting them to continuous stirring, the collision of ionic micelles took place.As a result, S−2 ions diffused into the Pb2+ ionic micelle to form a dark brown/black color PbS molecule. As the Pb2+ ion is heavier (ionic radius of Pb2+ = 0.119 nm, density = 11.34 g cm−3) than the S−2 ion (ionic radius of S−2 is 0.184, density = 2 g cm−3), S−2 ions will diffuse into the micelles of Pb2+ cationic precursor solution. Fig. 2 schematically illustrates the diffusion process of the precursor solutions into each other. After the reaction, the PbS will diffuse into the core of the micelle, which is CyHx (oil phase) of CID SFME, and hence, the growth of spherical PbS nanoparticle in the quantum regime was possible. The confirmation of the existence of PbS inside the core of the micelle was validated by several experimental techniques. Generally, owing to their high surface area and energy, nanoparticles tend to agglomerate easily. In order to achieve a stable dispersion, it is necessary to prevent the agglomeration of individual particles within the solution. This can be done by adding a stabilizing agent inside the dispersion solution. However, the stabilizing agent will remain on the surface and seriously influence the properties of dispersed material. Hence, the SFME has an advantage. It has been reported that the greater the zeta potential, the greater the stability of nanoparticles in solution.17 The zeta potential depends on several parameters, such as the surface charges, ions adsorbed at the interface, and the nature and composition of the surrounding medium. The net charge in a specific medium depends on the particle charge and counter ions. The zeta potential is an index of the interaction between the particles. Here, we tried to explain the existence of PbS after molecular formation by consideration of the zeta potential (ζ) value using the well-known Smoluchowski's equation,
 | (3) |
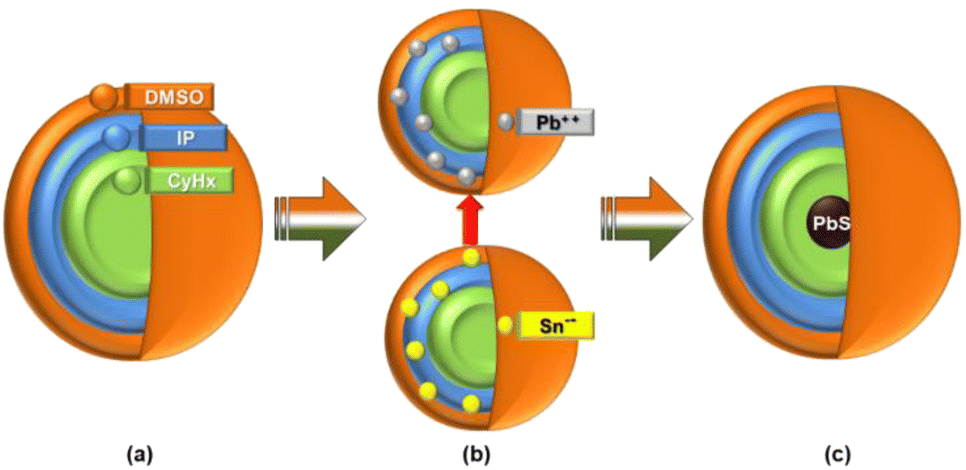 | ||
| Fig. 2 Schematic of the reaction mechanism: CID micelle (a) pure, (b) before reaction, and (c) after reaction. | ||
The zeta potential is directly proportional to the viscosity of a solution and inversely proportional to the dielectric constant and electrophoretic mobility.17 To describe the growth mechanism, we also investigated the stability and vicinity of the PbS nanoparticles in the CID SFME scheme components during the reaction. In this study, we individually dispersed the synthesized PbS (0.0125 M) nanoparticles (5 mg ml−1) in pure CyHx, IPA, and DMSO solvents, and CyHx:IPA, DMSO:IPA pair of CID SFME (for CyHx:DMSO 1:4 ratio and required IPA), with 30 min bath sonication. These solutions were then analyzed by UV-visible absorption spectroscopy. Fig. S1 (ESI†) shows the UV-visible absorption spectra recorded immediately after sonication. We analyzed and recorded data to evaluate the values of the real and imaginary dielectric constants optically, as displayed in Table 2. In the case of electromagnetic waves, the real part of the dielectric constant defines the change of the wavelength concerning that in a vacuum. However, the dielectric constant's imaginary part describes electromagnetic wave absorption.18 Because we were performing investigations through the absorbance curve, an imaginary part of the dielectric constant was considered for further studies.
| Sr. No. | Solvent or pair | Viscosity (cP) (at 28 °C) | Dielectric constant |
|---|---|---|---|
| 1 | CyHx | 0.90 | 2.47 × 10⁻⁸ |
| 2 | IPA | 2.40 | 2.07 × 10⁻⁵ |
| 3 | DMSO | 1.80 | 1.55 × 10⁻⁶ |
| 4 | CyHx:IPA | 1.65 | 9.81 × 10⁻⁴ |
| 5 | DMSO:IPA | 2.10 | 6.33 × 10⁻⁴ |
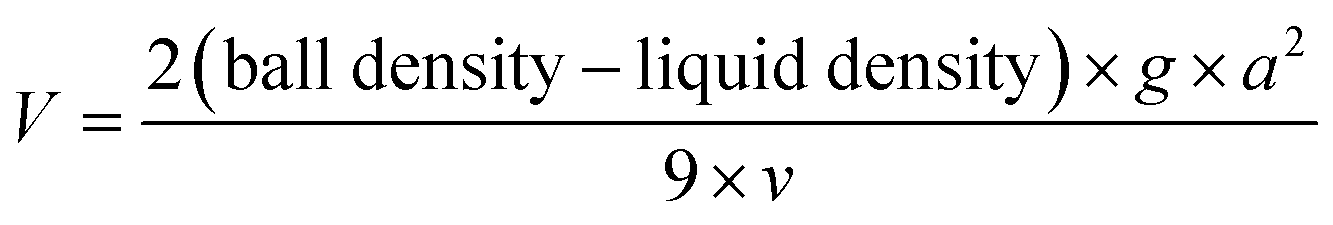
The viscosity of the pure and pair of CID components was also measured using the ball-falling method. In this method, the viscosity of the liquid (V) can be calculated using the following equation,
 | (4) |
The electrophoretic mobility (μ) is given by,20
 | (5) |
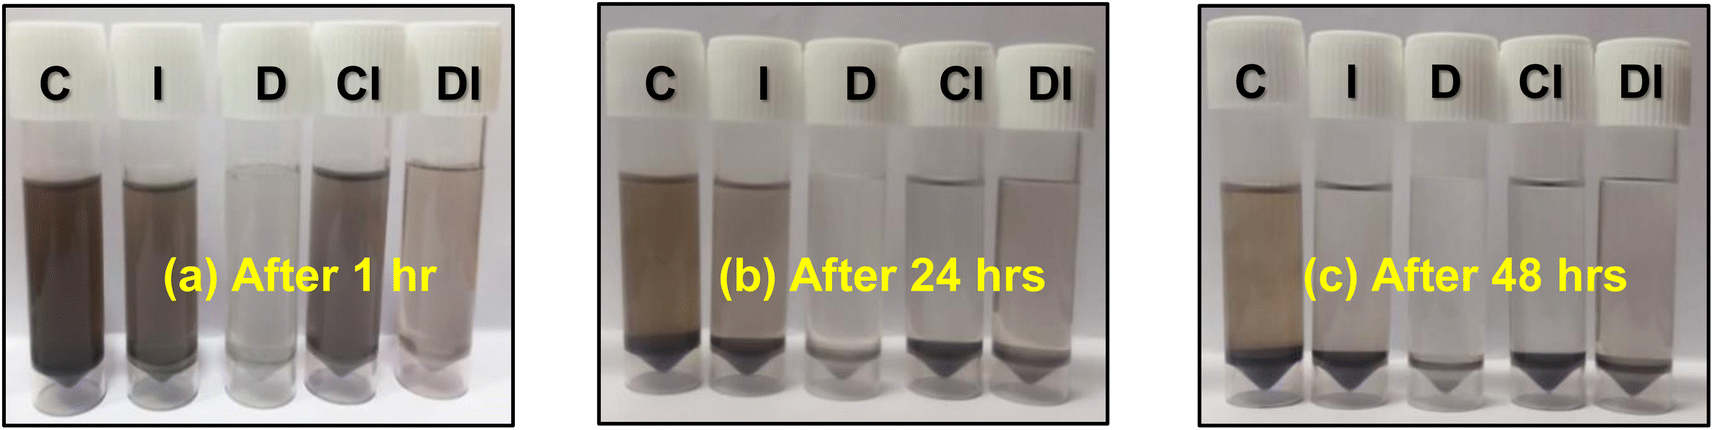 | ||
| Fig. 3 Photographs of synthesized PbS nanoparticles dispersed in pure solution and a pair of CID components after an (a) initial an hour of sonication, (b) after 24 hours, and (c) after 48 hours. | ||
Finally, considering the band energy positions, we fabricated the FTO/TiO2/PbS/PANI/NiS/C device architecture for a photodetector application and investigated its photoresponse properties. The details of the device fabrication are reported in Section III (ESI†). The details of the polyaniline (PANI) synthesis protocol and electron-transport layer nickel sulfide (NiS) are discussed in Section IV and Section V of the ESI,† respectively.
3. Results and discussion
3.1. Low-angle XRD analysis
Fig. 4 shows the XRD pattern of all the synthesized PbS nanoparticles with different microemulsion solution concentrations.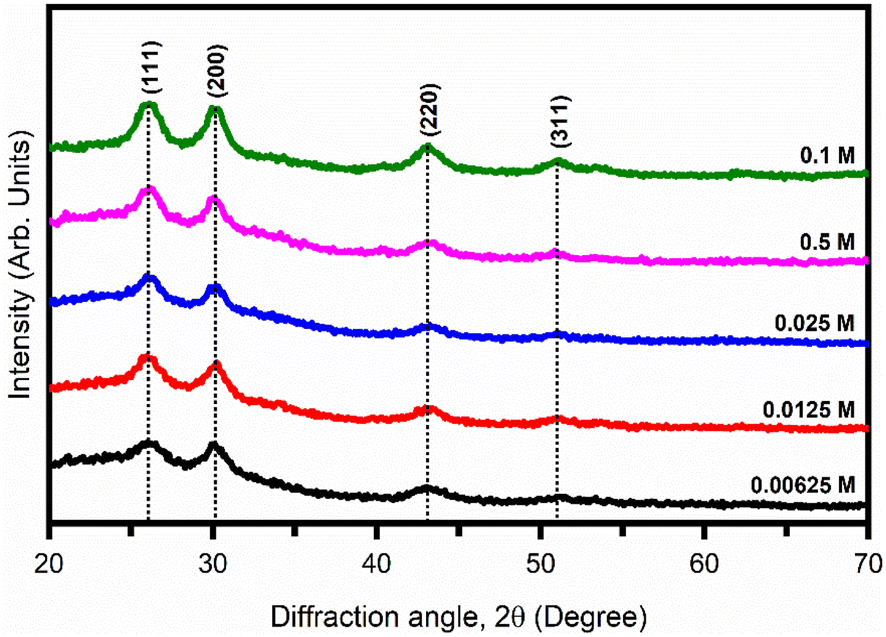 | ||
| Fig. 4 XRD patterns of PbS films for different microemulsion concentrations. | ||
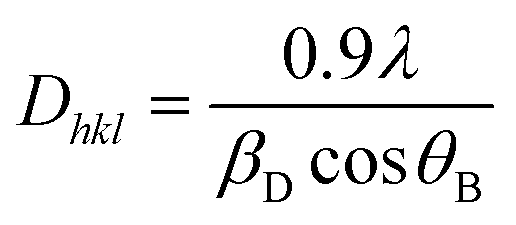
The diffracted peaks located at 2θ ∼ 26.05°, 30.16°, 43.12°, and 51.06° values corresponding to (111), (200), (220), and (311) planes matched with the JCPDS card data # 65-0132 attributed to the cubic phase with the lattice constant a = 5.969 Å and confirmed the formation of pure PbS nanoparticles. No other impurity peaks were found in the XRD pattern, indicating the pure phase of PbS. Broadening of the XRD diffraction peaks was observed and was the result of the nano-sized PbS nanoparticles. The crystallite size was then calculated by using the Debye–Scherrer equation,21
 | (6) |
The interplanar distance of PbS was calculated using the following equation,
|
nλ = 2dhklsinθB
| (7) |
The calculated values of dhkl and Dhkl for all the samples are listed in Table 3.
| Diffraction plane | dhkl (nm) | Crystallite size (Dhkl) (nm) | ||||
|---|---|---|---|---|---|---|
| 0.00625 M | 0.0125 M | 0.025 M | 0.05 M | 0.1 M | ||
| 111 | 0.34 | 11.02 | 15.10 | 13.71 | 12.27 | 10.13 |
| 200 | 0.3 | 14.31 | 15.24 | 14.43 | 14.82 | 13.49 |
| 220 | 0.21 | 08.02 | 10.55 | 10.11 | 9.60 | 8.54 |
| 311 | 0.18 | 11.08 | 9.52 | 12.23 | 20.22 | 14.09 |
| Average size (nm) | 11.11 | 14.04 | 12.62 | 14.23 | 11.56 | |
3.2. FESEM and EDX analyses
To investigate the effect of the microemulsion concentration on the surface morphology and elemental composition, field emission scanning electron microscopy (FESEM) and energy dispersive X-ray spectroscopy (EDAX) analysis were carried out. Fig. 5(a1)–(e1) show the FESEM images of PbS thin films prepared at different microemulsion concentrations using the drop-casting method at 50 °C. The formation of spherical-shaped nano-sized PbS nanoparticles was observed, and the diameter of the nanoparticles was measured with the aid of ImageJ software. The measured values for the PbS nanoparticles diameters and respective solution concentrations are listed in Table 4.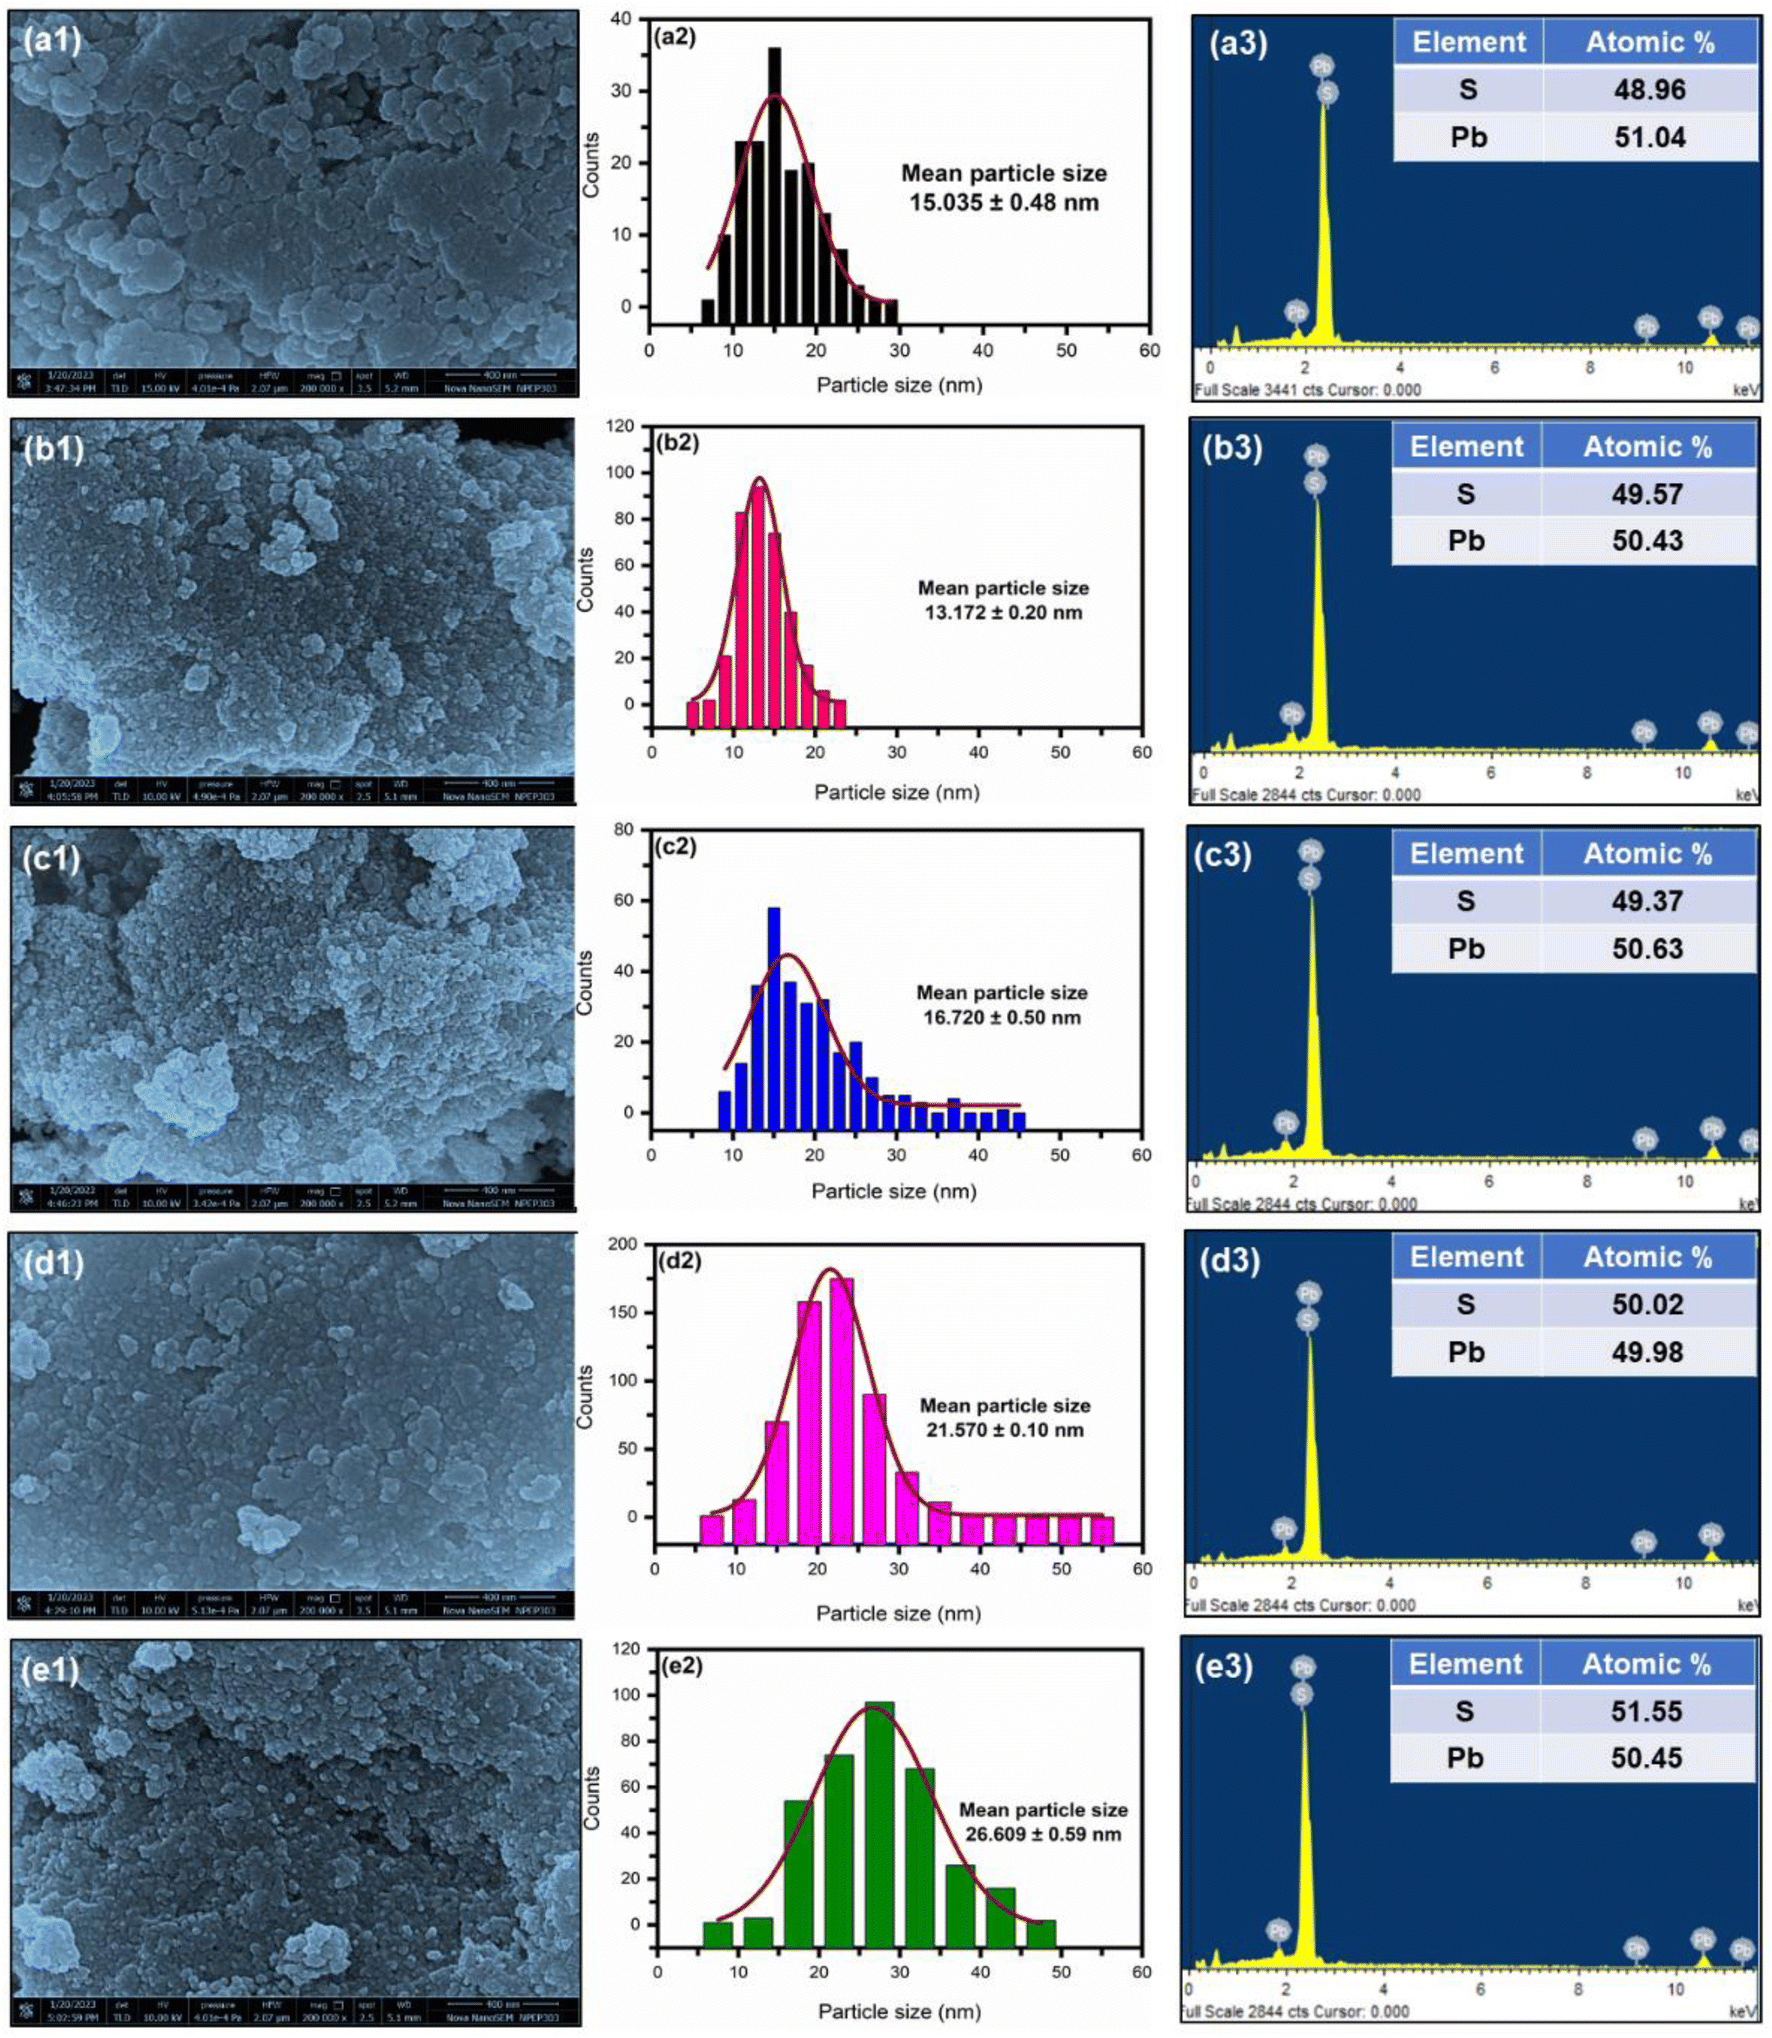 | ||
| Fig. 5 (a1–e1) FESEM images, (a2–e2) particle-size distribution analysis, and (a3–e3) EDX spectra of PbS films synthesized by the CID SFME scheme for different solution concentrations. | ||
| Sr. No. | Concentration (M) | Average particle diameter (nm) | Direct band gap (eV) |
|---|---|---|---|
| 1 | 0.00625 | 15.03 | 1.59 |
| 2 | 0.0125 | 13.17 | 1.56 |
| 3 | 0.025 | 16.72 | 1.53 |
| 4 | 0.05 | 21.57 | 1.51 |
| 5 | 0.1 | 26.91 | 1.50 |
As we increase the concentration of the microemulsion solution, an increase in average nanoparticle size was observed. In addition, the synthesized PbS nanoparticles had a smaller radius than the bulk Bohr radius (∼18 nm).1,2 Thus, the synthesized PbS nanoparticle's size came under the quantum regime. Hence, these synthesized PbS nanoparticles may show quantum confinement effects. Interestingly, it was found that when microemulsion concentration increased from 0.0125 M to 0.1 M, the average particle size increased linearly. However, below 0.0125 M, there was a deviation in the linear relationship between the microemulsion concentration and average particle size, which may be due to the increased particle-size distribution. Fig. 5(a2)–(e2) show the statistical particle-size distribution analysis for the synthesized PbS nanoparticles at different microemulsion concentrations. As can be seen, relatively narrow particle-size distributions were observed for PbS synthesized with the 0.0125 M microemulsion concentration. These results revealed that PbS synthesized with 0.0125 M solution had a high degree of dimensional uniformity compared to the other samples.
The elemental compositions of the WS2 films were determined by energy dispersive X-ray spectrometry (EDAX) coupled with FESEM. Fig. 5(a3)–(e3) illustrate the EDAX spectra of the PbS nanoparticles synthesized using the CID SFME scheme for different microemulsion solution concentrations. The EDAX spectra of all samples showed a ∼1:1 atomic ratio of Pb and S, confirming the formation of a pure PbS phase. These results were consistent with the low-angle XRD analysis. The formation of a pure phase of PbS was further confirmed by FTIR analysis (see Fig. S3, ESI†).
3.3. Optical properties investigations
UV-visible absorption spectra of the PbS thin film synthesized using the CID SFME scheme for different microemulsion solution concentrations are shown in Fig. 6. The absorption spectra showed an increase in absorbance value in the NIR and visible regions. In addition to the optical absorption response, we computed the band gap values (Table 4) of all the samples by the Tauc plot method (see ESI Fig. S2†).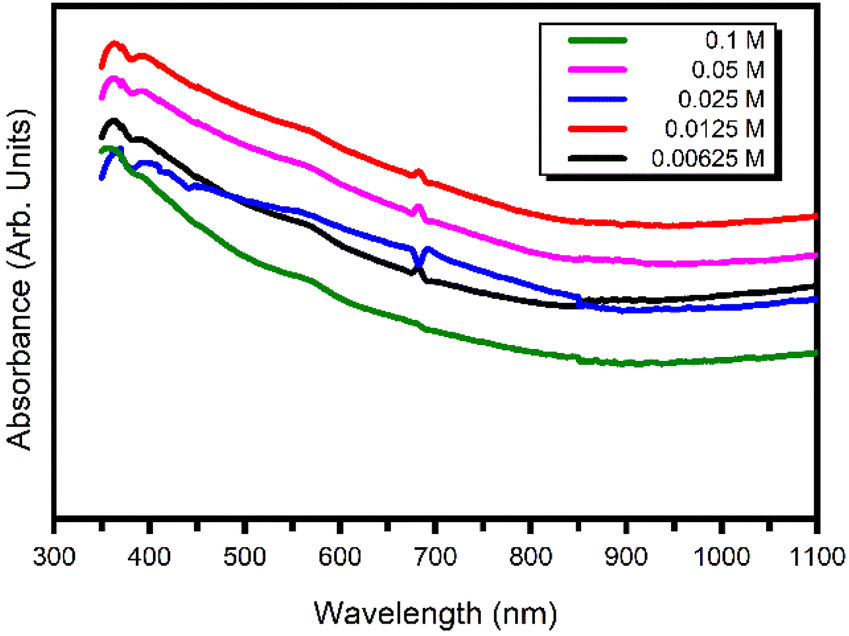 | ||
| Fig. 6 UV-visible absorption spectra of PbS nanoparticles synthesized with different microemulsion concentrations. | ||
Fig. 7 describes the relationship between the particle size and bandgap of PbS nanoparticles synthesized with different microemulsion concentrations using the CID SFME scheme. It was found that owing to the quantum confinement effect, as we increased the microemulsion concentration of the solution, there was a decrease in the optical band gap. Thus, it was possible to have precise control over the bandgap values of PbS by adjusting the concentration of the microemulsion solution within the range of 0.0125 M to 0.1 M while keeping the other system parameters constant. However, due to the wide particle-size distribution, PbS prepared with the 0.00625 M and 0.1 M microemulsion solution concentrations has lower and higher band gap limits, respectively. In other words, under the range of 0.0125 M to 0.1 M, the dimension of the PbS nanoparticles will have a stronger solitary relation with the microemulsion solution concentration at a constant temperature.
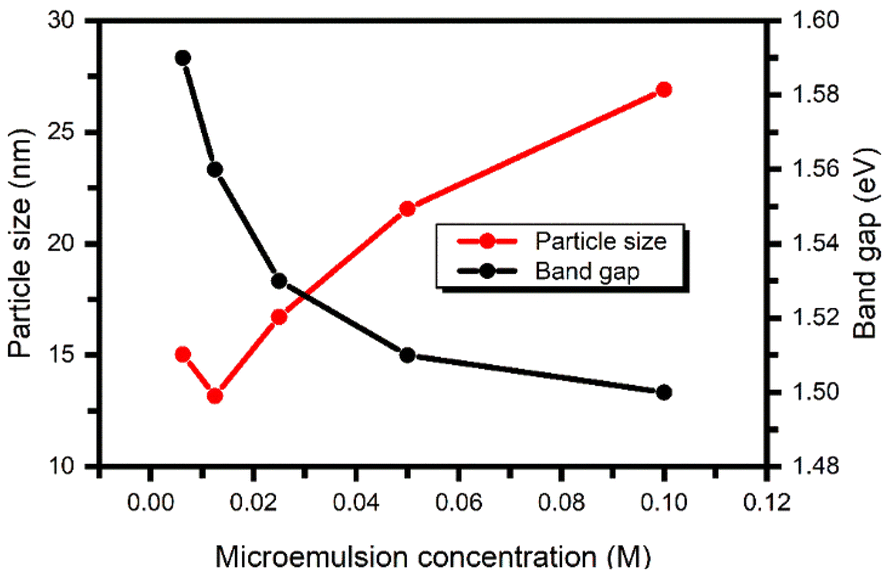 | ||
| Fig. 7 Relation between the particle size and band gap of PbS nanoparticles synthesized with different microemulsion concentrations. | ||
3.4. Photodetector properties
A photodetector operation is fundamentally based on converting absorbed photons into an electrical signal. A thorough understanding of the photodetector's fundamental operation and various related mechanisms can be found in the literature.22–24 In the present study, the PbS film synthesized at 0.0125 M microemulsion concentration exhibited high crystallinity. Furthermore, the PbS film demonstrated effective optical absorption capabilities for various wavelengths (Fig. 9). Therefore, we fabricated a PbS:PANI-based photodetector using PbS film synthesized at 0.0125 M microemulsion concentration onto an FTO substrate, following the FTO/TiO2/PbS:PANI/NiS/C configuration. Fig. 8 shows a schematic of the fabricated FTO/TiO2/PbS:PANI/NiS/C photodetector device for the present study and the corresponding energy level diagram.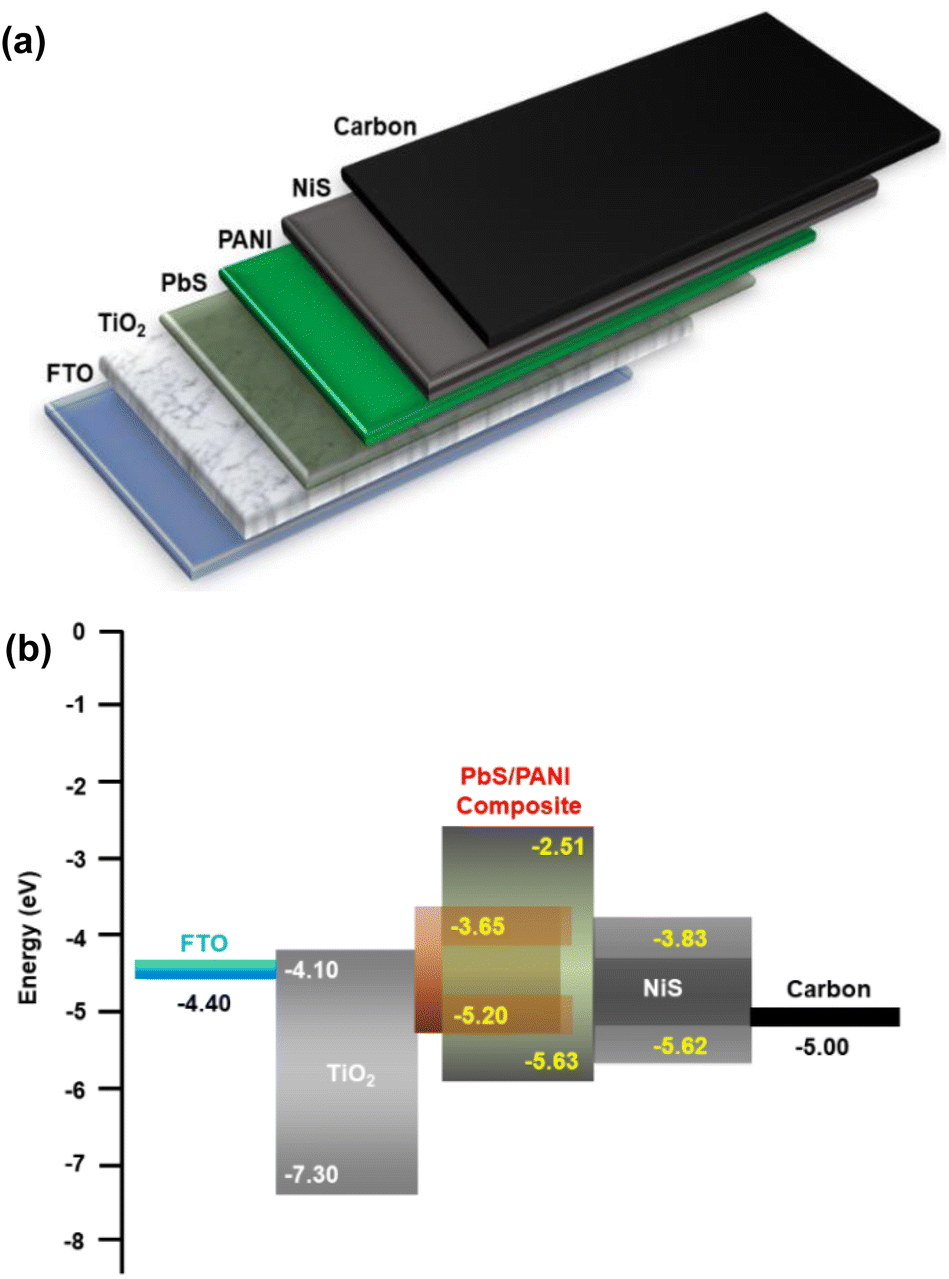 | ||
| Fig. 8 (a) Schematic of the FTO/TiO2/PbS:PANI/NiS/C photodetector device and (b) energy level diagram. | ||
TiO2 is a promising electron-transport layer (ETL) and a front contact of the device due to its wide band gap, high electron mobility, and suitable band position with the present device structure. However, NiS served as the electron-transport layer (HTL) and helped to extract photogenerated holes from the PbS:PANI composite active layer and transport them to the carbon back contact.
The photoresponse of the FTO/TiO2/PbS:PANI/NiS/C photodetector was measured under intermittent dark and white light illumination (100 mW cm−2) at a bias voltage of −0.75 V at room temperature. Fig. 9 shows the current–voltage (I–V) characteristics of the PbS:PANI-based photodetector under dark and visible light illumination conditions. The increase in current value under the illumination of white light confirmed the photoactive semiconducting behavior of the PbS:PANI composite layer.
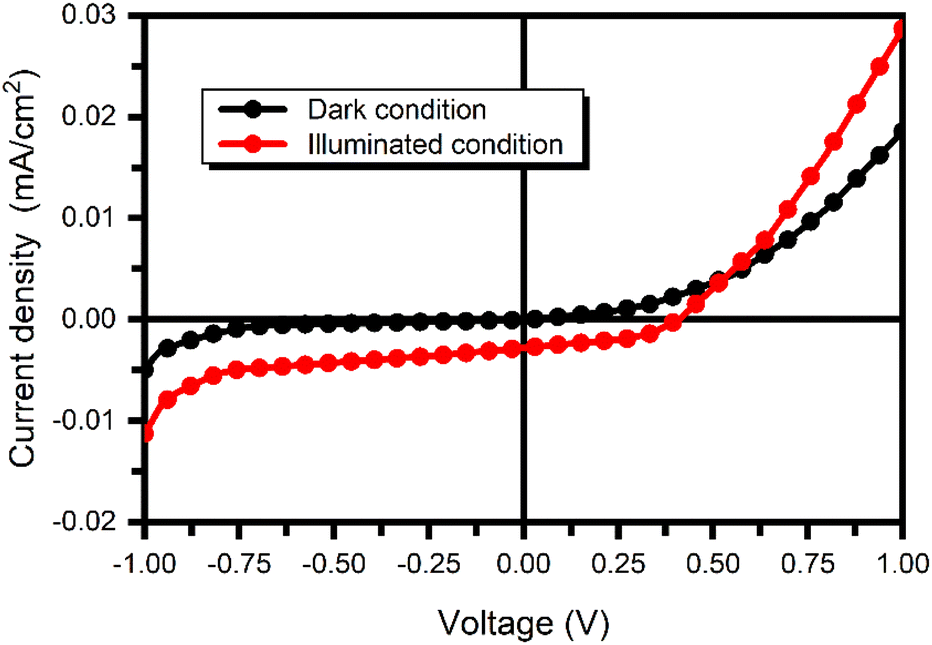 | ||
| Fig. 9 I–V characteristics of the FTO/TiO2/PbS:PANI/NiS/C photodetector in the range −1.0 V–1.0 V. | ||
Photodetectors usually operate in a reverse-biased configuration, where reverse biasing is employed to enlarge the depletion region and enhance photon absorption. In the forward bias region, which corresponds to the photovoltaic mode (ranging from 0 to 1 V), the I–V curve exhibits a diode-like behavior when the device is in the dark condition. However, once exposed to light, the photovoltaic effect causes the current to transition into the fourth quadrant. This light-induced response is crucial for the device to function as a photodetector effectively. Conversely, there was a notable and significant shift found here in the current value into the third quadrant in the reverse biasing region (from −1 to 0 V) and after exposure to light at a bias voltage of −0.75 V.
Fig. 10 shows the current versus time (I–t) plot for the PbS:PANI-based photodetector device. The PbS:PANI-based photodetector displayed a constant current over the cycles, indicating good stability and repeatability. The rise time (τRise) is defined as the time required for a photodetector to reach 90% of its maximum photocurrent value from its dark current value. Similarly, the decay time (τDecay) is defined as the time required for the photodetector to reach 10% of its minimum dark current value from its photocurrent value.25
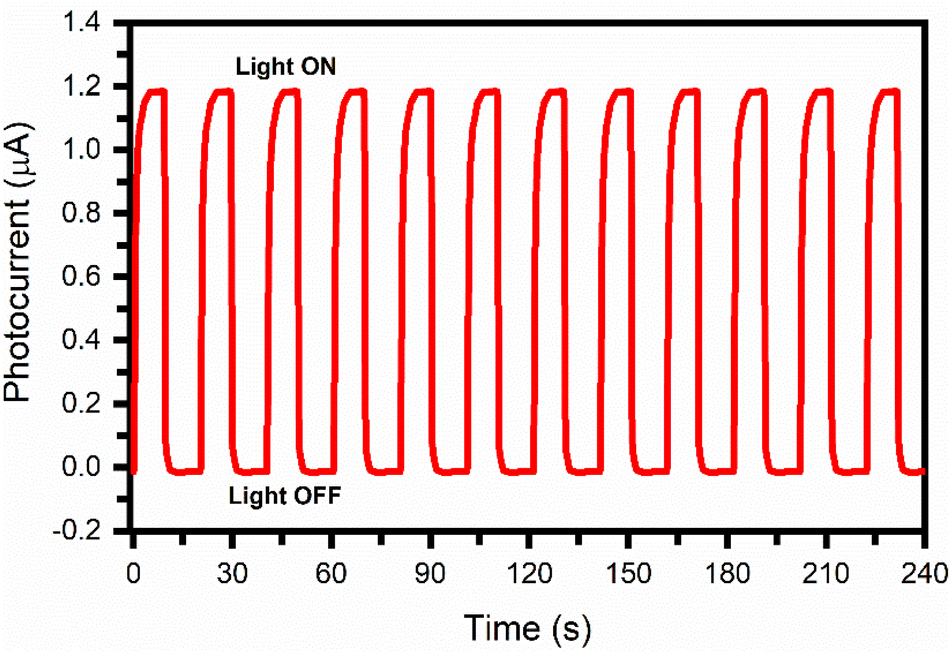 | ||
| Fig. 10 Current versus time plot for the PbS:PANI-based photodetector device at a bias voltage of −0.75 V. | ||
The photodetector's rise and decay times were calculated by enlarging a single photoresponse cycle. Fig. 11(a) shows a typical single-cycle I–t curve of the PbS:PANI-based photodetector.
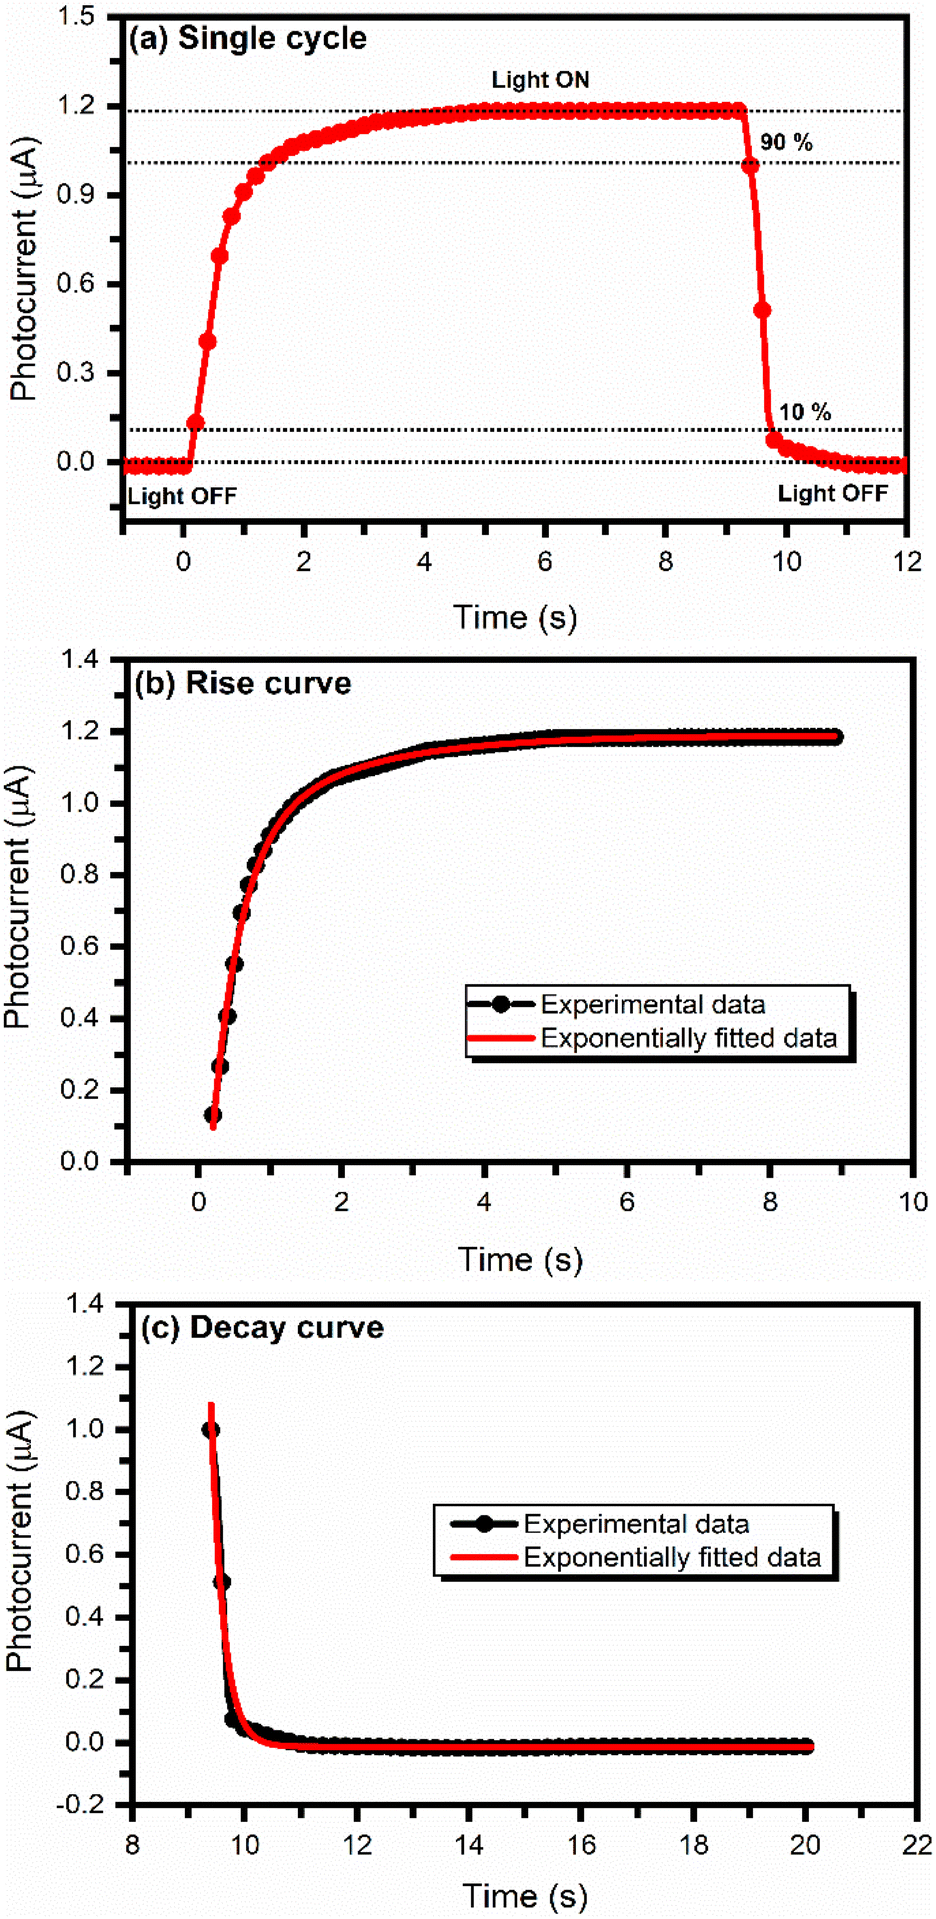 | ||
| Fig. 11 (a) Typical single-cycle I–t curve, (b) exponential fitting rise curve, and (c) exponential decay curve of the PbS:PANI-based photodetector for measuring the rise and decay time. | ||
The rise and decay processes followed an exponential law,
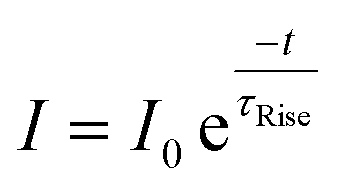 | (8) |
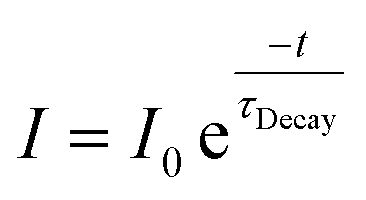 | (9) |
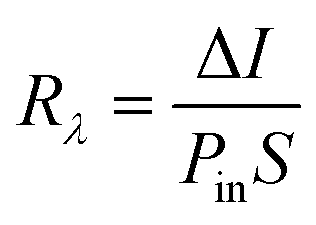
The performance of the PbS:PANI-based photodetector fabricated at 0.0125 M microemulsion concentration was further explored by calculating its photoresponsivity (R), photosensitivity (ξ), external quantum efficiency (EQE), and detectivity (D*) parameters. The photoresponsivity parameter is the photocurrent generated per unit incidence of light power density on the device27 and is given by,
 | (10) |
| τRise (s) | τDecay (s) | R (μA W−1) | ξ | EQE × 10−4 (%) | D* × 107 (Jones) |
|---|---|---|---|---|---|
| 0.39 | 0.22 | 5.466 | 41 | 0.116 | 6.82 |
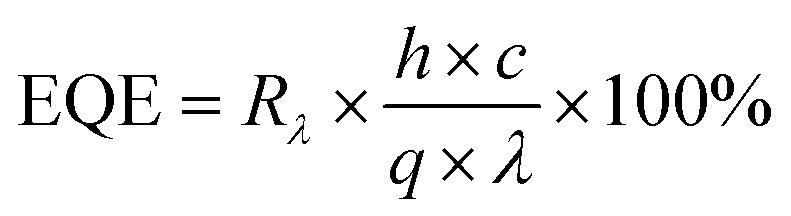
The external quantum efficiency (EQE) gives an idea about the efficiency of photodetectors in converting photons into separated charge carriers.29 It is the ratio of the number of electrons or holes converted through the stimulation of photons for an applied energy source and is given by,30
 | (11) |
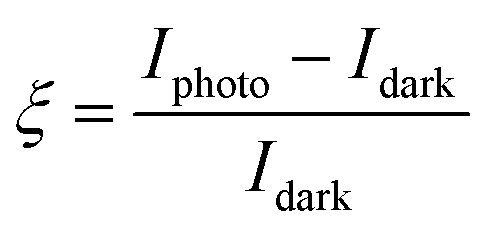
Another crucial parameter for a photodetector is its photosensitivity (ξ), which represents the relative change in current with respect to the dark current. It is the difference in current (ΔI) normalized to the dark current given by,31
 | (12) |
For photodetectors, detectivity (D*) measures the quality of the detector. It helps to compare different photodetectors with different areas and geometries. The detectivity, measured in Jones, is expressed as,32,33
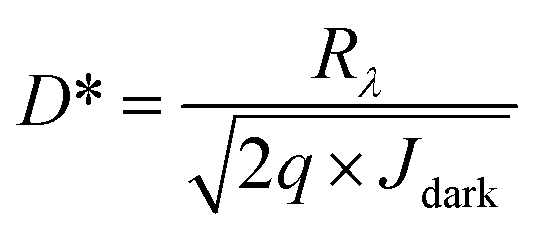 | (13) |
The calculated values of photoresponsivity (Rλ), photosensitivity (ξ), external quantum efficiency (EQE), and detectivity (D*), along with the rise (τRise) and decay times (τDecay) of the PbS:PANI-based photodetector fabricated at 0.0125 M microemulsion concentration are listed in Table 5.
4. Conclusions
In summary, we introduced a CID-SFME scheme for producing pure PbS nanoparticles with an average diameter of 13.17–26.91 nm. Our investigations revealed that the particle size increased with the increase in microemulsion concentration, whereas the band gap decreased due to the quantum confinement effect. The microemulsion solution concentration of 0.0125 M was identified as the optimal concentration for synthesizing PbS nanoparticles in the CID SFME process while keeping the temperature and other influential parameters constant. We think that the observed stability of PbS within the core of the CID microemulsion micelle could be attributed to the low viscosity and dielectric constant values. Additionally, the van der Waals forces played a crucial role in governing the growth of spherical PbS nanoparticles. Finally, we successfully fabricated a highly stable photodetector having the configuration FTO/TiO2/PbS/PANI/NiS/C using the optimized microemulsion solution concentration of 0.0125 M. This photodetector exhibited fast response characteristics, with a rise time of ∼0.39 s and a decay time of ∼0.22 s. It also displayed an impressive photoresponsivity of ∼5.466 μA W−1, an external quantum efficiency of ∼0.116 × 10⁻⁴%, and a detectivity of ∼6.83 × 10⁷ Jones. The results obtained in the present work demonstrated an easy and low-cost route to fabricate an efficient, precise, stable, and fast-switching photodetector device using the CID-SFME scheme.Author contributions
Hemant Tarkas: methodology, formal analysis, investigation, data curation, writing – original draft; Abhilasha Rokade: methodology, validation, formal analysis, investigation: Devashri Upasani: methodology, validation, formal analysis, investigation; Narendra Pardhi: methodology, validation, formal analysis, investigation; Avinash Rokde: methodology, validation, formal analysis, investigation; Jaydeep Sali: methodology, conceptualization, validation, formal analysis, investigation; Shashikant P. Patole: writing – review, editing, supervision, funding acquisition; Sandesh Jadkar: visualization, writing – review, editing, supervision, funding acquisition.Conflicts of interest
The authors declare that they have no known competing financial interests or personal relationships that could have appeared to influence the work reported in this paper.Acknowledgements
Hemant Tarkas is thankful to the Savitribai Phule Pune University (SPPU) for financial support under the post-doctoral fellowship (PDF) program. Sandesh R. Jadkar thanks the Indo-French Centre for the Promotion of Advanced Research-CEFIPRA, Department of Science and Technology, New Delhi, and the Ministry of New and Renewable Energy, Government of India, New Delhi, for special financial support. Finally, Shashikant P. Patole would like to thank Khalifa University for its financial support through the internal fund for high-quality publications.References
- M. Kaur, K. Singh, A. Vij and A. Kumar, New J. Chem., 2023, 47, 2137 RSC.
- I. A. Ovid'ko, R. Z. Valiev and Y. T. Zhu, Prog. Mater. Sci., 2018, 94, 462–540 CrossRef.
- Z. Mamiye and N. O. Balayeva, Mater. Today Sustain., 2023, 21, 100305 CrossRef.
- A. Maier, F. Strauß, P. Kohlschreiber, C. Schedel, K. Braun and M. Scheele, Nano Lett., 2022, 22, 2809–2816 CrossRef CAS PubMed.
- A. Kumar, P. R. Gahlaut and N. Gupta, Energy Storage, 2023, 5, e331 CrossRef CAS.
- M. Mohanraj, S. Aejitha, T. Govindaraj, T. Niyitanga, H. Kim and M. Shkir, J. Mater. Sci.: Mater. Electron., 2023, 34, 643 CrossRef CAS.
- Y. Liu, H. Wu, G. Shi, Y. Li, Y. Gao, S. Fang, H. Tang, W. Chen, T. Ma, I. Khan, K. Wang, C. Wang, X. Li, Q. Shen, Z. Liu and W. Ma, Adv. Mater., 2023, 35, 2207293 CrossRef CAS.
- S. Liu, M. Y. Li, K. Xiong, J. Gao, X. Lan, D. Zhang, L. Gao, J. Zhang and J. Tang, Nano Res., 2023, 16, 2392–2398 CrossRef CAS.
- F. Li, J. J. Liu, Q. Xu, R. Chang, L. Wang, Z. Wu, H. Shen and Z. Du, J. Phys. Chem. Lett., 2023, 14, 4252–4258 CrossRef CAS PubMed.
- R. Cheng, D. Wang, H. Bai, J. Wu, W. Liu, L. D. Zhao, X. Tang and G. Tan, Acta Mater., 2021, 220(021), 117337 CrossRef CAS.
- D. Bederak, A. Shulga, S. Kahmann, W. Talsma, J. Pelanskis, D. N. Dirin, M. V. Kovalenko and M. A. Lo, Adv. Electron. Mater., 2022, 8, 2101126 CrossRef CAS.
- M. Yousefi, F. Gholamian, D. Ghanbari and M. S. Niasari, Polyhedron, 2011, 30, 1055–1060 CrossRef CAS.
- P. A. Winsor, Trans. Faraday Soc., 1948, 44, 376–398 RSC.
- H. Tarkas, D. Marathe, M. Mahajan, F. Muntaser, M. Patil, S. Tak and J. Sali, Mater. Res. Express, 2017, 4, 025018 CrossRef.
- M. Boutonnet, J. Kizling, P. Stenius and G. Maire, Colloids Surf., 1982, 5, 209–225 CrossRef CAS.
- H. Tarkas, S. Tak, V. Deo, S. More, D. Upasani, S. Ghosh and J. Sali, J. Nano- Electron. Phys., 2000, 12, 06014 Search PubMed.
- T. Pradeep, NANO: The Essentials: Understanding Nanoscience and Nanotechnology, Tata McGraw-Hill Publishing Company Limited, 2007 Search PubMed.
- J. Petzelt and I. Rychetský, Ferroelectrics, 2000, 236, 223–234 CrossRef.
- N. Kumar, K. Biswas and C. Sekhar, Langmuir, 2019, 35, 2668–2673 CrossRef PubMed.
- M. Stalcup, Chiral Separations by Capillary Electrophoresis, Elsevier B. V., 2006, p. 241 Search PubMed.
- A. L. Patterson, Phys. Rev., 1939, 56, 978–982 CrossRef CAS.
- F. Cao, X. Xu, D. Yu and H. Zeng, Nanophotonics, 2021, 10, 2221–2247 CrossRef CAS.
- R. Wang, J. Wang, S. Tan, Y. Duan, Z. K. Wang and Y. Yang, Trends Chem., 2019, 1, 368–379 CrossRef CAS.
- F. H. L. Koppens, T. Mueller, P. Avouris, A. C. Ferrari, M. S. Vitiello and M. Polini, Nat. Nanotechnol., 2014, 9, 780–793 CrossRef CAS PubMed.
- D. Guo, Y. Su, H. Shi, P. Li, N. Zhao, J. Ye, S. Wang, A. Liu, Z. Chen, C. Li and W. Tang, ACS Nano, 2018, 12, 12827–12835 CrossRef CAS PubMed.
- Z. Ou, Y. Yi, Z. Hu, J. Zhu, W. Wang, H. Meng, X. Zhang, S. Jing, S. Xu, F. Hong, J. Huang, J. Qin, F. Xu, R. Xu, Y. Zhu and L. Wang, J. Alloys Compd., 2020, 821, 153344 CrossRef CAS.
- S. Lin, Y. Lu, J. Xu, S. Feng and J. Li, Nano Energy, 2017, 40, 122–148 CrossRef CAS.
- P. S. Shewale and Y. S. Yu, J. Alloys Compd., 2016, 654, 79–86 CrossRef CAS.
- B. Ezhilmaran, A. Patra, S. Benny, M. R. Sreelakshmi, V. V. Akshay, S. V. Bhat and C. S. Rout, J. Mater. Chem. C, 2021, 9, 6122–6150 RSC.
- N. Huo and G. Konstantatos, Adv. Mater., 2018, 30, 1801164 CrossRef PubMed.
- D. Mottram, Y. H. Lin, P. Pattanasattayavong, K. Zhao, A. Amassian and T. D. Anthopoulos, ACS Appl. Mater. Interfaces, 2016, 8, 4894–4902 CrossRef PubMed.
- P. H. Chang, C. S. Li, F. Y. Fu, K. Y. Huang, A. S. Chou and C. I. Wu, Adv. Funct. Mater., 2018, 28, 1800179 CrossRef.
- Y. Wang, R. Fullon, M. Acerce, C. E. Petoukhoff, J. Yang, C. Chen, S. Du, S. K. Lai, S. P. Lau, D. Voiry, D. O'Carroll, G. Gupta, A. D. Mohite, S. Zhang, H. Zhou and M. Chhowalla, Adv. Mater., 2017, 29, 1603995 CrossRef PubMed.
Footnote |
| † Electronic supplementary information (ESI) available. See DOI: https://doi.org/10.1039/d3ra07679b |
| This journal is © The Royal Society of Chemistry 2024 |