 Open Access Article
Research on the environmental stability performance of chromite ore processing residue solidified products†
Ming Xia *abc,
Pengyue Sua,
Hao Wanga,
Huicheng Lua,
Haiyu Chena,
Shujie Zhao*d and
Dongwei Li*e
aSchool of Environmental and Chemical Engineering, Jiangsu Ocean University, Lianyungang, 222005, China. E-mail: xiaming@jou.edu.cn
bJiangsu Institute of Marine Resources Development, Jiangsu Ocean University, Lianyungang, 222005, China
cJiangsu Key Laboratory of Function Control Technology for Advanced Materials, Jiangsu Ocean University, Lianyungang, 222005, China
dSchool of Safety Science and Engineering, Anhui University of Science and Technology, Huainan, 232001, China. E-mail: zsj9506@163.com
eState Key Laboratory of Coal Mine Disaster Dynamics and Control, Chongqing University, Chongqing, 400044, China. E-mail: litonwei@cqu.edu.cn
First published on 3rd January 2024
Abstract
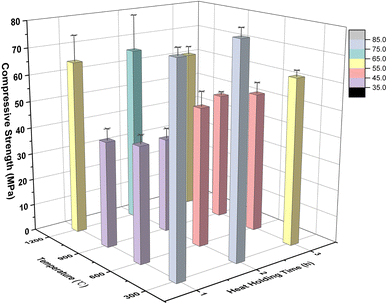
Chromite ore processing residue (COPR) is a hazardous waste because of leachable chromium, especially Cr(VI). Therefore, ascorbic acid (AA) and blast furnace slag (BFS) have been used to detoxify and solidify COPR. On this basis, environmental stability experiments with high temperature and freeze–thaw cycles were carried out to explore the stability performance of a solidified body with 40% COPR. The environmental stability performance was analyzed through changes in edge length, mass loss, compressive strength development, and leaching concentration of Cr(VI). The result indicated that the high-temperature environment had much more effect on the solidified body than the freeze–thaw cycle environment in these four aspects: after being maintained at 900 °C for 2 h, the compressive strength of the solidified bodies reached its minimum value (35.76 MPa). However, in the freeze–thaw cycle experiments, the compressive strength of the solidified bodies consistently remained above 80 MPa, and the leaching of hexavalent chromium was below the limit (5 mg L−1). In addition, X-ray diffraction (XRD) and Fourier transform infrared spectrometry (FTIR) analysis verified that COPR was effectively solidified through physical and chemical means. Moreover, high temperature changes the molecular structure of the solidified body, thus reducing the compressive strength and curing ability of the solidified body, while the freeze–thaw cycle experiment has little effect on it.
1. Introduction
Chromite ore processing residue (COPR) is a kind of hazardous waste because of the existence of highly leachable and carcinogenic hexavalent chromium (Cr(VI)), which is generated during chromium salt production. While chromium salt is an important strategic resource which is widely used in electroplating, tanning, chemical reagents, wood preservatives, ceramics, dyes, and pigments.1,2 On the one hand, inappropriate disposal of COPR occupies a large amount of land. On the other hand, the leaching of Cr(VI) from COPR pollutes farmland and water resources and ultimately threatens human life.3,4 Additionally, the susceptibility of Cr(VI) causes some disorders such as skin allergies, erosive rhinitis, emphysema, bronchiectasis, and lung sclerosis in human beings.1,5,6 Consequently, the appropriate disposal of COPR brooks no delay.Technologies dealing with COPR could be divided into five main categories: (I) Solidification/stabilization (S/S) technology,7–9 which means that the chromium in COPR is transformed into states and forms that are insoluble, migratory or less toxic by physical and chemical means using some materials such as ordinary Portland cement or alkali-activated cementitious material; (II) chemical reduction technology, including dry-detoxification (utilizing some reducing gases, such as CO) and wet-detoxification (reduction of Cr(VI) to Cr(III) in the liquid phase);10–12 (III) microbial techniques,13–15 i.e. the reduction of Cr(VI) in COPR by microorganisms; (IV) resource utilization methods,16,17 in which COPR is used as an alternative material to produce certain products, transforming it into useful substances that promote the recycling of waste, such as sintered iron and glass colorants; (V) compound treatment technology,18–20 which refers to using multiple technologies at the same time. S/S is usually considered to be the best available technique to treat solid hazardous wastes because of its convenience, economy, and high efficiency.21 In particular, alkali-activated cementitious material is an excellent material used in the solidification of heavy metals because of lower CO2 emission, energy conservation, higher compressive strength and good chemical corrosion resistance.20,22
The solidification of chromite ore processing residue is based on environmental protection and resource utilization, and effectively curing harmful elements, reducing negative effects, and developing a harmless and low-emission curing process are the main development directions at this stage. New materials are being used to improve curing efficiency and quality, improve curing capacity while reducing carbon emissions, and to improve solid waste resource utilization.23 Many researchers have been focusing on the immobilization of chromium in COPR.7,9,20 Muhammad et al. 2020 (ref. 20) used composite-based geopolymer (BFS and metakaolin) and green tea synthesized nanoscale zerovalent iron (GT-NZVI) to solidify COPR, and they found that the compressive strength of the cured body with GT-NZVI particles was not greatly reduced, but the leaching toxicity was far below the safety limit (5 mg L−1), indicating that COPR was effectively solidified in the composite-based geopolymer. Sun et al. 2014 (ref. 24) applied alkali-activated cementitious material (metakaolin) and sodium sulfate (Na2SO4) together to solidify COPR, and found that the leaching concentrations of Cr(VI) and total Cr were below 5 μg mL−1 and the compressive strength of the solidified body was over 40 MPa. Yu et al. 2021 (ref. 9) conducted solidification/stabilization of alkali-activated lead-zinc smelting slag (LZSS) and COPR, and found that the highest compressive strength of alkali-activated LZSS was 84.49 MPa, and the compressive strength was reduced to 1.42 MPa when the COPR content was 40%. However, the leaching concentrations of Zn and Cr in all cured bodies were well below the critical limits.
Generally, they just considered the leaching behaviors and compressive strength development of the COPR solidified body in a normal environment and ignored them under different environmental conditions. For one thing, the results of some research indicated that the solidified body can only be used for landfill,20,22 which will cause a waste of resources. For another thing, some researchers claimed that the solidified body could be used for construction materials because of the higher compressive strength and lower leaching concentration of Cr(VI), neglecting application scenarios and uses. However, different application scenarios and uses will lead to huge changes in the environment where the solidified body is located. How to measure and evaluate the environmental stability of solidified bodies in these different scenarios is the focus of our research.
In the current study, ascorbic acid (AA) and blast furnace slag (BFS) are used to detoxify and solidify COPR. AA is an important biological reductant with a nontoxic nature found in humans and animals.25,26 While BFS is an industrial by-product discharged from a blast furnace during the smelting of pig iron.27,28 Moreover, the environmental stability performance of the COPR solidified body was studied to explore and assess its stability in different environments. The environmental stability study of a COPR solidified body refers to the environmental stability performance of the solidified body under the influence of single extreme environments, including the following two aspects: (I) a high-temperature environmental stability experiment; (II) a freeze–thaw environmental stability experiment. The experimental research provides an effective basis and reference for an expansion of the range of applications and locations of COPR products. Furthermore, technical analysis methods, such as XRD and FTIR analysis, were further used for characterization and to determine the solidification mechanism.
2. Materials and methods
2.1 Materials
The BFS used in this experiment was brought from a steel factory located in Chongqing Municipality. While COPR was fetched from the Chongqing Minfeng chemical company in Chongqing Municipality. The chemical reagents, i.e. water glass (Na2SiO3·3.3H2O), sodium hydroxide (NaOH), and AA (C6H8O6), used in this experiment were of analytical grade. Deionized water was used throughout the experiments. Based on the particle size distribution analysis depicted in Fig. S1† for COPR and the SEM images presented in Fig. S2,† it was evident that the majority of COPR particles fell within the range of 10 to 100 μm, showcasing an average particle size of 68.79 μm. These particles exhibited a small and irregular shape. At the same time, the SEM image of BFS displayed in Fig. S3† revealed that the BFS particles were generally small, measuring less than 100 μm in size, and exhibited considerable variation in size.The chemical compositions of BFS and COPR were determined by X-ray fluorescence (XRF) using the powder pressing method, and are shown in Table 1. The main chemical components of BFS were CaO, SiO2, and Al2O3 which constituted up to 86.6% of the material. In addition, 91.5% of COPR was composed of Fe2O3, Al2O3, Cr2O3, and MgO.
| Composition | COPR (wt%) | BFS (wt%) |
|---|---|---|
| Fe2O3 | 41.91 | 0.60 |
| Al2O3 | 26.10 | 14.93 |
| Cr2O3 | 13.35 | — |
| MgO | 10.16 | 7.50 |
| Na2O | 3.39 | 0.22 |
| SiO2 | 2.60 | 35.62 |
| TiO2 | 1.31 | 1.28 |
| V2O5 | 0.34 | — |
| CaO | 0.23 | 36.31 |
| NiO | 0.17 | — |
| ZnO | 0.14 | — |
| SO3 | 0.14 | 2.29 |
| MnO | — | 0.69 |
| K2O | — | 0.39 |
| Other | 0.16 | 0.17 |
2.2 Methods
| Name | BFS/g | COPR/g | Solid alkali/g | AA/g |
|---|---|---|---|---|
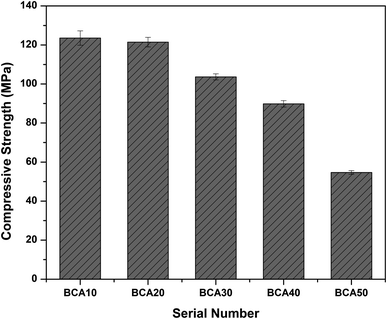
| BCA10 | 81 | 10 | 9 | 0.07 |
| BCA20 | 72 | 20 | 8 | 0.14 |
| BCA30 | 63 | 30 | 7 | 0.21 |
| BCA40 | 54 | 40 | 6 | 0.28 |
| BCA50 | 45 | 50 | 5 | 0.35 |
| Serial number | Temperature (°C) | Stay time (h) |
|---|---|---|
| 1 | 300 | 1 |
| 2 | 300 | 2 |
| 3 | 300 | 3 |
| 4 | 600 | 1 |
| 5 | 600 | 2 |
| 6 | 600 | 3 |
| 7 | 900 | 1 |
| 8 | 900 | 2 |
| 9 | 900 | 3 |
| 10 | 1200 | 1 |
| 11 | 1200 | 2 |
| 12 | 1200 | 3 |
In order to simulate the use of the solidified body in cold conditions, multiple freeze–thaw experiments help to determine the durability and stability of the solidified body, especially to simulate the exposure to cold environments when used as building materials. The advantage of designing 100 freeze–thaw experiments is that the performance changes of the solidified body can be observed during the freeze–thaw cycle, simulating the real conditions of use, and helping to predict the performance in actual use and the improvement of the conditions of the solidified body in later stages. The specific steps are as follows.
(1) After 24 d of curing time, the samples were immersed in deionized water (20 ± 2 °C) for 4 d, and then freeze–thaw experiments were carried out. The surface moisture of the samples was removed with a damp cloth, and the edge length and weight of the samples were measured.
(2) The above-mentioned specimens were placed on the test stand to ensure that the contact area was less than 80 mm2 (1/5 bottom area), the gap between the test stand and the inner wall of the box was more than 20 mm, and the distance between the specimens on the test stand was over 10 mm.
(3) When the temperature in the box dropped to −18 °C, the freeze–thaw experiment began. In addition, the time from the completion of loading samples to the temperature in the box dropping to −18 °C was controlled from 1.5 to 2 h. The temperature in the box was maintained between −20 °C and −18 °C, and the freezing time in a single freeze–thaw cycle was more than 4 h.
(4) After freezing, the deionized water (the water temperature was 18 °C to 20 °C) was added, and the addition time was less than 10 minutes. The water temperature was over 10 °C within 30 minutes and then maintained at 18 °C to 20 °C after 30 minutes. The thawing time in a single freeze–thaw cycle was more than 4 hours.
(5) After reaching the corresponding freeze–thaw times, the mass loss of the solidified body was weighed and calculated; the compressive strength loss of the solidified body was measured and calculated; the leaching concentration of Cr(VI) in the solidified body was measured, and the influence of the freeze–thaw environment was explored.
![[thin space (1/6-em)]](https://www.rsc.org/images/entities/char_2009.gif) :
:![[thin space (1/6-em)]](https://www.rsc.org/images/entities/char_2009.gif) 1, dissolved in ionized water, and the pH value was maintained at 3.20 ± 0.05 in the extraction solution. The solid–liquid ratio was 1
1, dissolved in ionized water, and the pH value was maintained at 3.20 ± 0.05 in the extraction solution. The solid–liquid ratio was 1![[thin space (1/6-em)]](https://www.rsc.org/images/entities/char_2009.gif) :
:![[thin space (1/6-em)]](https://www.rsc.org/images/entities/char_2009.gif) 10.
10.The XRD was examined by using an X-ray diffractometer (PANalytical X'Pert Powder, Holland) with CuKα radiation, and the specimens were step-scanned as random powder mounts from 5° to 90° with steps of 0.026°. While FTIR analysis was performed using a Nicolet-IS50 (Thermo Fisher Scientific Inc, USA) FTIR spectrometer in the range of 4000–400 cm−1.
3. Results and discussions
3.1 Solidification/stabilization (S/S) of COPR
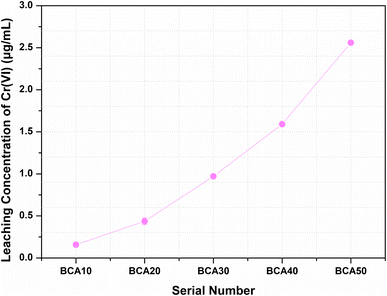
| Related instructions | Standards | Cr(VI)/(μg mL−1) |
|---|---|---|
| Hazardous waste identification | GB 5085.3-2007 | 5 |
| Common industry solid waste landfill | HJ/T 301-2007 | 3 |
| Roadbed material and concrete aggregate | HJ/T 301-2007 | 0.5 |
3.2 High-temperature environmental stability of COPR solidified bodies
 | (1) |
In order to quantify the mass loss of the solidified specimens (BCA40) at high temperature, the mass loss rate of each group of specimens was calculated according to eqn (2).
 | (2) |
Lweight,i refers to the mass loss of the solidified body in group i. Wbefore(ij) and Wafter(ij) are the average weight (g) of the solidified body in group i before and after high-temperature calcination, respectively. Additionally, i and j are the same as in eqn (1).
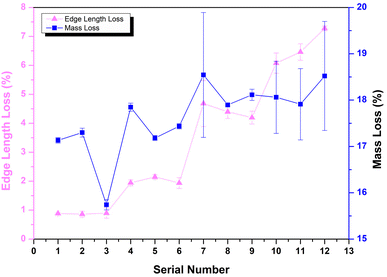
The calculation results of edge length loss and mass loss in each group of solidified bodies are shown in Fig. 3. It can be seen that the edge length loss increased gradually with an increase in calcination temperature (the abscissa serial number 1–12 in the graph is consistent with Table 3). In particular, when the temperature was less than 900 °C, the edge length loss increased by almost double with the increase in temperature, but the edge length loss rate was kept within 5%. When the calcination temperature was further raised to 1200 °C, the growth rate of the edge length loss rate decreased, but the rate of edge length loss of the solidified body reached a maximum of 7.28% (Ledge,12) after being held for 3 hours at this temperature.
According to Fig. 3, the mass loss rate of these specimens was concentrated in the range 15.5–18.5%; except for numbers 3, 9, 11 and 12, and the other 8 groups were concentrated in the range of 17.0–18.0%. In addition, the mass loss presented an increasing trend with rising temperature. The water evaporation caused by high temperature was the main reason for the mass loss.
3.3 Freeze–thaw environment stability of COPR solidified bodies
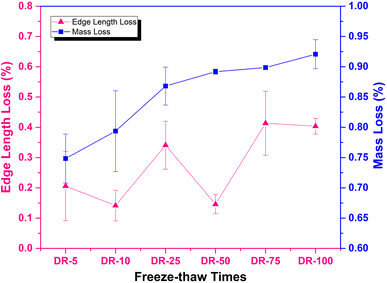
The range of edge length fluctuation was very small at different freeze–thaw times. Moreover, the edge length loss rates of each group were all less than 0.5%. It can be seen that the freeze–thaw cycle effect has little influence on the change in edge length of solidified bodies, which could be neglected. In other words, the results indicated that there was no adverse effect on the appearance and volume of the solidified bodies under freeze–thaw cycles.
It can also be seen from Fig. 6 that the weight loss rates of the solidified bodies under freeze–thaw cycle conditions were at a low level, concentrated in the range 0.7–0.95%, and were greatly reduced when compared with those in the high-temperature environment (Fig. 3). Additionally, as the number of freeze–thaw cycles increased, the weight loss rate showed an increasing trend and reached a maximum value of 0.92% when the number of freeze–thaw cycles was 100.
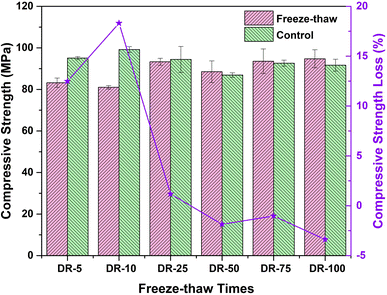
In addition, the compressive strength loss rate (Lcs, %) was calculated with eqn (3), as shown in Fig. 7. In eqn (3), Pn denotes the average compressive strength of the solidified bodies with n freeze–thaw cycles and Pcn denotes the average compressive strength of the corresponding control group.
 | (3) |
It can be seen from Fig. 7 that the compressive strength loss was over 0 when the number of freeze–thaw cycles was less than 25 (including 25), which indicated that the freeze–thaw action had an adverse effect on the compressive strength of the solidified bodies, resulting in a decrease in compressive strength. In particular, when the number of freeze–thaw cycles was 10, the peak was reached (18.31%). While this situation was somewhat different when the number of freeze–thaw cycles exceeded 25. The trend of strength loss rate was relatively stable, and the strength loss rates were all below 0, suggesting that the compressive strength of “the freeze–thaw group” increased compared with the control group, and reached an extreme value of −3.38% after 100 freeze–thaw cycles.
3.4 XRD analysis
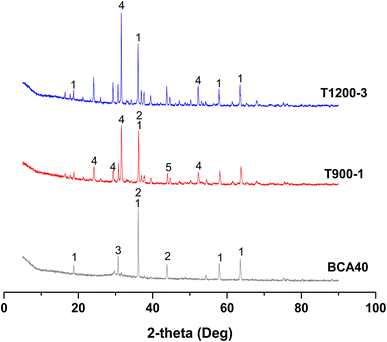
The XRD patterns of solidified bodies, i.e. BCA40, T900-1 (BCA40 at 900 °C for 1 h), and T1200-3 (BCA40 at 1200 °C for 3 h) are illustrated in Fig. 9.By and large, the XRD pattern of BCA40 was pretty different from that of T900-1 or T1200-3. For BCA40, magnesiochromite, ferroan (PDF#:09-0353), iron silicate (PDF#:80-1625), and magnesium aluminium iron oxide (PDF#:71-1235) were the principal phases. Both T900-1 and T1200-3 had identical phases (magnesiochromite, ferroan) to that of BCA40, but the peak intensities were reduced after high-temperature treatment. Additionally, new phases, i.e. gehlenite (PDF#: 77-1147) and aluminum chromium iron (PDF#: 42-1486), appeared in the T900-1 sample. While iron silicate disappeared and gehlenite was generated in T1200-3. This phenomenon could be attributed to the involvement of heavy metal chromium, released due to high-temperature damage, which further engages in the formation of a new phase. Consequently, this leads to a decrease in the leaching of hexavalent chromium at T1200-3.
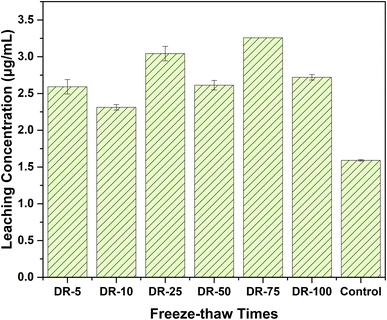
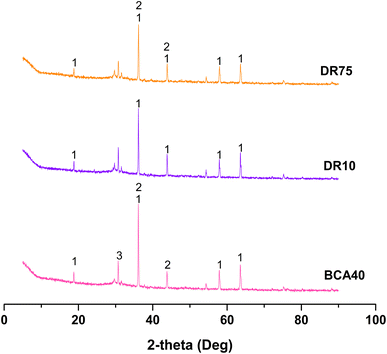
The solidified bodies after 10 and 75 freeze–thaw cycles (DR10 and DR75) were chosen as representative samples for XRD analysis in Fig. 10. Generally speaking, the XRD patterns of DR10, DR75, and BCA40 were similar. In other words, magnesiochromite, ferroan and iron silicate were the main phases, which could explain why the results for compressive strength (Fig. 7) and Cr(VI) leaching concentration (Fig. 8) changed little between DR10 (75) and BCA40.
3.5 FTIR analysis
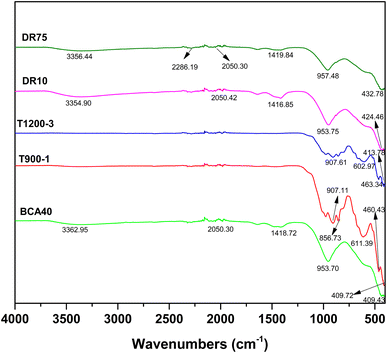
The FTIR spectra of the solidified bodies (BCA40, T900-1, T1200-3, DR10, and DR75) are presented in Fig. 11 (the FTIR spectra of COPR can be seen in Fig. S5†). The stretching bands in the range 3000 cm−1–3500 cm−1 of samples BCA40, DR10, and DR75 were due to OH vibration,21,33,34 which were formed due to the adsorption of water either on the surface or in structural cavities of the cementitious binder. However, for samples T900-1 and T1200-3, the OH stretching vibration disappeared due to the high temperature. Additionally, the 430 cm−1 band was attributed to Si–O–Si bending vibration.35 The asymmetric stretching vibration peaks between 900 cm−1 and 1000 cm−1 corresponded to Si–O and Al–O bonds. These findings were also supported by some results in the literature (Muhamad et al., 2019; San Cristobal et al., 2010; Santa et al., 2013).20,36,37 It is noteworthy that the asymmetric stretching band of Si–O–Al (Si) in BCA40 at a wavenumber of 953.70 cm−1 shifted towards a smaller wavenumber, i.e., T900-1 at 907.11 cm−1 and T1200-3 at 907.61 cm−1, which was related to the degree of polymerization of the Si–O bonds. In addition, the ‘high-temperature samples’ have a new absorption band in the wavenumber range 600–620 cm−1, corresponding to the bending vibration of Si–O–Al, which was related to the new phase gehlenite and aluminum chromium iron found in the XRD patterns.Furthermore, the asymmetric stretching band at approximately 1420 cm−1 was due to carbonates, which resulted from the reaction of alkali metal hydroxide with atmospheric CO2.36,38,39 While the asymmetric stretching band of carbonates in the wavenumber range from 1400 to 1500 cm−1 disappeared in T900-1 and T1200-3, which could be caused by the thermal decomposition of carbonates. The reaction equations related to carbonates can be seen in eqn (4)–(6). The evaporation of water and the generation of CO2 gas can lead to the formation of pores and cracks inside and on the surface of the solidified body, which in turn affected the mechanical properties of the solidified body and led to loss of compressive strength. The low-temperature state effectively prevented the loss of water within the solidified body, slowed down the alteration of molecular structure in the material, and aided in maintaining the original performance and compressive strength of the solidified body.
 | (4) |
 | (5) |
For eqn (4), ΔrGθm = (−604.03 × 1) + (−394.36 × 1) − (−1128.79 × 1) = 130.4 kJ (298.15 K, 100 kPa)
| ΔG = ΔH − TΔS (100 kPa) | (6) |
4. Conclusions
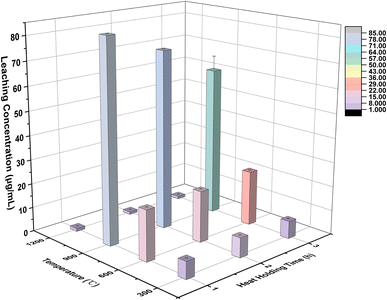
The detoxification and immobilization of COPR by AA and BFS were studied experimentally. The real properties of the cured body were simulated through a high-temperature experiments and freeze–thaw cycle experiments, and the environmental stability performance of the solidified body was analyzed through four aspects: (a) edge length loss; (b) mass loss; (c). compressive strength development and (d) leaching concentration of Cr(VI). This provides a basis and reference for the application range and application sites of curing products.(1) In the high-temperature environment, the highest edge loss and weight loss were 7.28% and 18.54% respectively. However, the free–thaw cycle environment had hardly any impact on the edge loss (<0.50%) or weight loss (≤1.00%). The lowest compressive strengths were 35.76 MPa and 81.04 MPa for high-temperature and freeze–thaw cycle environments, and the solidified body still had good mechanical properties. For the Cr(VI) leaching concentration, all the groups in the freeze–thaw cycle environment were slightly higher than in the control group (3.37 μg mL−1), but below the safety threshold (5 μg mL−1). But the high-temperature experiment found that the concentration of Cr(VI) rose from 1.11 μg mL−1 (1200 °C) to 82.95 μg mL−1 (900 °C). The stability of immobilization had deteriorated. Overall, the solidified body shows great freeze–thaw resistance but poor high-temperature stability.
(2) XRD and FTIR analyses indicated that molecular structural changes occurred in the solidified bodies under high-temperature conditions, leading to the evaporation of internal moisture and the generation of CO2, resulting in decreased compressive strength and solidification performance. However, the influence of low temperatures on the structure and solidification performance of the solidified bodies was minimal. This demonstrated that the solidified products exhibited better mechanical and solidification performance in low-temperature environments. Therefore, the later-stage application of the products could be concentrated in low-temperature environments.
Conflicts of interest
There are no conflicts of interest to declare.Acknowledgements
This study was supported by the Natural Science Foundation of Jiangsu Province (Grant No. BK20210926), National Natural Science Foundation of China (No. 52304196) and Jiangsu Ocean University Talent Introduction Start-up Fund (No. KQ21007). It was also funded by Innovation and Entrepreneurship Training Program for College Students (SY202111641637017, SZ202111641637004) and Postgraduate Research and Practice Innovation Program of Jiangsu Ocean University (KYCX2023-15). Supported by Open-end Funds of Jiangsu Key Laboratory of Function Control Technology for Advanced Materials, Jiangsu Ocean University (JSKLFCTAM202006) and Open-end Funds of Jiangsu Institute of Marine Resources Development (JSIMR202020).References
- X. Huang, Research on solidification/stabilization of chromite ore processing residue using composite materials based geopolymer and its enhanced techology, PhD thesis, Chongqing University, 2018.
- Y. Y. Wang, Z. H. Yang, L. Y. Chai and K. Zhao, J. Hazard. Mater., 2009, 169, 1173–1178 CrossRef CAS PubMed.
- Y. Y. Li, J. L. Liang, Z. H. Yang, H. Wang and Y. S. Liu, Sci. Total Environ., 2019, 658, 315–323 CrossRef CAS PubMed.
- Y. X. Liu, H. Q. Zhu, M. L. Zhang, R. Y. Chen, X. Chen, X. Zheng and Y. C. Jin, J. Membr. Sci., 2018, 566, 190–196 CrossRef CAS.
- E. Erdem, R. Donat, K. Esen and T. Tunc, Ceram.-Silik., 2011, 55, 85–93 CAS.
- Y. Y. Li, A. B. Cundy, J. X. Feng, H. Fu, X. J. Wang and Y. S. Liu, J. Environ. Manage., 2017, 192, 100–106 CrossRef CAS PubMed.
- K. S. B. Kameswari, V. Pedaballe, L. M. Narasimman and C. Kalyanaraman, Environ. Prog. Sustainable, 2015, 34, 674–680 CrossRef CAS.
- X. Huang, T. Huang, S. Li, F. Muhammad, G. J. Xu, Z. Q. Zhao, L. Yu, Y. J. Yan, D. W. Li and B. Jiao, Ceram. Int., 2016, 42, 9538–9549 CrossRef CAS.
- L. Yu, L. Fang, P. P. Zhang, S. J. Zhao, B. Q. Jiao and D. W. Li, Int. J. Environ. Res. Public Health, 2021, 18, 9960 CrossRef CAS.
- T. G. Wang, M. L. He and Q. Pan, J. Hazard. Mater., 2007, 149, 440–444 CrossRef CAS PubMed.
- Y. Wang, J. Mao, X. G. Meng, L. Yu, D. H. Deng and X. H. Bao, Chem. Rev., 2019, 119, 1806–1854 CrossRef CAS PubMed.
- D. L. Zhang, M. Y. Zhang, C. H. Zhang, Y. J. Sun, X. Sun and X. Z. Yuan, Environ. Sci. Technol., 2016, 50, 3111–3118 CrossRef CAS PubMed.
- C. Y. Lai, L. Zhong, Y. Zhang, J. X. Chen, L. L. Wen, L. D. Shi, Y. P. Sun, F. Ma, B. E. Rittmann, C. Zhou, Y. N. Tang, P. Zheng and H. P. Zhao, Environ. Sci. Technol., 2016, 50, 5832–5839 CrossRef CAS.
- G. J. Xu, Study on the stabilization mechanism of microbial detoxication and encapsulation of chromium slag, PhD thesis, Chongqing University, 2017.
- M. J. He, F. H. Wu, G. F. Qu and X. X. Liu, Environ. Res., 2023, 238, 117149 CrossRef CAS PubMed.
- J. N. Wu, C. L. Li and F. Yang, J. Cleaner Prod., 2015, 95, 156–162 CrossRef CAS.
- P. P. Zhan, L. H. Zeng, S. H. Zhang, C. W. Li and D. W. Li, Environ. Sci. Pollut. Res., 2023, 30, 29392–29406 CrossRef PubMed.
- X. Huang, F. Muhammad, L. Yu, B. Q. Jiao, Y. Shiau and D. W. Li, Ceram. Int., 2018, 44, 3454–3463 CrossRef CAS.
- J. Li, Z. L. Chen, J. M. Shen, B. Y. Wang and L. T. Fan, Chemosphere, 2015, 134, 159–165 CrossRef CAS PubMed.
- F. Muhammad, M. Xia, S. Li, X. Yu, Y. H. Mao, F. Muhammad, X. Huang, B. Q. Jiao, L. Yu and D. W. Li, J. Cleaner Prod., 2019, 234, 381–391 CrossRef CAS.
- M. Xia, F. Muhammad, L. H. Zeng, S. Li, X. Huang, B. Q. Jiao, Y. Shiau and D. W. Li, J. Cleaner Prod., 2019, 209, 1206–1215 CrossRef CAS.
- X. Huang, R. L. Zhuang, F. Muhammad, L. Yu, Y. C. Shiau and D. W. Li, Chemosphere, 2017, 168, 300–308 CrossRef CAS.
- B. B. Sun, G. Ye and G. D. Schutter, Constr. Build. Mater., 2022, 326, 126843 CrossRef CAS.
- T. Sun, J. Y. Chen, X. R. Lei and C. Y. Zhou, J. Environ. Chem. Eng., 2014, 2(1), 304–309 CrossRef CAS.
- G. Afolaranmi and M. Grant, Toxicology, 2011, 290, 120 CrossRef.
- T. J. Lin, Y. L. Huang, J. S. Chang, K. T. Liu, M. C. Yen, F. W. Chen, Y. L. Shih, J. C. Jao, P. C. Huang and I. J. Yeh, J. Trace Elem. Med. Biol., 2018, 48, 1–7 CrossRef CAS.
- A. B. Hizon-Fradejas, Y. Nakano, S. Nakai, W. Nishijima and M. Okada, J. Hazard. Mater., 2009, 166, 1560–1566 CrossRef CAS.
- H. M. Khater, Adv. Cem. Res., 2014, 26, 1–9 CrossRef CAS.
- CN-HJ, Solid Waste-Extraction Procedure for Leaching Toxicity-Sulphuric Acid and Nitric Acid Method (HJ/T 299-2007), 2007 Search PubMed.
- CN-GB, Solid Waste-Determination of Chromium(vi)-1,5-Diphenylcarbohydrazide Spectrophotometric Method (GB/T 15555. 4-1995), 1995 Search PubMed.
- CN-GB, Identification Standards for Hazardous Wastes-Identification for Extraction Toxicity (GB 5085.3-2007), 2007 Search PubMed.
- F. Muhammad, X. Huang, S. Li, M. Xia, M. L. Zhang, Q. Liu, M. A. S. Hassan, B. Q. Jiao, L. Yu and D. W. Li, J. Cleaner Prod., 2018, 188, 807–815 CrossRef CAS.
- C. Y. Hea and H. Kamarudin, Constr. Build. Mater., 2012, 35, 912–922 CrossRef.
- R. K. Liew, W. L. Nam, M. Y. Chong, X. Y. Phang, M. H. Su, P. N. Y. Yek, N. L. Ma, C. K. Cheng, C. T. Chong and S. S. La, Process Saf. Environ., 2018, 115, 57–69 CrossRef CAS.
- W. K. W. Lee and J. S. J. Van Deventer, Colloids Surf., A, 2002, 211, 115–126 CrossRef CAS.
- R. A. A. B. Santa, A. M. Bernardin, H. G. Riella and N. C. Kuhnen, J. Cleaner Prod., 2013, 57, 302–307 CrossRef.
- A. G. San Cristóbal, R. Castelló, M. M. Luengo and C. Vizcayno, Appl. Clay Sci., 2010, 49, 239–246 CrossRef.
- E. Álvarez-Ayuso, X. Querol, F. Plana, A. Alastuey, N. Moreno, M. Izquierdo, O. Font, T. Moreno, S. Diez, E. Vázquez and M. Barra, J. Hazard. Mater., 2008, 154, 175–183 CrossRef.
- P. Chindaprasirt, C. Jaturapitakkul, W. Chalee and U. Rattanasa, Waste Manage., 2009, 29, 539–543 CrossRef CAS.
Footnote |
| † Electronic supplementary information (ESI) available. See DOI: https://doi.org/10.1039/d3ra06820j |
| This journal is © The Royal Society of Chemistry 2024 |

