DOI:
10.1039/D3RA06733E
(Paper)
RSC Adv., 2024,
14, 1367-1376
Bismuth ferrite based acetone gas sensor: evaluation of graphene oxide loading†
Received
4th October 2023
, Accepted 18th December 2023
First published on 3rd January 2024
Abstract
We report a BiFeO3/graphene oxide (BFO/GO) perovskite, synthesized using a CTAB-functionalized glycine combustion route, as a potential material for acetone gas sensing applications. The physicochemical properties of the developed perovskite were analysed using XRD, FE-SEM, TEM, HRTEM, EDAX and XPS. The gas sensing performance was analysed for various test gases, including ethanol, acetone, propanol, ammonia, nitric acid, hydrogen sulphide and trimethylamine at a concentration of 500 ppm. Among the test gases, the developed BFO showed the best selectivity towards acetone, with a response of 61% at an operating temperature of 250 °C. All the GO-loaded BFO samples showed an improved gas sensing performance compared with pristine BFO in terms of sensitivity, the response/recovery times, the transient response curves and the stability. The 1 wt% GO-loaded BiFeO3 sensor showed the highest sensitivity of 89% towards acetone (500 ppm) at an operating temperature of 250 °C. These results show that the developed perovskites have significant potential for use in acetone gas sensing applications.
1. Introduction
Industrial development has had an important role worldwide in improving our social, cultural and economic arenas. However, it has also led to a large daily requirement for energy. The release of dangerous gases and vapours into the environment has resulted in air pollution, which is a major problem in many nations.1 Gases such as nitrous oxide (NOx), sulphur dioxide (SO2), carbon monoxide (CO), hydrogen sulphide (H2S) and volatile organic compounds (VOCs) are the main causes of air pollution.2–8 Fig. 1 illustrates the destructive effects of air pollution on the environment. There is a proven link between air pollution and an increase in cardiovascular disease death rates of up to 20%. About 92% of the world's population lives in metropolitan areas that exceed the World Health Organization's recommended levels of air pollution. This highlights the need for an increase in the monitoring and management of gaseous air pollutants.
 |
| | Fig. 1 (a) Schematic illustration of the destructive effects of air pollution on the environment. (b) Size of the markets for different types of gas sensor (https://www.grandviewresearch.com/). | |
The detection of blood-borne VOCs in exhaled breath as a consequence of metabolic alterations or pathological illnesses is important in non-invasive medical diagnostics. As indicators of conditions like diabetes and halitosis, the levels of acetone in exhaled human breath have the potential to provide useful information for the early identification of these diseases. Bismuth ferrite (BFO) perovskites have the potential to sense acetone.9–11 Because this ternary oxide consists of two cations of different sizes, BFO perovskites exhibit more stable and reliable gas sensing characteristics than binary metal oxides such as ZnO, CuO, WO3 and SnO2.12–17 The unique surface reactivity, oxygen adsorption and relatively narrow band gap (2.19 eV) of BFOs are beneficial for increasing gas selectivity, decreasing the dependence of sensor signals on humidity to negligible levels, facilitating the transport of valence electrons and speeding up recovery times.18,19
Significant efforts have been dedicated to the production of nanostructured BiFeO3, including nanoparticles, nanofibres and thin films,20–24 for gas sensor research. Gas sensitivity studies of BiFeO3 have been expanded to include a diverse range of target gases, such as VOCs (methanol, ethanol, acetone, benzene, toluene, glycol and gasoline), sulphur dioxide, oxygen, ammonia and formaldehyde.20–26 BiFeO3 gas sensors have demonstrated a sensitivity of 8–50 ppm for ethanol and 25 ppm for acetone, as reported in ref. 20 and 21, respectively. Nevertheless, the sensitivity of BiFeO3 to ammonia and sulphur dioxide is minimal.22,25 Research has shown that particular surface properties significantly influence the enhancement of gas sensitivity characteristics.
Graphene oxide (GO) is a potential candidate for improving the gas sensing properties of metal oxides. The motivation for loading GO on BFO is due to its fascinating catalytic redox reactions, which cause faster adsorption and desorption of oxygen molecules over the metal oxide. If the BFO is optimised in association with GO, the gas sensing response of the parent material (i.e. BFO) will increase. It is expected that interactions at the interface of the BFO and GO will positively favour the effective migration of charge carriers and therefore the overall gas sensing performance will be improved.
We have elucidated a facile and flexible strategy of fabricating BiFeO3 via a citrate sol–gel auto-combustion process. Two important aspects were considered to enhance the gas sensing properties of BFO: (1) the use of the surfactant CTAB, which facilitates a high surface area; and (2) loading with GO. We describe here the glycine sol–gel auto-combustion route, along with the physico-chemical and gas sensing properties of BiFeO3 perovskites.
2. Experimental
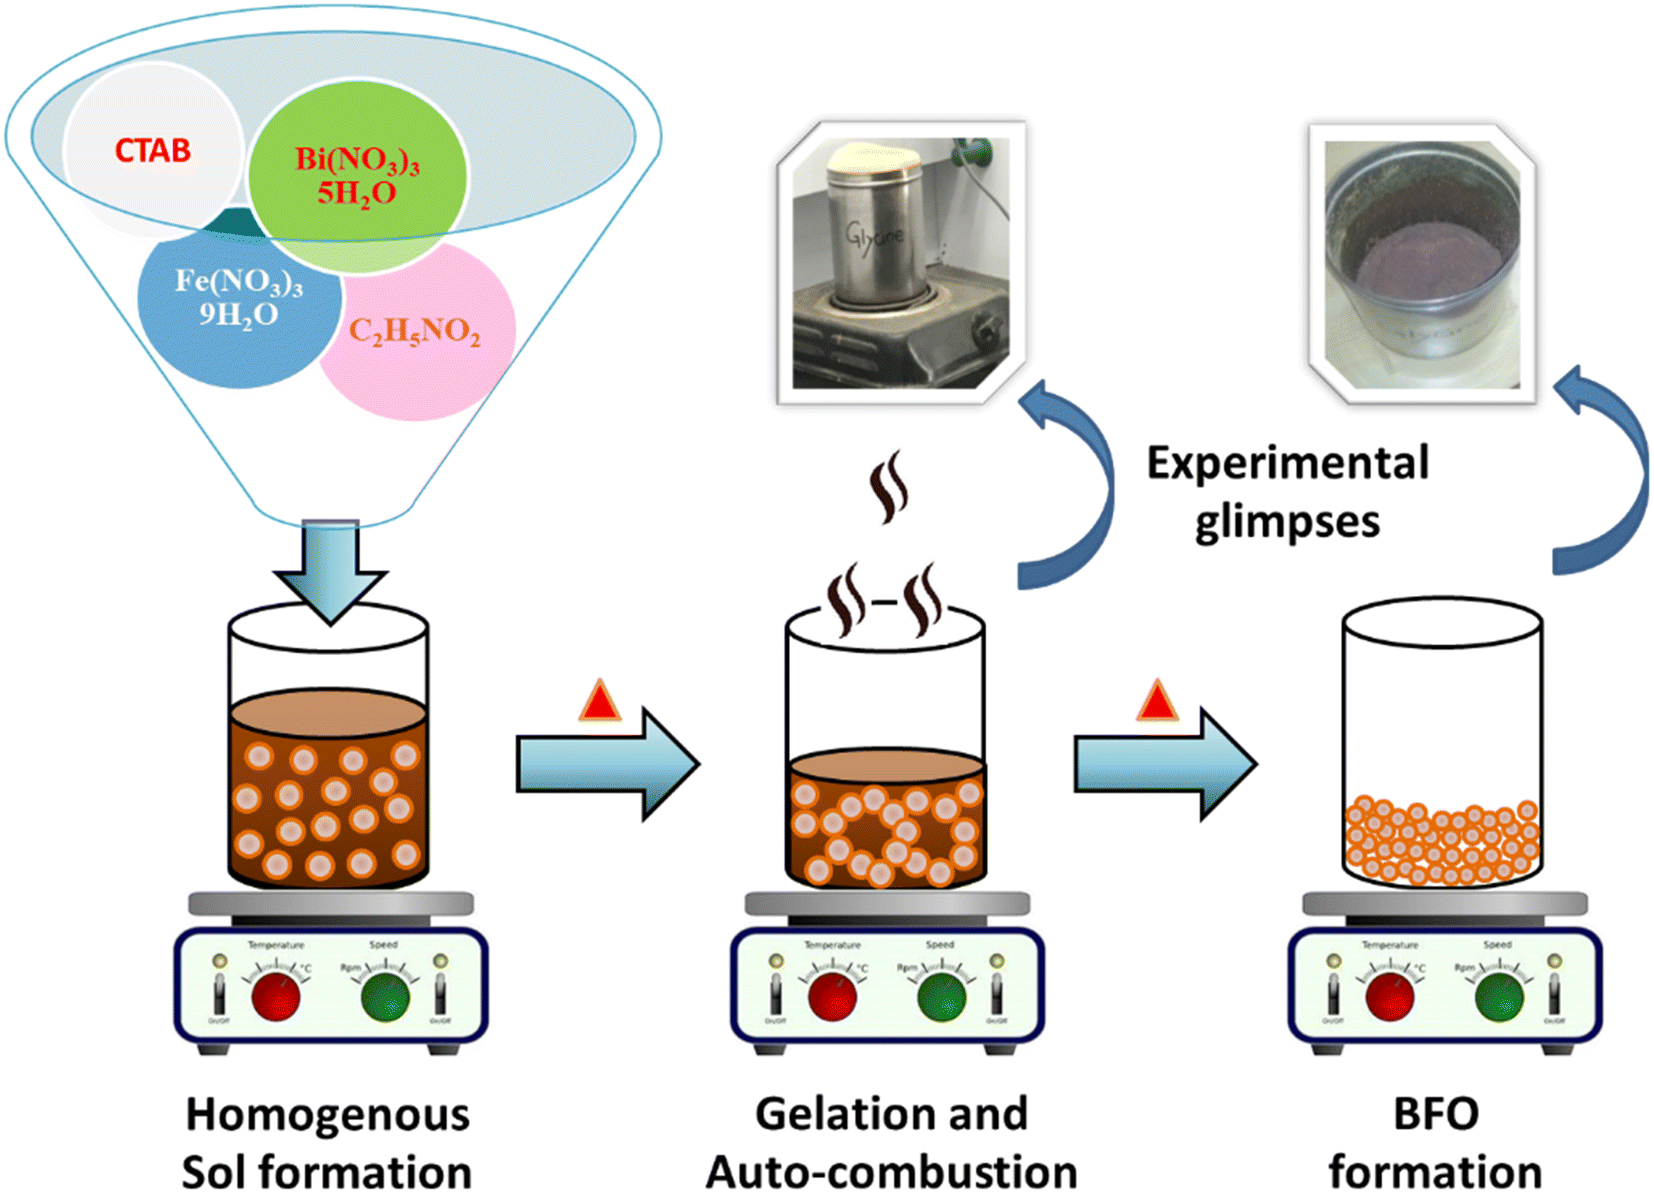
The AR grade chemicals, such as bismuth nitrate (Bi(NO3)3·5H2O), ferric nitrate (Fe(NO3)3·9H2O), CTAB, GO and glycine, were used without further purification. The facile synthesis of BFO nanoparticles was achieved via a glycine-assisted combustion route using metal nitrates as precursors, glycine (C2H5NO2) as a fuel and hexadecyltrimethylammonium bromide (CH3(CH2)15N(Br)(CH3)3) (CTAB) as a cationic surfactant. The stoichiometry of the redox mixture for combustion was calculated based on the total oxidizing and reducing valence of the oxidizer and reductant (1![[thin space (1/6-em)]](https://www.rsc.org/images/entities/char_2009.gif) :3 mol) and was kept constant. Bismuth nitrate (24.25 g), ferric nitrate (20.2 g) and glycine (16.04 g) were well mixed in 100 mL of distilled water. The reaction mixture was stirred for 15 min until it became homogeneous. The temperature of solution was gradually increased to 100 °C. The highly viscous sol reached the percolation threshold and formed a reddish gel enriched with water. The resultant gel was then heated to >200 °C. The viscous gel began frothing and, after the evaporation of water, underwent a fast, flameless auto-combustion reaction with the evolution of large amounts of gaseous products, after which it auto-ignited to give pristine BFO as the end-product.
:3 mol) and was kept constant. Bismuth nitrate (24.25 g), ferric nitrate (20.2 g) and glycine (16.04 g) were well mixed in 100 mL of distilled water. The reaction mixture was stirred for 15 min until it became homogeneous. The temperature of solution was gradually increased to 100 °C. The highly viscous sol reached the percolation threshold and formed a reddish gel enriched with water. The resultant gel was then heated to >200 °C. The viscous gel began frothing and, after the evaporation of water, underwent a fast, flameless auto-combustion reaction with the evolution of large amounts of gaseous products, after which it auto-ignited to give pristine BFO as the end-product.
The CTAB-assisted BFO samples were prepared by exactly the same synthesis strategy, but with the addition of CTAB (0.12 g) to the solution at a molar ratio of surfactant/bismuth of 0.1 (Fig. 2).27 Correspondingly, in the GO-loaded BFO synthesis process, the as-prepared BFO/CTAB powder (10 g) was dispersed in 10 mL of ethanol with rigorous stirring for 10 minutes before adding GO (0.5–1.5 wt%, steps of 0.5). This solution was ultrasonicated for 10 minutes to give a uniform dispersion of GO in BFO/CTAB. The homogeneous solution was stirred continuously at 70 °C until a dry powder was obtained. The characterization of the developed perovskite, its pellet preparation and gas sensing analysis are discussed in detail in the ESI† (I–III).
 |
| | Fig. 2 Schematic diagram of the experimental protocol to develop BFO perovskite. | |
3. Results and discussion
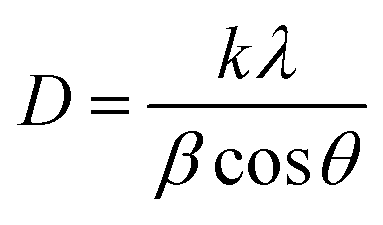
The XRD patterns of BiFeO3- and GO-loaded BiFeO3 powder are shown in Fig. 3. The high-intensity peaks at 2θ = 22.4°, 31.7°, 32.0°, 39.4°, 45.7°, 51.7°, 56.3° and 56.90° are due to diffracted X-rays from the (012), (104), (110), (006), (024), (122), (018) and (214) planes, respectively. The XRD pattern of the prepared sample matched well with previously reported work and JCPDS card 86-1518, confirming the rhombohedral phase. A low-intensity peak at 2θ = 28° was observed due to the formation of a secondary phase. The average crystallite size of the BiFeO3 nanoparticles was 55 nm, as calculated by the Debye–Scherrer formula:28| |
 | (1) |
where D = average crystallite size, k = 0.9, λ= wavelength of the X-rays, β = full-width half-maxima and θ = diffraction angle.
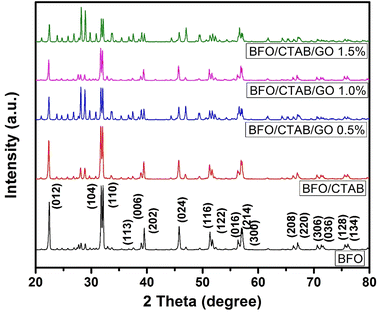 |
| | Fig. 3 XRD patterns of the developed BFO and the CTAB- and GO-modified BFOs. | |
In the SEM micrographs (Fig. 4a–e), the developed nanomaterial appears as an agglomeration of semi-cuboid nanoparticles with an average grain size of 300 nm. The size of the nanoparticles increased with the incorporation of GO in BFO. Deformation in the cubic shape occurred at higher concentrations of GO (i.e. 1.5%).
 |
| | Fig. 4 FE-SEM images of (a) pristine BFO, (b) CTAB-BFO, (c–e) 0.5–1.5 wt% GO-loaded BFO. | |
EDAX analysis was conducted to verify the presence of the constituent elements in BFO (Fig. 5). The elemental composition of the BFO sample spectrum consists of 58.02 wt% Bi, 19.90 wt% Fe and 22.08 wt% O. The corresponding weight percent and atomic percent values of the elements in the BFO sample are tabulated in Fig. 5. The homogeneous formation of BFO was validated through elemental mapping (Fig. 5).
 |
| | Fig. 5 EDAX results and mapping of BiFeO3. | |
The colloidal backbone/networking structure of the BiFeO3 is clearly visible in the TEM images (Fig. 6a and b) and the cuboid nanoparticles of GO/BFO, along with the presence of graphene sheets, was confirmed (Fig. 6d and e). This structure facilitates numerous channels for the efficient and rapid diffusion of gases and thereby improves the potential for gas sensing applications. The average particle size of ∼300 nm matched well with size calculated from the SEM analysis. The HRTEM fringes (Fig. 6c and f) matched with BFO planes belonging to the rhombohedral crystal phase, thus validating the results obtained from the XRD analysis.
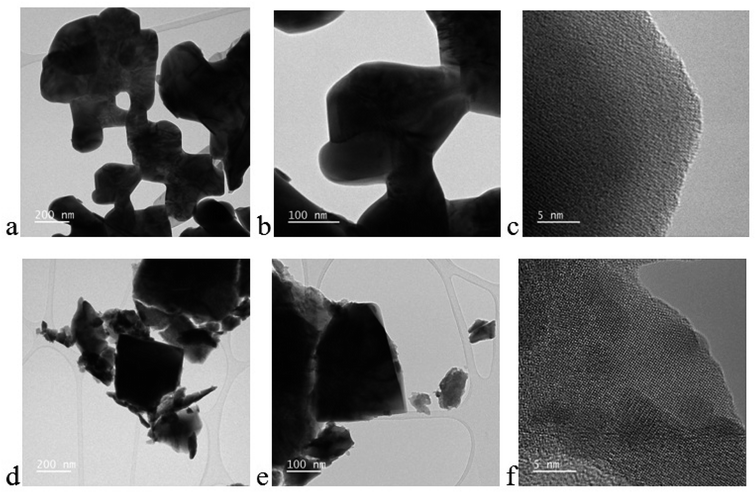 |
| | Fig. 6 TEM images of pristine (a–c) CTAB-BFO and (d–f) 0.1 wt% GO-loaded BFO. | |
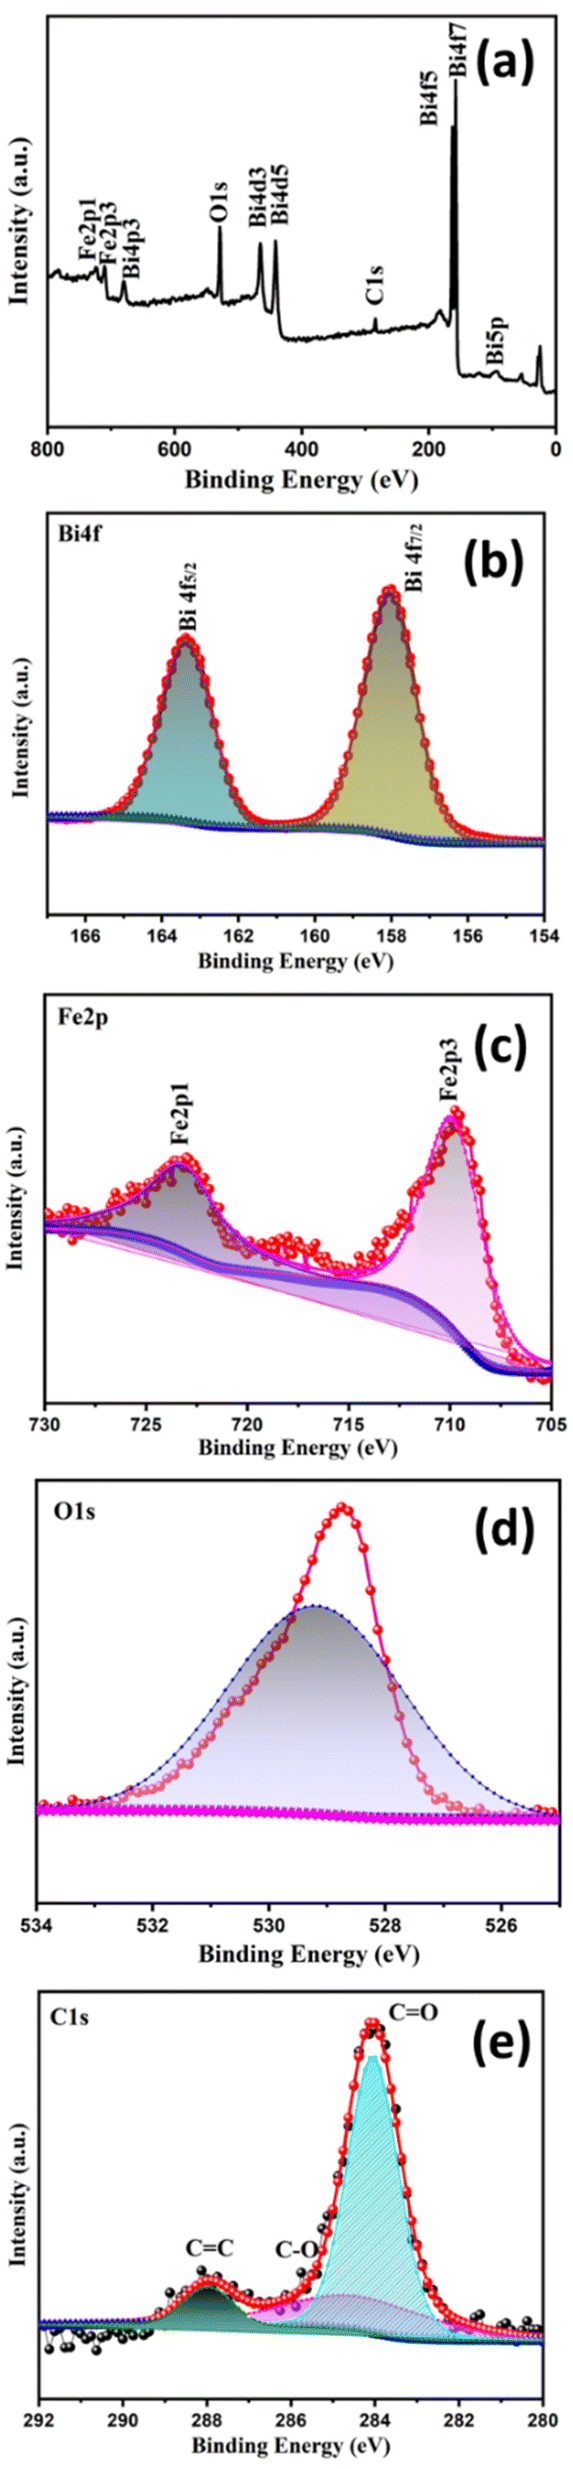
The elements present in the prepared sample of BFO-GO (1% GO) were determined by XPS. The XPS survey spectrum is shown in Fig. 7a. The dominant peaks present at binding energies of 160, 284, 530 and 710 eV confirm the elemental composition of Bi, C, O and Fe, respectively. The high-resolution spectra of Bi, C, O and Fe are shown separately in the Fig. 7b–e. Two separate peaks were observed for Bi 4f5/2 and Bi 4f7/2 at binding energies of 163.55 and 157.84 eV, respectively (Fig. 7b). The overlapping peaks of Fe 2P3/2 at 709.2 and 710.6 eV were resolved using convolution fitting of the graph (Fig. 7c). The Fe 2P1/2 peak was detected at 723.2 eV. The peaks at 528.7 and 529.3 eV corresponding to the O 1s group (Fig. 7d) were due to lattice oxygen and oxygen vacancies, respectively. The peaks at 284.1 and 288.2 eV in Fig. 7e correspond to C 1s, which confirms the GO loading.29
 |
| | Fig. 7 XPS spectra of 1% GO-loaded BFO – (a) survey spectrum, (b–e) spectra of Bi, Fe, O and C, respectively. | |
3.1 Gas sensing analysis
The gas sensing proficiency of the developed materials towards various reducing gases, including ethanol, acetone, propanol, ammonia, nitric acid, hydrogen sulphide and trimethylamine, was examined. In the general sensing process of metal oxide-based acetone gas sensors, oxygen molecules with a high electron affinity (0.43 eV) are adsorbed onto the sensor's surface and extract electrons from the detecting layer. Depending on the operating temperature, several different oxygen ion species will be present on the gas surface. The choice of gas species for testing is contingent upon the sensing material and the temperature at which sensing occurs. Typically, molecular ions are stable below 150 °C, but other species remain stable at elevated temperatures. Electron abstraction and the p-type characteristics of the gas sensor result in the formation of a hole accumulation layer on its surface. As a result of the prevalence of holes as charge carriers in p-type gas sensors, the resistance of these sensors is lower than that of a vacuum.
Upon the injection of acetone gas into the gas test chamber, a reaction occurs with the pre-existing oxygen ions that have been adsorbed, resulting in the release of electrons (e.g. for acetone):
| | |
(CH3COCH3)g → (CH3COCH3)ads
| (2) |
| | |
(CH3COCH3)ads + 8O− → 3CO2 + 3H2O + 8e−
| (3) |
Among the various test gases, it was observed that BFO exhibited the highest selectivity towards acetone (Fig. 8). Notably, at an operating temperature of 250 °C and a gas concentration of 500 ppm, the sensor gave a response of 61%. By contrast, none of the other test gases had a >50% response when subjected to same gas concentration and operating temperature.
 |
| | Fig. 8 Selectivity of the BFO sensor for various oxidizing and reducing gases. | |
Although the developed sensor had the ability to detect alcohols (propanol and ethanol), its sensitivity was low compared with acetone. Both alcohols and acetone are classified as reducing gases. Consequently, an increase in oxygen vacancies would have a positive impact on the detection of both alcohols and acetone. Despite exhibiting a favourable reaction to alcohols (ethanol, 33.92%; propanol, 34.96%), the sensitivity of the BFO nanoparticles to alcohols was significantly inferior to their sensitivity to acetone (61.68%). This selectivity towards acetone is attributed to the reactivity of the target gas with the sample or to the bond energy. The selectivity and sensitivity of the sensor can be determined by the bond energy of the gas analyte under certain conditions, whereas under other conditions the chemical reactivity of the gas analyte with the effective sample surface becomes crucial. The behaviour of the organic vapour varies depending on the operating temperature due to the preferential adsorption of oxygen towards acetone at a specific temperature. The sensor's selectivity towards acetone vapour makes it a promising candidate for many applications involving acetone sensing, especially the non-invasive monitoring of diabetes through exhaled breath. The following section discusses the gas sensing mechanism of bismuth ferrite nanoparticles towards acetone (Fig. 9).
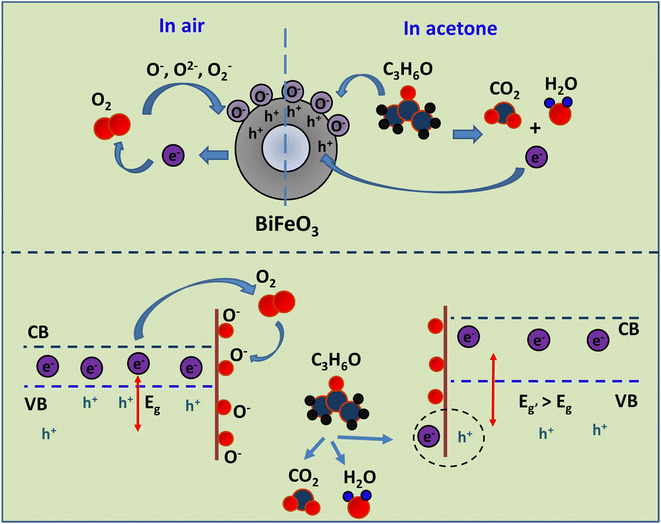 |
| | Fig. 9 Schematic illustration of the response mechanism of BiFeO3 towards acetone gas. | |
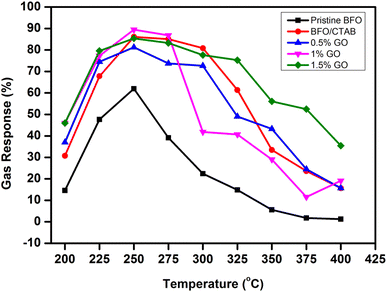
Fig. 10 is a graphical representation of the gas response in relation to the operating temperature for pristine BFO, BFO/CTAB and BFO/CTAB/GO (0.5–1.5 wt%) specifically targeting 500 ppm acetone. The analysis demonstrates that all the samples exhibit a sharp sensitivity with increasing temperature. However, the sensitivity of the samples decreases above a certain threshold temperature.30 The sample of 1 wt% GO-loaded BFO/CTAB exhibited a greater sensitivity of 89.44% at an operating temperature of 250 °C than the other samples.
 |
| | Fig. 10 Response to acetone as a function of operating temperature. | |
When the sensors are exposed to air, oxygen molecules are adsorbed onto the surface of sensor to form chemisorbed oxygen species (O2−, O− or O2−). These species are formed by capturing the electrons present on the adsorption sites of the oxide surface:
| | |
O2(ads) + e− ↔ O(ads)2−
| (5) |
| | |
O(ads)2− + e− ↔ 2O(ads)−
| (6) |
| | |
O(ads)− + e− ↔ O(ads)2−
| (7) |
The oxygen ions mainly exist in the form of O− in the temperature range 100–300 °C, which is the general operating temperature. Above this, O2− ions are directly incorporated into the lattice. A sufficient number of oxygen molecules form an electron-depleted space-charge layer on the surface of the nanoplates. This steady concentration of oxygen donates a basic electrical resistance in air. When the sensor is exposed to an oxidizing gas (e.g. NOx), the molecules of NOX capture electrons from the conduction band and react with the adsorbed oxygen ion, leading to the formation of adsorbed NO2− ions.
The reactions can be written as follows:
| | |
NO2(gas) + e− ↔ NO2(ads)−
| (8) |
| | |
NO2(gas) + O2(ads)− + 2e− ↔ NO2(ads)− + 2O−
| (9) |
The decrease in the electron concentration on the surface of the material, followed by an increase in the width of the depletion layer results in an increase in the resistance of the sensor. When exposure to NOX stops, the NO2− ions are desorbed and recovery occurs. This cycle continues and NOX detection takes place.
| | |
NO2(ads)− + 2O− + e− ↔ NO2(gas) + 2O(ads)2−
| (10) |
If the sensor is exposed to a reducing gas (e.g. ammonia), the gas interacts with the pre-adsorbed oxygen species, which results in a decrease in the concentration of surface oxygen species, leading to a decrease in the resistance of the sensor:
| | |
CO(ads) + O− ↔ CO2(gas) + e(ads)−
| (12) |
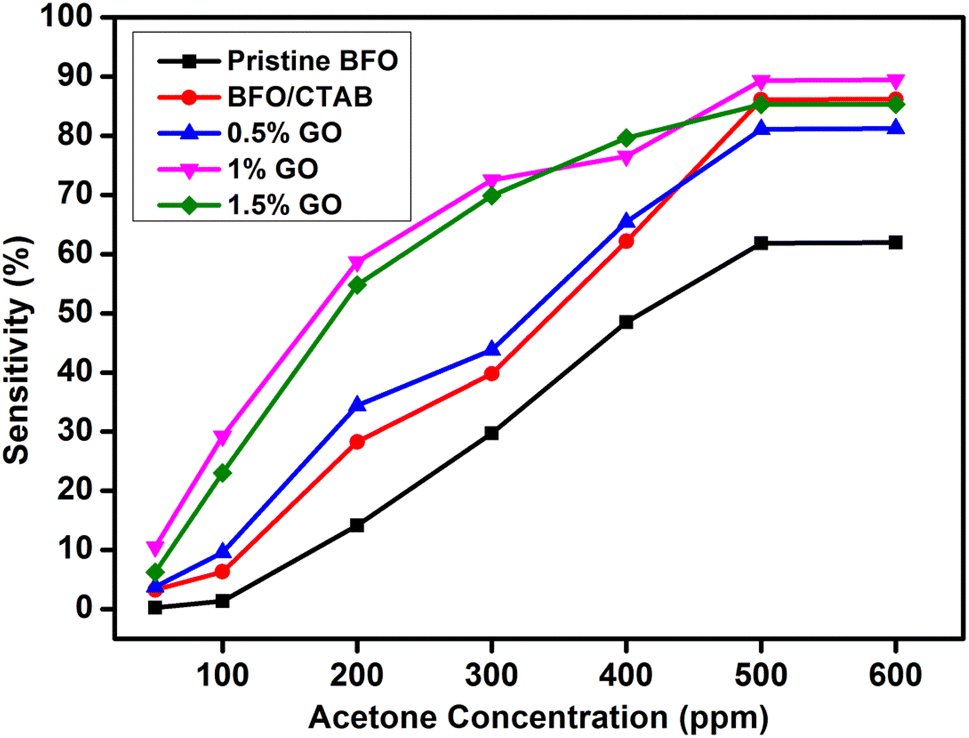
The sensors exhibited a pronounced increase their response during the early phase (1–200 ppm) as a result of varying concentrations of the target gas (acetone). Gradual saturation occurred when the concentration was increased further (Fig. 11). This may be attributed to the decreasing availability of active surfaces, which hinders the potential interaction between the gas and the sensing material.
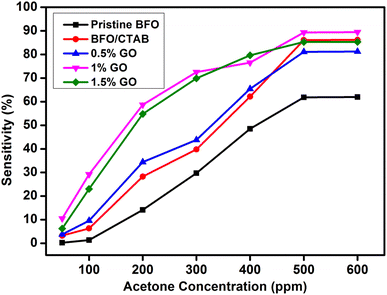 |
| | Fig. 11 Response of the sensor towards different concentrations of acetone at 250 °C. | |
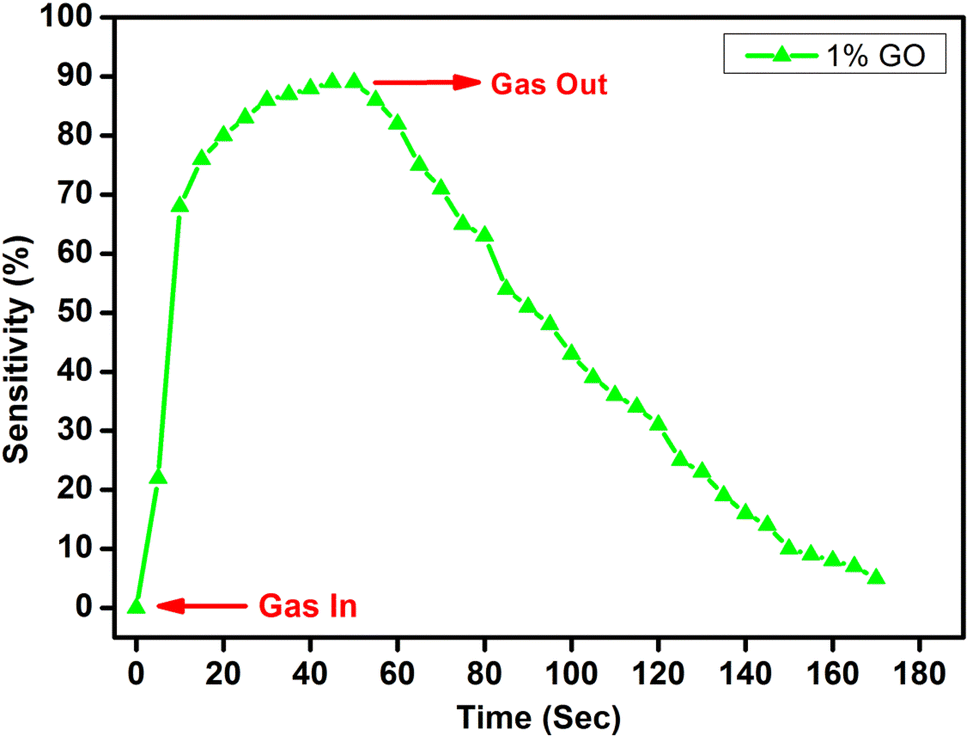
The transient response (response/recovery behaviour) is a crucial parameter of sensors for practical applications. Fig. 12 shows the transient response curve for the 1 wt% GO-loaded BFO/CTAB sensor. The measurements were carried out at an operating temperature of 250 °C and 500 ppm acetone. The 1 wt% GO-loaded BFO/CTAB sensor sample showed a rapid response time of 38 s and a recovery time of 1 min. The other sensors also responded in a decent manner. Table 1 gives the response/recovery times for all the developed sensors.
 |
| | Fig. 12 Transient response characteristics of the 1 wt% GO-loaded BFO/CTAB sensor at 250 °C. | |
Table 1 Transient response (response/recovery behaviour) of the developed sensors
| Sample ID |
Response (sensitivity%) |
Response time |
Recovery time |
| BFO |
61.98 |
1′ 58′′ |
2′ 22′′ |
| CTAB/BFO |
86.12 |
38′′ |
1′ 2′′ |
| 0.5 wt% GO |
81.22 |
55′′ |
1′ 18′′ |
| 1.0 wt% GO |
89.44 |
48′′ |
1′ 35′′ |
| 1.5 wt% GO |
85.00 |
45′′ |
1′ 52′′ |
In terms of stability, the optimised sensor (1 wt% GO-loaded BFO/CTAB) demonstrated a stability of about 98% of its original performance over a span of 60 days when exposed to 500 ppm acetone (Fig. S2†). This is strong evidence for the durability and repeatability of the sensor in the context of commercial applications.
We used the present perovskite (BiFeO3) as an example to compare chemiresistive perovskites with metal–organic frameworks (MOFs) and covalent organic frameworks (COFs) (Tables 2 and 3). MOFs and COFs are novel and developing categories of materials characterized by self-assembled porous network structures. These structures consist of organic linkers connecting metal nodes. These materials have the potential to be used as electrochemical sensors for the detection of diverse target gases, including biomolecules. This is because they have a wide surface area, a diverse pore structure that can be regulated, increased functionality and unique catalytic activities.
Table 2 Chemiresistive MOFs/COFs for the detection of inorganic and organic molecules
| MOF/COF |
Target gas |
Detection limit (ppm) |
Ref. |
| Cu3(HITP)2 |
NH3 |
0.5 |
31 |
| Ni3(HHTP) |
NO |
0.1 |
32 |
| H2S |
1 |
| ZIF-67 |
CH2O |
5 |
33 |
| Co(Im)2 |
Me3N |
2 |
34 |
Table 3 Comparative chart of sensor parameters of developed BiFeO3 with state of art publications
| Sensing material |
Operating temperature (°C) |
Concentration |
Selectivity |
Sensitivity |
Response and recovery times (s) |
Reference |
| BiFeO3 NPs |
340 |
0.1 vol% |
Acetone |
Rg/Ra = 10 |
40–80 |
35 |
| BiFeO3 NPs |
350 |
10 ppm |
Acetone |
Rg/Ra = 12 |
— |
36 |
| 1 wt% Pd/BiFeO3 NPs |
300 |
500 ppm |
Acetone |
(Rg − Ra)/Ra = 83.4 |
75–104 |
37 |
| GO/BiFeO3 NPs |
250 |
500 ppm |
Acetone |
(Rg − Ra)/Ra = 89.4 |
48–95 |
Present work |
4. Conclusions
We developed BFO/GO perovskites via a CTAB-functionalized glycine combustion route. The developed perovskite was tested for its gas sensing performance towards various oxidizing and reducing gases. Crystallographic identification of the perovskites confirmed a rhombohedral phase with an average nanoparticle crystallite size of 55 nm. The microstructural and morphological characterizations established that the incorporation of CTAB and GO in the BFO synthesis influenced the surface morphology and particle size of BFO, dramatically changing the gas sensing performance of the sensors. The sensor with 1 wt% GO-loaded CTAB/BFO showed a higher selective sensitivity of 89% towards acetone (500 ppm at 250 °C) than pristine BFO. The response and recovery times were 48 s and 1 min, which is quite fast compared with other GO-loaded BFO samples. These results show that the 1 wt% GO-loaded CTAB/BFO material can be used to fabricate an effective acetone sensor.
Conflicts of interest
There are no conflicts to declare.
Acknowledgements
The authors extend their appreciation to the Deputyship for Research and Innovation, “Ministry of Education” in Saudi Arabia for funding this research (IFKSUOR3-108-2).
References
- I. Manisalidis, E. Stavropoulou, A. Stavropoulos and E. Bezirtzoglou, Front. Public Health, 2020, 8, 14, DOI:10.3389/fpubh.2020.00014.
- J. Qiu, X. Hu, X. Min, W. Quan, R. Tian, P. Ji, H. Zheng, W. Qin, H. Wang, T. Pan, S. Cheng, X. Chen, W. Zhang and X. Wang, ACS Appl. Mater. Interfaces, 2020, 12(17), 19755–19767 CrossRef CAS PubMed.
- D. Y. Nadargi, R. B Dateer, M. S. Tamboli, I. S. Mulla and S. S. Suryavanshi, RSC Adv., 2019, 9, 33602–33606 RSC.
- H. Xu, J. Li, P. Li, J. Shi, X. Gao and W. Luo, ACS Appl. Mater. Interfaces, 2021, 13(41), 49194–49205 CrossRef CAS PubMed.
- G. Jung, S. Hong, Y. Jeong, W. Shin, J. Park, D. Kim and J.-H. Lee, ACS Appl. Mater. Interfaces, 2022, 14(15), 17950–17958 CrossRef CAS PubMed.
- S. S. Mehta, D. Y. Nadargi, M. S. Tamboli, L. S. Chaudhary, P. S. Patil, I. S. Mullad and S. S. Suryavanshi, Dalton Trans., 2018, 47, 16840–16845 RSC.
- D. Y. Nadargi, M. S. Tamboli, S. S. Patil, R. B. Dateer, I. S. Mulla, H. Choi and S. S. Suryavanshi, ACS Omega, 2020, 5(15), 8587–8595 CrossRef CAS PubMed.
- K. Phasuksom, W. Prissanaroon-Ouajai and A. Sirivat, RSC Adv., 2020, 10, 15206–15220 RSC.
- X. Yang, H. Li, L. Tai, Z. Li, W. Wu, C. Zhou, P. Sun, F. Liu, Y. Xu, Y. Gao, X. Liang and G. Lu, Sens. Actuators, B, 2018, 282, 339 CrossRef.
- H. Xu, J. Xu, H. Li, W. Zhang, Y. Zhang and Z. Zhai, J. Mater. Res. Technol., 2022, 17, 1955–1963 CrossRef CAS.
- Q. Li, W. Zhang, C. Wang, J. Ma, L. Ning and H. Fan, RSC Adv., 2018, 8, 33156–33163 RSC.
- Y. Xue-Lian, Y. Wang, Y.-M. Hu, C.-B. Cao and H. L.-W. Chan, J. Am. Ceram. Soc., 2009, 92, 3105 CrossRef.
- H. Obayashi, Y. Sakurai and T. Gejo, J. Solid State Chem., 1976, 17, 299–303 CrossRef CAS.
- G. Dong, H. Tian and J. Fang, RSC Adv., 2015, 5, 29618–29623 RSC.
- D. Y. Nadargi, M. S. Tamboli and S. S. Patil, et al.,, SN Appl. Sci., 2019, 1, 1564 CrossRef CAS.
- S. Steinhauer, Gas Sensors Based on Copper Oxide Nanomaterials: A Review, Chemosensors, 2021, 9, 51 CrossRef CAS.
- C. Dong, R. Zhao, L. Yao, R. Yan, X. Zhang and Y. Wang, J. Alloys Compd., 2020, 820, 153194 CrossRef CAS.
- B. Li, Q. Zhou, S. Peng and Y. Liao, Front. Chem., 2020, 8, 321 CrossRef CAS PubMed.
- H. Kim and J. Lee, Sens. Actuators, B, 2014, 192, 607–627 CrossRef CAS.
- X.-L. Yu, Y. Wang, Y.-M. Hu, C.-B. Cao and H. L.-W. Chan, J. Am. Ceram. Soc., 2009, 92, 3105 CrossRef CAS.
- G. Dong, H. Fan, H. Tian, J. Fang and Q. Li, RSC Adv., 2015, 5, 29618 RSC.
- S. Das, S. Rana, S. M. Mursalin, P. Rana and A. Sen, Sens. Actuators, B, 2015, 218, 122 CrossRef CAS.
- M. Sobhan, Q. Xu, A. Katoch, F. Anariba, S. S. Kim and P. Wu, Nanotechnology, 2015, 26, 175501 CrossRef PubMed.
- M. Norayr, Sensor Test Conferences, vol. 749, 2011 Search PubMed.
- M. Dziubaniuk, R. Bujakiewicz-Korońska, J. Suchanicz, J. Wyrwa and M. Rękas, Sens. Actuators, B, 2013, 188, 957 CrossRef CAS.
- T. Tong, J. Chen, D. Jin and J. Cheng, Mater. Lett., 2017, 197, 160–162 CrossRef CAS.
- X. Deng, C. Song, Y. Tong, G. Yuan, F. Gao, D. Liu and S. Zhang, Phys. Chem. Chem. Phys., 2018, 20, 3648–3657 RSC.
- P. A. Ghadage, L. K. Bagal, D. Y. Nadargi, R. C. Kambale and S. S. Suryavanshi, Mater. Today: Proc., 2021, 43(4), 2725–2729 CAS.
- P. Scherrer, Nachr. Ges. Wiss. Göttingen, 1918, 26, 98–100 Search PubMed.
- E. Massera, V. L. Ferrara, M. Miglietta, T. Polichetti, I. Nasti and G. Francia, Gas sensors based on graphene, Chem. Today, 2011, 29, 39–41 CAS.
- M. G. Campbell, D. Sheberla, S. F. Liu, T. M. Swager and M. Dincă, Angew. Chem., Int. Ed., 2015, 54, 4349 CrossRef CAS PubMed.
- M. K. Smith and K. A. Mirica, J. Am. Chem. Soc., 2017, 139, 16759 CrossRef CAS PubMed.
- E.-X. Chen, H. Yang and J. Zhang, Inorg. Chem., 2014, 53, 5411 CrossRef CAS PubMed.
- E.-X. Chen, H.-R. Fu, R. Lin, Y.-X. Tan and J. Zhang, ACS Appl. Mater. Interfaces, 2014, 6, 22871 CrossRef CAS PubMed.
- A. S. Poghossian, H. V. Abovian, P. B. Avakian, V. Mkrtchian and M. Haroutunian, Sens. Actuators, B, 1991, 9, 545–549 CrossRef.
- S. Chakraborty and M. Pal, J. Alloys Compd., 2019, 787, 1204–1211 CrossRef CAS.
- P. Ghadage, K. Pavan, D. Nadargi, S. Patil, M. Tamboli, N. Bhandari, I. Mulla, C. Park and S. Suryavanshi, Ceram. Int., 2023, 49(4), 5738–5747 CrossRef CAS.
|
| This journal is © The Royal Society of Chemistry 2024 |
Click here to see how this site uses Cookies. View our privacy policy here. 
 Open Access Article
 This Open Access Article is licensed under a Creative Commons Attribution-Non Commercial 3.0 Unported Licence
 a,
K. P. Shindeb,
Digambar Nadargi
a,
K. P. Shindeb,
Digambar Nadargi