 Open Access Article
Biopharmaceutical advancement of efonidipine hydrochloride ethanolate through amorphous solid dispersion of a Parteck SLC mesoporous silica polymer
Swati
Bharati
 a,
Vinod
Gaikwad
 b and
Bothiraja
Chellampillai
 *c
*c
aDepartment of Pharmaceutics, Bharati Vidyapeeth (Deemed to be University) (BVDU), Poona College of Pharmacy, Pune-411038, Maharashtra, India
bDepartment of Pharmaceutics, National Institute of Pharmaceutical Education and Research (NIPER), Hajipur-844102, Bihar, India
cDepartment of Pharmaceutics, Goa College of Pharmacy, Goa University, Panaji, Goa-403001, India. E-mail: pounbothi@yahoo.com
First published on 5th June 2024
Abstract
Amorphous solid dispersion is the most efficient method for improving the solubility and release of poorly water-soluble crystalline drug molecules. Efonidipine hydrochloride ethanolate (EFE) shows solubility-limited oral bioavailability (BCS class II). The present investigation aimed to improve the solubility, bioavailability, and therapeutic efficacy of EFE using Parteck® SLC mesoporous silica based amorphous solid dispersion (EFESD). EFESD was prepared by employing a solvent evaporation method. An optimized composition (1![[thin space (1/6-em)]](https://www.rsc.org/images/entities/char_2009.gif) :
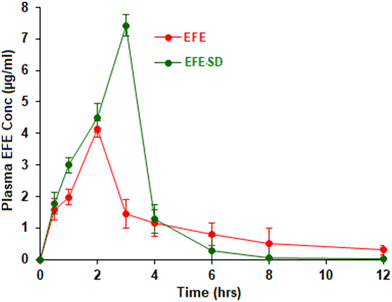
:![[thin space (1/6-em)]](https://www.rsc.org/images/entities/char_2009.gif) 1 ratio) of solid dispersion was subjected to in vitro, ex vivo, and in vivo characterization. The solubility of EFE in the EFESD form was found to be 5- and 4-fold improved in distilled water and phosphate buffer (pH 6.8), respectively. An ex vivo permeability study performed using different parts of the Wistar rat small intestine (the duodenum, jejunum, and ileum) using a non-everted sac method showed 2-fold improvements in the permeability of EFE in EFESD. Moreover, in vivo pharmacokinetic and pharmacodynamic studies performed using male Wistar rats showed 1.41- and 2.10-fold increase in the area under the curve and Cmax, respectively, along with the improved anti-hypertensive activity of EFE in EFESD. Thus, amorphous solid dispersion with a novel applied Parteck® SLC 500 mesoporous silica formulation is an effective strategy to improve the biopharmaceutical properties of EFE.
1 ratio) of solid dispersion was subjected to in vitro, ex vivo, and in vivo characterization. The solubility of EFE in the EFESD form was found to be 5- and 4-fold improved in distilled water and phosphate buffer (pH 6.8), respectively. An ex vivo permeability study performed using different parts of the Wistar rat small intestine (the duodenum, jejunum, and ileum) using a non-everted sac method showed 2-fold improvements in the permeability of EFE in EFESD. Moreover, in vivo pharmacokinetic and pharmacodynamic studies performed using male Wistar rats showed 1.41- and 2.10-fold increase in the area under the curve and Cmax, respectively, along with the improved anti-hypertensive activity of EFE in EFESD. Thus, amorphous solid dispersion with a novel applied Parteck® SLC 500 mesoporous silica formulation is an effective strategy to improve the biopharmaceutical properties of EFE.
1. Introduction
Approximately 70% of new chemical entities have water solubility issues.1,2 The bioavailability of poorly soluble drugs in the oral dose form is controlled by the low solubility and GIT dissolution rate.3 The amorphization with molecular dispersion of the drug increases the surface area and wettability and hence increases the solubility, dissolution rate, and bioavailability of poorly soluble (BCS classes II and IV) drugs.4–6Efonidipine hydrochloride ethanolate (EFE) is a calcium channel antagonist used to treat hypertension and angina pectoris.7–10 EFE is lipophilic with a log![[thin space (1/6-em)]](https://www.rsc.org/images/entities/char_2009.gif) P value of 5.35 and a pKa (basic) of 2.33.11 It is insoluble in water (<10 μg mL−1) but soluble in organic solvents such as DMSO, methanol, ethanol, and acetonitrile.12,13 As an API, this molecule has a very poor water solubility; hence, to boost its bioavailability, its solubility and oral absorption must be improved.
P value of 5.35 and a pKa (basic) of 2.33.11 It is insoluble in water (<10 μg mL−1) but soluble in organic solvents such as DMSO, methanol, ethanol, and acetonitrile.12,13 As an API, this molecule has a very poor water solubility; hence, to boost its bioavailability, its solubility and oral absorption must be improved.
In solid dispersion, a poorly water-soluble drug is dispersed in a highly soluble hydrophilic matrix in the solid state to enhance its solubility, stability, and oral bioavailability.14–21 This involves several mechanisms, including particle size reduction, molecular dispersion, enhanced stability and porosity, and transformation from a crystalline to an amorphous state.17,18 With urea as a third ingredient and hydroxypropyl methylcellulose acetate succinate as a polymeric carrier, Otsuka et al. prepared microwave-assisted EFE solid dispersion. Its bioavailability was eight times better in beagle dogs. According to Cheng et al., flow through the cell system of an open-loop system can be used to forecast how well an EFE solid dispersion with hydroxypropyl methylcellulose acetate succinate performs in vivo. Wet-milling technology was used by Song et al. to create EFE nanosuspension, which increased bioavailability by 2.2 times. Rajput et al. used the hot melt extrusion process to create an amorphous solid dispersion of EFE using Eudragit EPO with enhanced dissolution. However, each method has its limitations.
Recent decades have seen the development of mesoporous silica (MS) as a novel, promising substitute for the conventional techniques used to create amorphous formulations. The ability of MS materials to efficiently entrap drug molecules in mesopores and prevent recrystallization due to finite-size effects is attributed to their distinctive properties of nanoscale mesopores with high pore volumes and high surface areas.22 Consequently, amorphous drugs trapped in mesopores can speed up the pace of drug dissolution and create drug supersaturation in aqueous environments, providing a higher level of bioavailability than crystalline drugs. Therefore, MS materials have garnered significant attention as effective delivery systems for therapeutic compounds that are poorly soluble in water.
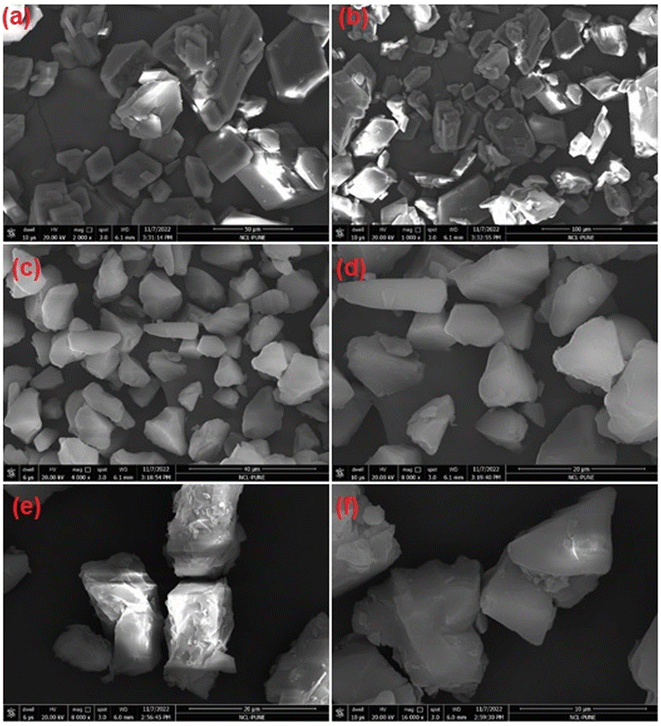
The current study aims to explore the advantages of Parteck® SLC 500 mesoporous silica-based amorphous formulation for EFE to improve its biopharmaceutical properties. Solid dispersion of EFE (EFESD) with mesoporous silica could prove useful in enhancing the solubilization of EFE in the GIT and hence enhancing its concentration at the site of absorption.23 In the present investigation, EFESD was prepared with mesoporous silica in different ratios using a solvent evaporation method. The EFESD was further optimized based on its saturation solubility in distilled water and phosphate buffer (pH 6.8) and subsequently characterized by DSC, XRD, FTIR, and FESEM techniques. Moreover, both EFE and EFESD were evaluated for intrinsic dissolution rate, ex vivo permeability in different parts of the Wistar rat intestine, and in vivo pharmacokinetics and pharmacodynamics for the assessment of bioavailability and antihypertensive activity in Wistar rat, respectively.
2. Materials and methods
2.1. Materials
EFE was a kind gift from Ajanta Pharma Ltd (Mumbai, India). Parteck® SLC 500 mesoporous silica was a gift sample from Merck Life Sciences Pvt. Ltd (Mumbai, India). Methanol was purchased from Merck Life Sciences (Pvt. Ltd) (Mumbai, India). The additional excipients utilised were all of the pharmaceutical grade standards. The chemical solvents and reagents utilised were of analytical grade.2.2. Preparation of EFE solid dispersion (EFESD)
EFESDs were prepared using a solvent evaporation method. Briefly, EFE was mixed with mesoporous silica in different ratios (1![[thin space (1/6-em)]](https://www.rsc.org/images/entities/char_2009.gif) :
:![[thin space (1/6-em)]](https://www.rsc.org/images/entities/char_2009.gif) 1, 1
1, 1![[thin space (1/6-em)]](https://www.rsc.org/images/entities/char_2009.gif) :
:![[thin space (1/6-em)]](https://www.rsc.org/images/entities/char_2009.gif) 2, and 1
2, and 1![[thin space (1/6-em)]](https://www.rsc.org/images/entities/char_2009.gif) :
:![[thin space (1/6-em)]](https://www.rsc.org/images/entities/char_2009.gif) 3 w/w) and dissolved in 5 mL of methanol to yield dispersion. The methanolic dispersion was turned into a dry mass by evaporating it at 50 °C in a rotary evaporator (Heidolph, Germany). This dry mass was crushed with a mortar and pestle before being sieved through an 18 mm mesh size to create a powder of a uniform size. Before further research, the prepared EFESDs were kept in tightly closed containers at 25 °C and shielded from light.24
3 w/w) and dissolved in 5 mL of methanol to yield dispersion. The methanolic dispersion was turned into a dry mass by evaporating it at 50 °C in a rotary evaporator (Heidolph, Germany). This dry mass was crushed with a mortar and pestle before being sieved through an 18 mm mesh size to create a powder of a uniform size. Before further research, the prepared EFESDs were kept in tightly closed containers at 25 °C and shielded from light.24
2.3. Characterization of EFESD
![[thin space (1/6-em)]](https://www.rsc.org/images/entities/char_2009.gif) 000 rpm for 10 min. The supernatant was collected, filtered through a 0.22 μm membrane filter, suitability diluted with the respective solvent, and analysed spectrophotometrically (Jasco V730, UV-visible spectrophotometer, Japan) at 252 nm to estimate the amount of EFE. The results of the triplicate measurements were reported as means ± standard deviation (SD).
000 rpm for 10 min. The supernatant was collected, filtered through a 0.22 μm membrane filter, suitability diluted with the respective solvent, and analysed spectrophotometrically (Jasco V730, UV-visible spectrophotometer, Japan) at 252 nm to estimate the amount of EFE. The results of the triplicate measurements were reported as means ± standard deviation (SD).
![[thin space (1/6-em)]](https://www.rsc.org/images/entities/char_2009.gif) :
:![[thin space (1/6-em)]](https://www.rsc.org/images/entities/char_2009.gif) 1 ratio and subsequently scanned from 3600 to 600 cm−1 wave numbers at a resolution of 4 cm−1 to obtain the FTIR spectra.
1 ratio and subsequently scanned from 3600 to 600 cm−1 wave numbers at a resolution of 4 cm−1 to obtain the FTIR spectra.
![[thin space (1/6-em)]](https://www.rsc.org/images/entities/char_2009.gif) :
:![[thin space (1/6-em)]](https://www.rsc.org/images/entities/char_2009.gif) water, 90
water, 90![[thin space (1/6-em)]](https://www.rsc.org/images/entities/char_2009.gif) :
:![[thin space (1/6-em)]](https://www.rsc.org/images/entities/char_2009.gif) 10 v/v) was filtered through a 0.45 μm membrane filter and injected at a flow rate of 1.0 mL min−1 for isocratic elution. A primary stock solution of EFE was prepared by dissolving 5 mg of EFE in 5 mL of methanol (1000 μg mL−1). For calibration, different concentrations of 0, 50, 100, 250, 500, 1000, 2500, and 5000 ng mL−1 of EFE were prepared using the stock solution. The injection volume of the sample was 20 μL. The eluent was analyzed at 252 nm using a UV-visible detector. The retention time of EFE was found to be 5.18 min. The data obtained were processed using the Jasco Borwin version 1.5, LC-Net II/ADC system. The regression equation and R2 value of EFE for the calibration curve were observed to be y = 32.334x + 3319.2 and 0.9959, which were used for drug content, in vitro intrinsic dissolution study, and ex vivo permeability studies.
10 v/v) was filtered through a 0.45 μm membrane filter and injected at a flow rate of 1.0 mL min−1 for isocratic elution. A primary stock solution of EFE was prepared by dissolving 5 mg of EFE in 5 mL of methanol (1000 μg mL−1). For calibration, different concentrations of 0, 50, 100, 250, 500, 1000, 2500, and 5000 ng mL−1 of EFE were prepared using the stock solution. The injection volume of the sample was 20 μL. The eluent was analyzed at 252 nm using a UV-visible detector. The retention time of EFE was found to be 5.18 min. The data obtained were processed using the Jasco Borwin version 1.5, LC-Net II/ADC system. The regression equation and R2 value of EFE for the calibration curve were observed to be y = 32.334x + 3319.2 and 0.9959, which were used for drug content, in vitro intrinsic dissolution study, and ex vivo permeability studies.
![[thin space (1/6-em)]](https://www.rsc.org/images/entities/char_2009.gif) :
:![[thin space (1/6-em)]](https://www.rsc.org/images/entities/char_2009.gif) 30 v/v) containing EFE equivalent to 1 mg mL−1 through a needle in the mucosal compartment and sealed. The dose reported for rats (10 mg kg−1) served as the basis for the permeability dose calculation.28
30 v/v) containing EFE equivalent to 1 mg mL−1 through a needle in the mucosal compartment and sealed. The dose reported for rats (10 mg kg−1) served as the basis for the permeability dose calculation.28
Each non-everted rat intestine was placed in a 250 mL glass beaker containing 100 mL of KRS (pH 7.4) and isopropyl alcohol (70![[thin space (1/6-em)]](https://www.rsc.org/images/entities/char_2009.gif) :
:![[thin space (1/6-em)]](https://www.rsc.org/images/entities/char_2009.gif) 30 v/v), maintained at 37 °C under continuous stirring at 100 rpm. The aliquots were collected at predefined intervals from outside of the sac for up to 8 h, and the same was replaced with fresh medium. The collected aliquots were filtered using a 0.22 μm syringe filter before being subjected to an HPLC analysis at 252 nm to determine the amount of EFE that had permeated at the specific time point. The cumulative amount of EFE that permeated the non-everted rat intestine (μg) over time (hours) was plotted to determine the permeability of EFE. The slope of the curve [permeating flux, (F)] was determined by linear regression analysis and was further used for the estimation of the apparent permeability coefficient.
30 v/v), maintained at 37 °C under continuous stirring at 100 rpm. The aliquots were collected at predefined intervals from outside of the sac for up to 8 h, and the same was replaced with fresh medium. The collected aliquots were filtered using a 0.22 μm syringe filter before being subjected to an HPLC analysis at 252 nm to determine the amount of EFE that had permeated at the specific time point. The cumulative amount of EFE that permeated the non-everted rat intestine (μg) over time (hours) was plotted to determine the permeability of EFE. The slope of the curve [permeating flux, (F)] was determined by linear regression analysis and was further used for the estimation of the apparent permeability coefficient.
![[thin space (1/6-em)]](https://www.rsc.org/images/entities/char_2009.gif) 000 rpm. The supernatant was collected, filtered, and analyzed using HPLC. The retention time of EFE was found to be 5.29 min. The regression equation and R2 value of EFE for the calibration curve were observed to be y = 42.151x + 1747 and 0.9986. The data obtained were processed using the Jasco Borwin version 1.5, LC-Net II/ADC system.
000 rpm. The supernatant was collected, filtered, and analyzed using HPLC. The retention time of EFE was found to be 5.29 min. The regression equation and R2 value of EFE for the calibration curve were observed to be y = 42.151x + 1747 and 0.9986. The data obtained were processed using the Jasco Borwin version 1.5, LC-Net II/ADC system.
Group I (control group): this group received distilled water for four weeks (1 mL kg−1) (once a day).
Group II (diseased group): this group received distilled water for four weeks (1 mL kg−1) (once a day).
Group III (standard group): this group received 10 mg kg−1 of captopril dispersed in 1 mL of water for four weeks (once a day).
Group IV (EFE group): this group received 10 mg kg−1 of EFE dispersed in 1 mL of water for four weeks (once a day).
Group V (EFESD group): this group received solid dispersion equivalent to 10 mg kg−1 of EFE in 1 mL of water for four weeks (once a day).
Animals were anesthetized at the end of treatment by an intraperitoneal injection of 1.25 g kg−1 urethane. A small incision was made on the left side of the animal's abdominal cavity to expose the left kidney. The renal artery was occluded for 4 hours with a renal bulldog clamp. The jugular vein was cannulated for the administration of the test drug. To measure blood pressure, the carotid artery was cannulated and connected to the blood pressure transducer of the PowerLab eight-channel recorder (AD Instruments Pty Ltd, PowerLab 8/30, India). The renal bulldog clip was removed once the blood pressure stabilized. Then, 1/10th dose of the administered doses of EFE and EFESD were given through the jugular vein, and mean atrial blood pressure (MABP), systolic blood pressure (SBP), and diastolic blood pressure (DSP) were measured at different time intervals (5, 15, 30, and 60 min). MABP was measured in the normal control groups without clamping the renal artery. Captopril (10 mg kg−1) was given intravenously as a standard. Changes in blood pressure in the treated groups were compared to a negative control.30
3. Results and discussion
3.1. Preparation of EFESD
The EFESD was prepared by applying a solvent evaporation method using mesoporous silica as a carrier to improve the EFE solubility and dissolution. The use of mesoporous silica in solid dispersion offers several characteristics, including ordered pore network, size tunability, surface functionality, optically transparent properties, and low toxicity, allowing control over drug loading and release kinetics. Moreover, the electronegative nature of mesoporous silica aids in the absorption of other substances with improved solubility and dissolution.23–313.2. Characterization of EFESD
![[thin space (1/6-em)]](https://www.rsc.org/images/entities/char_2009.gif) :
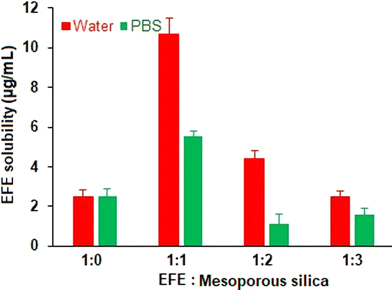
:![[thin space (1/6-em)]](https://www.rsc.org/images/entities/char_2009.gif) 1 ratio compared to the other ratios. Moreover, a 5-fold and 4-fold increase in EFE solubility from EFESD was observed in water and phosphate buffer (pH 6.8), respectively, compared to pure EFE (Fig. 1) attributed to the disordered amorphous structure of the solid dispersion.32 Considering the improvement in solubility, the EFESD with a 1
1 ratio compared to the other ratios. Moreover, a 5-fold and 4-fold increase in EFE solubility from EFESD was observed in water and phosphate buffer (pH 6.8), respectively, compared to pure EFE (Fig. 1) attributed to the disordered amorphous structure of the solid dispersion.32 Considering the improvement in solubility, the EFESD with a 1![[thin space (1/6-em)]](https://www.rsc.org/images/entities/char_2009.gif) :
:![[thin space (1/6-em)]](https://www.rsc.org/images/entities/char_2009.gif) 1 ratio was optimized and subjected to further evaluation. The total residual solvent in the EFESD was below 0.22% (w/w), justifying the use of methanol to obtain EFESD.
1 ratio was optimized and subjected to further evaluation. The total residual solvent in the EFESD was below 0.22% (w/w), justifying the use of methanol to obtain EFESD.
![[double bond, length as m-dash]](https://www.rsc.org/images/entities/char_e001.gif) O (1704.76 cm−1), aromatic nitro (1526.38 cm−1), C–N (1348 cm−1), P
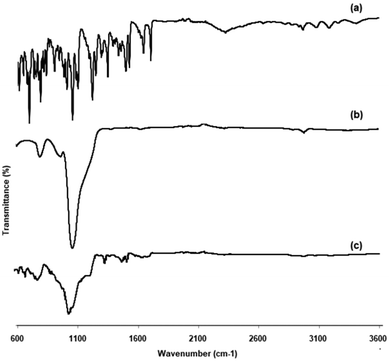
O (1704.76 cm−1), aromatic nitro (1526.38 cm−1), C–N (1348 cm−1), P![[double bond, length as m-dash]](https://www.rsc.org/images/entities/char_e001.gif) O (1101.15 cm−1) and NH stretching at 3415.31 cm−1. The FTIR spectrum of mesoporous silica showed silanol (Si–OH) symmetric stretching at 3396.49 cm−1, Si–O–Si bending at 1053.78 cm−1, and toxiloxan bond at 797.97 cm−1. However, the FTIR spectrum of EFESD exhibited the Si–O–Si bending at 1053.78 cm−1. The presence of a single peak of EFE and mesoporous silica in the FTIR spectrum of EFESD indicates no distinction at the molecular level between the internal structure and conformation of these samples.33
O (1101.15 cm−1) and NH stretching at 3415.31 cm−1. The FTIR spectrum of mesoporous silica showed silanol (Si–OH) symmetric stretching at 3396.49 cm−1, Si–O–Si bending at 1053.78 cm−1, and toxiloxan bond at 797.97 cm−1. However, the FTIR spectrum of EFESD exhibited the Si–O–Si bending at 1053.78 cm−1. The presence of a single peak of EFE and mesoporous silica in the FTIR spectrum of EFESD indicates no distinction at the molecular level between the internal structure and conformation of these samples.33
![[thin space (1/6-em)]](https://www.rsc.org/images/entities/char_2009.gif) :
:![[thin space (1/6-em)]](https://www.rsc.org/images/entities/char_2009.gif) 1, 1
1, 1![[thin space (1/6-em)]](https://www.rsc.org/images/entities/char_2009.gif) :
:![[thin space (1/6-em)]](https://www.rsc.org/images/entities/char_2009.gif) 2, and 1
2, and 1![[thin space (1/6-em)]](https://www.rsc.org/images/entities/char_2009.gif) :
:![[thin space (1/6-em)]](https://www.rsc.org/images/entities/char_2009.gif) 3 showed drug contents of 64.20 ± 1.98, 74.87 ± 1.25, and 62.35 ± 2.15 (values are expressed as mean ± SD, (n = 3)), respectively (Alam et al. 2018; Munir et al. 2022).38,39 The 1
3 showed drug contents of 64.20 ± 1.98, 74.87 ± 1.25, and 62.35 ± 2.15 (values are expressed as mean ± SD, (n = 3)), respectively (Alam et al. 2018; Munir et al. 2022).38,39 The 1![[thin space (1/6-em)]](https://www.rsc.org/images/entities/char_2009.gif) :
:![[thin space (1/6-em)]](https://www.rsc.org/images/entities/char_2009.gif) 2 ratio showed a higher drug content. However, it did not show solubility improvement compared to the 1
2 ratio showed a higher drug content. However, it did not show solubility improvement compared to the 1![[thin space (1/6-em)]](https://www.rsc.org/images/entities/char_2009.gif) :
:![[thin space (1/6-em)]](https://www.rsc.org/images/entities/char_2009.gif) 1 ratio. Considering the solubility, a ratio of 1
1 ratio. Considering the solubility, a ratio of 1![[thin space (1/6-em)]](https://www.rsc.org/images/entities/char_2009.gif) :
:![[thin space (1/6-em)]](https://www.rsc.org/images/entities/char_2009.gif) 1 was optimized and used for further analysis.
1 was optimized and used for further analysis.
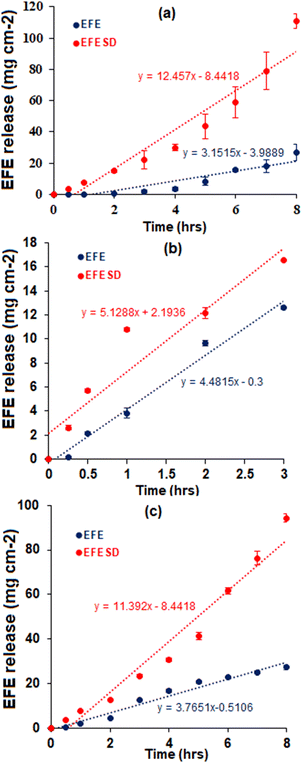 | ||
| Fig. 6 In vitro intrinsic dissolution profiles of EFE and EFESD in (a) distilled water, (b) 0.1 N HCl (pH 1.2) and (c) phosphate buffer (pH 6.8) (0.05% w/v SLS). | ||
| Dissolution medium | Rate of dissolution (mg cm−2 h−1) | |
|---|---|---|
| EFE | EFESD | |
| a Values are expressed as mean ± SD and n = 3. | ||
| 0.1 N HCl (pH 1.2) | 4.20 ± 0.26 | 6.23 ± 0.17 |
| Phosphate buffer (pH 6.8) (0.05% w/v SLS) | 3.40 ± 0.11 | 11.79 ± 0.24 |
| Distilled water | 3.36 ± 0.64 | 13.85 ± 0.59 |
![[thin space (1/6-em)]](https://www.rsc.org/images/entities/char_2009.gif) :
:![[thin space (1/6-em)]](https://www.rsc.org/images/entities/char_2009.gif) 30 v/v) compared to EFE. The improved solubility of EFE and the advantageous partitioning through the intestinal barrier were attributed to this. No discernible difference in penetration was observed across the three intestinal regions, indicating non-specific absorption of EFE through the small intestine.42
30 v/v) compared to EFE. The improved solubility of EFE and the advantageous partitioning through the intestinal barrier were attributed to this. No discernible difference in penetration was observed across the three intestinal regions, indicating non-specific absorption of EFE through the small intestine.42
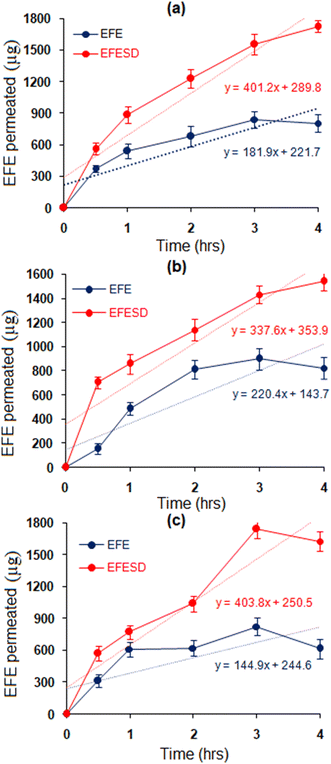 | ||
| Fig. 7 Ex vivo permeation study using non-everted rat intestine sections, viz. (a) duodenum, (b) jejunum and (c) ileum. | ||
| Parameters | Duodenum | Jejunum | Ileum | |||
|---|---|---|---|---|---|---|
| EFE | EFESD | EFE | EFESD | EFE | EFESD | |
| a Values are expressed as mean ± SD and n = 3. | ||||||
| Rate of permeation (μg h−1) | 144.44 ± 12.30 | 403.86 ± 6.06 | 207.84 ± 19.57 | 337.60 ± 16.08 | 181.97 ± 2.04 | 401.78 ± 12.05 |
| Apparent permeability coefficients (cm h−1) | 109.52 ± 12.13 | 321.54 ± 14.32 | 144.14 ± 18.74 | 274.97 ± 16.63 | 120.73 ± 9.80 | 283.94 ± 13.90 |
| Parameters | EFE | EFESD |
|---|---|---|
| a Values are expressed as mean ± SD and n = 3. | ||
| C max (ng mL−1) | 3547.56 ± 61.96 | 7453.73 ± 83.46 |
| T max (hours) | 2 | 3 |
| AUC (ng h mL−1) | 11![[thin space (1/6-em)]](https://www.rsc.org/images/entities/char_2009.gif) 883.52 ± 121.97 883.52 ± 121.97 |
16![[thin space (1/6-em)]](https://www.rsc.org/images/entities/char_2009.gif) 804.75 ± 132.56 804.75 ± 132.56 |
| MRT (hours) | 5.25 ± 0.56 | 2.27 ± 0.74 |
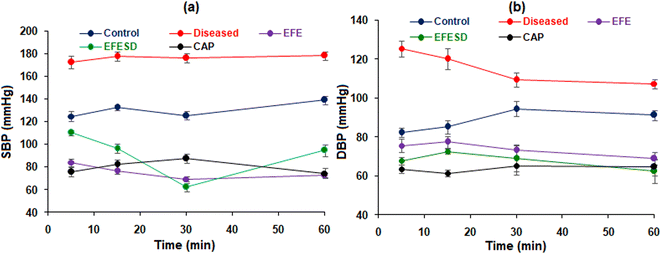 | ||
| Fig. 9 (a) Systolic and (b) diastolic blood pressure of the control, diseased, standard, EFE, and EFESD groups. | ||
| Groups | Mean arterial blood pressure (MABP) in mmHg at different time intervals | |||||
|---|---|---|---|---|---|---|
| Treatments (mg kg−1) | MABP after removing the clip | 5 min | 15 min | 30 min | 60 min | |
| a Values are expressed as mean ± SD (n = 6). Bars indicate ***P – 0.0001 and ****P < 0.000 via two-way ANOVA with Tukey's test analysis. | ||||||
| Control | Distilled water (p.o.) | — | 85.22 ± 1.13 | 88.51 ± 1.34 | 85.88 ± 1.21 | 92.89 ± 1.45 |
| Disease | Distilled water (p.o.) | 132.85 ± 2.05**** | 122.00 ± 1.50**** | 126.36 ± 1.22**** | 118.10 ± 1.55**** | 113.35 ± 1.87**** |
| Standard | 1 (iv) | 122.44 ± 2.68**** | 62.97 ± 2.18**** | 60.45 ± 1.07**** | 57.60 ± 1.70**** | 51.84 ± 2.86**** |
| EFE | 4.11 (iv) | 117.01 ± 2.24**** | 83.82 ± 3.13**** | 76.21 ± 2.16**** | 69.24 ± 2.08**** | 72.71 ± 1.89**** |
| EFESD | 4.11 (iv) | 109.67 ± 4.53**** | 73.33 ± 2.22**** | 67.67 ± 1.61**** | 60.54 ± 1.17**** | 71.90 ± 5.84**** |
4. Conclusion
Solid dispersion of poorly water-soluble EFE was prepared using mesoporous silica as a carrier by applying a solvent evaporation method. The significant absorption of EFE within the porous structure of mesoporous silica together with the transition from the crystalline to amorphous form in solid dispersion results in improved solubility, dissolution rate, intestinal permeability, and, ultimately, bioavailability and antihypertensive activity. Therefore, mesoporous silica can be used to prepare solid dispersions of other BCS class-II drugs, potentially improving their physicochemical properties and therapeutic efficacy.Abbreviations
| GIT | Gastrointestinal tract |
| EFE | Efonidipine hydrochloride ethanolate |
| BCS | Biopharmaceutical classification system |
| DMSO | Dimethyl sulfoxide |
| EFESD | Efonidipine hydrochloride ethanolate solid dispersion |
| CPCSEA | Committee for the purpose of control and supervision on experimental animals |
| IAEC | Institutional animal ethics committee |
| DSC | Differential scanning calorimetry |
| XRD | X-ray diffraction |
| FTIR | Fourier transform infrared |
| FESEM | Field emission scanning electron microscopy |
| EDTA | Ethylene diamine tetraacetic acid |
| ANOVA | Analysis of variance |
| SD | Standard deviation |
| MABP | Mean arterial blood pressure |
| SBP | Systolic blood pressure |
| DBP | Diastolic blood pressure |
| AUC | Area under curve |
| MRT | Mean residence time |
| SLS | Sodium lauryl sulphate |
| HPLC | High performance liquid chromatography |
| KRS | Krebs-Ringer solution |
Ethical statement
All animal experiments were carried out with the prior approval of the Institutional Animal Ethics Committee of Poona College of Pharmacy, Bharati Vidyapeeth Deemed University (PCP/IAEC/2021-22/2-40), registered under the Committee for the Purpose of Control and Supervision of Experiments on Animals, Government of India. All experiments were performed per the U. K. Animals Act (1986) and its accompanying recommendations, as detailed in the ARRIVE guidelines.Author contributions
Miss Swati Bharati: writing – original draft, drawing figure. Dr V. L. Gaikwad: supervision, editing, and review. Dr C. Bothiraja: supervision, editing, and review.Conflicts of interest
There are no conflicts to declare.References
- S. Gupta, R. Kesarla and A. Omri, Formulation Strategies to Improve the Bioavailability of Poorly Absorbed Drugs with Special Emphasis on Self-Emulsifying Systems, Adv. Challenges Pharm. Technol., 2021, 229–242 CAS.
- D. V. Bhalani, et al., Bioavailability Enhancement Techniques for Poorly Aqueous Soluble Drugs and Therapeutics, Biomedicines, 2022, 10, 1–33 CrossRef PubMed.
- M. S. Alqahtani, et al., Advances in Oral Drug Delivery, Front. Pharmacol., 2021, 12, 1–21 CrossRef PubMed.
- K. T. Savjani, A. K. Gajjar and K. Savjani, Drug Solubility: Importance and Enhancement Techniques, ISRN Pharm., 2012, 1–10 Search PubMed.
- D. Horter and J. B. Dressman, Influence of physiochemical properties on dissolution of drugs, Adv. Drug Delivery Rev., 1997, 25, 3–14 CrossRef.
- A. A. Enose, et al., Formulation and Characterization of Solid Dispersion Prepared by Hot Melt Mixing: A Fast Screening Approach for Polymer Selection, J. Pharm., 2014, 1–13 Search PubMed.
- T. Yokoyama, K. Ichihara and Y. Abiko, Efonidipine, a Long-Acting Dihydropyridine Derivative, Attenuates coronary Vasoconstriction Induced by Endothelin-1 in Dogs, Jpn. J. Pharmacol., 1996, 72, 291–297 CrossRef CAS PubMed.
- C. Shudo, et al., Studies on the hypotensive mechanisms of NZ-105, a new dihydropyridine derivative, in rats and rabbits, Gen. Pharmacol., 1993, 24, 411–418 CrossRef CAS PubMed.
- H. Tanaka and K. Shigenobu, Efonidipine hydrochloride: A dual blocker of L- and T-type Ca2+ channels, Cardiovasc. Drug Rev., 2002, 20, 81–92 CrossRef CAS PubMed.
- L. Kwon and C. Rosendorff, The Medical Treatment of Stable Angina, Chronic Coronary Artery Disease: A Companion to Braunwald's Heart Disease, Elsevier Inc., 2018, pp. 280–302 Search PubMed.
- C. P. Pandya and S. J. Rajput, Forced degradation study of efonidipine HCl ethanolate, characterization of degradation products by LC-Q-TOF-MS and NMR, J. Appl. Pharm. Sci., 2020, 10, 75–99 CAS.
- PubChem, Efonidipine, National Library of Medicine, 2020, accessed November 21, 2022.
- Drugs Controller General of India, Efonidipine, in Wikipedia, 2022, pp. 1–6.
- S. Sareen, L. Joseph and G. Mathew, Improvement in solubility of poor water-soluble drugs by solid dispersion, Int. J. Pharm. Invest., 2012, 2, 1–6 CrossRef.
- R. Malkawi, et al., Current Trends on Solid Dispersions: Past, Present, and Future, Adv. Pharmacol. Pharm. Sci., 2022, 1–17 Search PubMed.
- M. Kakran, L. Li and R. H. Müller, Overcoming the challenge of poor drug solubility, Pharm. Eng., 2012, 32, 82–89 Search PubMed.
- M. S. Attia, et al., Solid dispersion as a technical solution to boost the dissolution rate and bioavailability of poorly water-soluble drugs, Indian J. Pharm. Educ. Res., 2021, 55, s327–s339 CrossRef CAS.
- M. Otsuka, et al., Solid dispersions of efonidipine hydrochloride ethanolate with improved physicochemical and pharmacokinetic properties prepared with microwave treatment, Eur. J. Pharm. Biopharm., 2016, 108, 25–31 CrossRef CAS PubMed.
- X. Cheng, et al., In Vitro-In Vivo Correlation for Solid Dispersion of a Poorly Water-Soluble Drug Efonidipine Hydrochloride, AAPS PharmSciTech, 2020, 21, 1–16 CrossRef PubMed.
- A. S. Rajput, et al., RP-HPLC method development and validation for the quantification of Efonidipine hydrochloride in HME processed solid dispersions, Future J. Pharm. Sci., 2020, 6, 1–9 CrossRef.
- K. Bukara, et al., Oredered mesoporous silica to enhance the bioavailability of poorly water-soluble drugs: Proof of concept in man, Eur. J. Pharm. Biopharm., 2016, 108, 220–225 CrossRef CAS PubMed.
- K. Bukara, et al., Invivo performance of Fenofibrate formulated with ordered mesoporous silica versus 2-marketed formulation: a comparative bioavailability study in beagle dogs, J. Pharm. Sci., 2016, 105, 2381–2385 CrossRef CAS PubMed.
- S. Chaudhari and A. Gupte, Mesoporous Silica as a Carrier for Amorphous Solid Dispersion, Br. J. Pharm. Res., 2017, 6, 1–19 Search PubMed.
- B. Daravath, et al., Solubility and dissolution enhancement of flurbiprofen by solid dispersion using hydrophilic carriers, Braz. J. Pharm. Sci., 2017, 53, 1–10 Search PubMed.
- S. Shamsuddin, et al., Development and evaluation of solid dispersion of spironolactone using fusion method, Int. J. Pharm. Invest., 2016, 6, 63–68 CrossRef PubMed.
- A. Sharma and C. P. Jain, Preparation and characterization of solid dispersions of carvedilol with PVP K30, Res. Pharm. Sci., 2010, 5, 49–56 CAS.
- R. J. Chokshi, et al., Improving the dissolution rate of poorly water soluble drug by solid dispersion and solid solution – Pros and cons, Drug Delivery, 2007, 14, 33–45 CrossRef CAS PubMed.
- Z. Attari, et al., Enhanced ex vivo intestinal absorption of olmesartan medoxomil nanosuspension: Preparation by combinative technology, Saudi Pharm. J., 2015, 1–23 Search PubMed.
- S. Bharati, V. Gaikwad and C. Bothiraja, Bioanalytical method development and Validation for determination of efonidipine hydrochloride ethanolate in rat plasma by high-performance liquid chromatography: applications for pharmacokinetic study, Anal. Chem. Lett., 2023, 13(4), 394–402 CrossRef CAS.
- S. S. Sakat, et al., Antihypertensive effect of aqueous extract of Elaeocarpus ganitrus Roxb. seeds in renal artery occluded hypertensive rats, Int. J. PharmTech Res., 2009, 1, 779–782 Search PubMed.
- M. Alcoutlabi and G. McKenna, Effects of confinement on material behaviour at the nanometre size scale, J. Phys.: Condens. Matter, 2012, 17, 461–524 CrossRef.
- Y. Huang, et al., Enhanced solubility and bioavailability of apigenin via preparation of solid dispersions of mesoporous silica nanoparticles, Iran. J. Pharm. Res., 2019, 18, 168–182 CAS.
- O. Planinšek, B. Kovačič and F. Vrečer, Carvedilol dissolution improvement by preparation of solid dispersions with porous silica, Int. J. Pharm., 2011, 406, 41–48 CrossRef PubMed.
- K. Krishnamurthy and P. Patel, Solubility Enhancement of Diflunisal by Solid Dispersion Techniques, Int. J. Pharm. Res. Scholars, 2018, 7, 23–29 CrossRef.
- S. C. Arora, et al., Development, characterization and solubility study of solid dispersions of cefuroxime axetil by the solvent evaporation method, J. Adv. Pharm. Technol. Res., 2010, 1, 326–329 CAS.
- A. Das, et al., Solubility and Dissolution Enhancement of Etoricoxib by Solid Dispersion Technique Using Sugar Carriers, ISRN Pharm., 2011, 1–8 Search PubMed.
- Z. Xi, et al., Evaluation of the solid dispersion system engineered from mesoporous silica and polymers for the poorly water soluble drug indomethacin: In vitro and in vivo, Pharmaceutics, 2020, 12, 1–19 CrossRef PubMed.
- A. Alam, et al., Formulation and evaluation of solid dispersion and inclusion complex of poorly aqueous soluble diacerein, JOJ Mater. Sci., 2018, 5, 1–9 Search PubMed.
- M. U. Munir, et al., Fabrication, In Vitro and In Vivo Evaluation of Non-Ordered Mesoporous Silica-Based Ternary Solid Dispersions for Enhanced Solubility of Flurbiprofen, Pharmaceuticals, 2022, 15, 856–873 CrossRef CAS PubMed.
- P. C. Chiang, et al., In vitro and in vivo evaluation of amorphous solid dispersions generated by different bench-scale processes, using griseofulvin as a model compound, AAPS J., 2013, 15, 608–617 CrossRef CAS PubMed.
- S. Alshehri, et al., Enhanced Dissolution of Luteolin by Solid Dispersion Prepared by Different Methods: Physicochemical Characterization and Antioxidant Activity, ACS Omega, 2020, 5, 6461–6471 CrossRef CAS PubMed.
- W. L. Masiiwa and L. L. Gadaga, Intestinal Permeability of Artesunate-Loaded Solid Lipid Nanoparticles Using the Everted Gut Method, J. Drug Delivery, 2018, 1–9 Search PubMed.
- L. F. Yin, et al., In vitro and in vivo studies on a novel solid dispersion of repaglinide using polyvinylpyrrolidone as the carrier, Drug Dev. Ind. Pharm., 2012, 38, 1371–1380 CrossRef CAS PubMed.
- D. Villarreal, R. H. Freeman and J. O. Davis, Pathogenesis of one-kidney, one-clip hypertension in rats after renal denervation, Am. J. Physiol.: Heart Circ. Physiol., 1984, 16, 61–66 CrossRef PubMed.
- S. A. Nurfaradilla, F. C. Saputri and Y. Harahap, Effects of Hibiscus Sabdariffa Calyces Aqueous Extract on the Antihypertensive Potency of Captopril in the Two-Kidney-One-Clip Rat Hypertension Model, Evidence-Based Complementary Altern. Med., 2019, 1–8 Search PubMed.
| This journal is © The Royal Society of Chemistry 2024 |

