 Open Access Article
Dual-purpose resveratrol-quantum dots loaded albumin nanoparticles†
Deepankar
Yadav
a,
Priyanka
Chaudhary
 b,
Priya
Singh
ac,
Monu
Gupta
 b and
Shubhini A.
Saraf
 *ad
*ad
aDepartment of Pharmaceutical Sciences, Babasaheb Bhimrao Ambedkar University, Lucknow, 226025, India
bNanomaterials and Sensors Research Laboratory, Department of Physics, Babasaheb Bhimrao Ambedkar University, Lucknow-226025, India
cSchool of Pharmacy, GITAM (Deemed-to-be) University, Rudraram, Patancheru Mandal, Hyderabad-502329, Telangana, India
dNational Institute of Pharmaceutical Education and Research, Bijnor-Sisendi Road, Sarojini Nagar, Near CRPF Base Camp, Lucknow (UP)- 226002, India. E-mail: shubhini.saraf@gmail.com
First published on 9th September 2024
Abstract
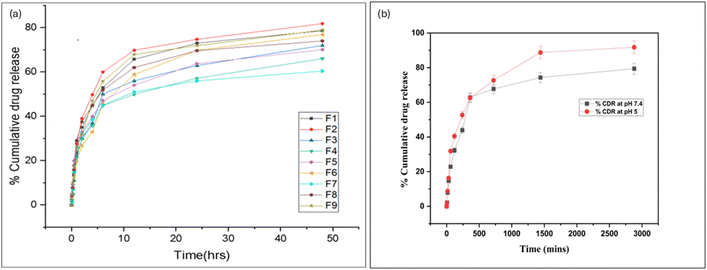
Incorporating therapeutic and imaging capabilities into core–shell structured nanoparticles (NPs) has shown promising results in cancer treatment. This study aims to develop paddy husk carbon quantum dots (QDs) encapsulated in bovine serum albumin (BSA) nanoparticles with resveratrol (RSV) to enhance antioxidant activity and bioimaging potential. Carbon QDs, approximately 10 nm in size, were synthesized and characterized by UV-visible spectroscopy, photoluminescence spectroscopy, TEM, and FTIR. The optimized formulation was achieved using a full-factorial design, resulting in a combination of BSA with concentration of 219.004 mg, RSV with concentration of 8.271 mg, and 4 mL of ethanol. The nanoparticles exhibited a particle size of 125.6 nm, a zeta potential of −0.570 mV, 63.06% entrapment efficiency, and 7.173 mg drug content. In vitro assays showed that the nanoparticles enhanced RSV release under mildly acidic conditions, demonstrating efficacy as intracellular drug carriers. Cytotoxicity assays against MDA-MB-231 cells revealed dose- and time-dependent cytotoxicity, with 72% cell viability for the optimized formulation at the highest concentration tested. Antioxidant activity was 96% for the optimized formulation, compared to 35–45% for QDs and 80–85% for RSV alone, as measured by DPPH and H2O2 assays. Confocal microscopy confirmed the superior imaging capability of the QDs. These findings indicate that QD- and resveratrol-loaded albumin nanoparticles (ANPs) have the potential to serve as effective cancer therapeutic agents and as biological imaging probes.
1. Introduction
Carbon quantum dots (QDs) are new nanostructures with specific properties; their bandgap varies with size and they exhibit photoluminescence. Less than ten nanometer-sized carbon nanoparticles, known as carbon quantum dots (QDs), can produce different colors because of confinement and size effects.1,2 In semiconductor materials, charge carriers have various energy levels, which are close to each other, forming energy bands. When the size of the crystal becomes similar to the Bohr radius, the electron energy levels separate.3 In developing photovoltaic devices, photocatalysis, chemical sensing, biosensing, bioimaging for intracellular targeting, and in many more fields, great use for carbon quantum dots has been found.4Reactive oxygen species (ROS) injure proteins or carbohydrates, producing oxidative stress because of the oxidation of metabolic by-products, causing cell death or necrosis. Antioxidants can lessen or prevent harm like oxidative degradation from high amounts of free radicals.5 Consequently, various industries, such as food and beverage, packaging, cosmetics, and health, depend on antioxidants and free-radical scavengers for reducing oxidative degradation. Carotenoids and other chemicals with lengthy conjugated carbon chains are often suitable as free-radical scavengers. Research has been performed on various carbon nanomaterials as scavengers of ROS and free radicals.6
Carbon quantum dots appear to have little cytotoxicity and good biocompatibility,7 meeting the fundamental requirements for in vivo imaging of cells and tissues. Paddy husk is a promising material for carbon quantum dots (PCQDs), with excellent water solubility, low toxicity, and good free-radical scavenging action. The C-dots (N/S-CDs) prepared from cellulose-based bio-waste show high fluorescence quantum yields. These PCQDs can neutralize free radicals and suppress lipid peroxidation, reducing the risk of oxidative stress-related illnesses and cell damage.8
Several green methods for synthesizing QDs using natural products like red cabbage, rice husk, and bio-waste have been reported.9 Bacterial species absorb the synthesized QDs, revealing their low levels of cytotoxicity and potential for bio-imaging applications.10 Various carbon nanodots (CNDs) have been produced by hydrothermally processing Mahonia oiwakensis Hayata (MO) plant parts and other agricultural waste. The CNDs were made by carbonizing various types of bamboo and wood.11 Graphene quantum dots have also been synthesized on a large scale from rice husk biomass.12
Here, we have synthesized carbon quantum dots using paddy husk (PCQDs), the protective covering of rice grains. Paddy husk is a by-product of rice milling and is typically considered agricultural waste. It has been employed as a raw material for synthesizing QDs since it is plentiful and inexpensive.13–17
PCQDs have high quantum yield, intense blue fluorescence, and are stable in water. In this work, we prepared carbon quantum dots from an environmentally friendly, agri-waste material, paddy husk. First, we assessed the cytotoxicity and antioxidant properties and obtained favorable results. Furthermore, the 2,2-diphenyl-1-picrylhydrazyl (DPPH) assay is a well-known, rapid, simple, and reasonably priced way to measure antioxidant activity. It uses free radicals to evaluate the capacity of a substance as a hydrogen supplier or free-radical scavenger (FRS). The separation of fluorescent carbon dots with quantifiable antioxidant properties from paddy husk, an agricultural waste source, makes this study novel.
Carbon quantum dots have acquired massive recognition among scientists due to their abundance, ecofriendly nature, water solubility, assorted usefulness, and biocompatibility when contrasted with other traditional quantum dots.18,19 Carbon dots are quasi-spherical nanoparticles that can be synthesized by various strategies.20 The bottom-up technique uses small organic atoms joined by microwave, thermal pyrolysis, and aqueous or solvothermal decomposition through partial dehydration and dehydrogenation.21 However, the top-down strategy continues to break down somewhat larger particles into smaller particles or nanoparticles through laser techniques.22 In general, quantum dots consist of a metallic core that can emit fluorescence, surrounded by a covering substance that prevents photobleaching and spilling. The central material is selected based on the ratio of light emitted to light absorbed by fluorophores to produce the most extreme quantum yield, which indicates the luminescence of the fluorescent material.23 Each energized electron is anticipated to reach the ground state and connect with its hole to create fluorescence. Carbon quantum dots have numerous chemical and mechanical properties, like enhanced fluorescence, high photostability, and excellent biocompatibility. Carbon dots are helpful nanotechnology instruments for the diagnosis and treatment of cancer.24 Natural carbon dots are used in drug delivery for sensing and tracing probes, photo-activated antimicrobial activity, cell reinforcement, and as neurodegenerative agents.25 They can be designed to attach valuable functional groups, such as amine, carboxyl, carbonyl, hydroxyl, ether, epoxy, and heteroatoms. Such surface functional groups greatly influence the characteristics of carbon dots. Surface functionalization enhances solubility in fluid arrangements as well as non-aqueous arrangements, while surface passivation improves fluorescence.26 Oxidative degradation caused by increased free radicals is one type of harm that antioxidants can prevent or minimize. Reactive oxygen species can be eliminated or reduced by antioxidants to a suitable level, preserving the normal function of biological systems.27 Research on the antioxidant activity of carbon quantum dots and their related antioxidant pathways is still significant and valuable for treating diseases, particularly those generated by free radicals directly or indirectly.28
Resveratrol is a powerful antioxidant with good bioactivity.24 However, it holds certain limitations, such as low solubility (30 mg L−1), short half-life (<1 h), and short circulation time. Delivering resveratrol via a suitable nanocarrier may help overcome these drawbacks. This research work envisaged synergizing the activity of resveratrol with quantum dots to enhance antioxidant activity, increase circulation time, circumvent RES uptake as the particle may become bigger, and improve its half-life using a suitable nanocarrier. The current efforts aim to overcome toxicity by creating quantum dots from natural sources, imaging cancer cells using biosensing techniques, and boosting antioxidant qualities using an appropriate nanocarrier system. To our knowledge, no work has been reported on quantum dots using paddy husk.
2. Material and methods
2.1. Materials
Paddy husks were collected from a paddy mill at Hardatt Nagar Girant village, District of Shravasti, Uttar Pradesh. They were used as a precursor for synthesizing carbon quantum dots (carbon source). Methyl thiazolyl tetrazolium (MTT), DPPH, and hydrogen peroxide were purchased from Thermo Fisher Scientific Pvt. Ltd, Mumbai, India. Mouse skin fibroblast (MDA-MB-231) and L929 cells were obtained from the National Centre for Cell Sciences (NCCS) in Pune, Maharashtra, India. Cayman Chemical Company (E. Ellsworth Road, Ann Arbor, MI, USA) supplied the RSV.2.2. Preparation of carbon quantum dots
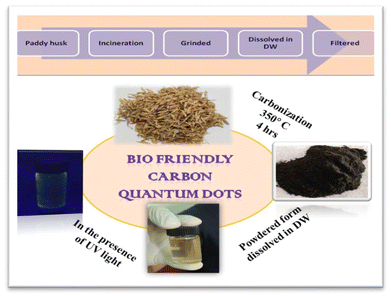
The detailed synthesis method of PCQDs (from paddy husk) is shown in Fig. 1. The required paddy husk was collected and carbonized at 350 °C for 4 h in a digital furnace. The carbonized husk particles were finely ground by subjecting them to shear forces in a mortar to reduce the particle size further. The resultant fine powder (0.1 g) was dissolved in 10 mL of DW under stirring for 8 h to prepare a solution. After passing through 0.22 μm pore filter paper, the solution was kept at ambient temperature for further analysis.292.3. Preparation of albumin nanoparticles
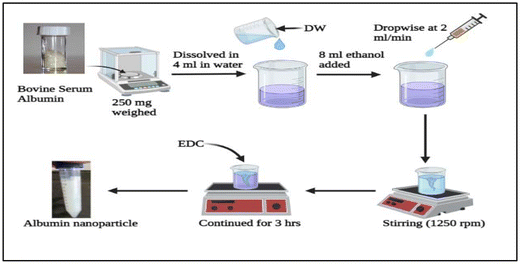
The desolvation procedure was used to prepare BSA (bovine serum albumin) nanoparticles with slight modification by utilizing 4 mL of water to dissolve 250 mg of BSA powder. Subsequently, 8 mL of ethanol was added dropwise at 2 mL min−1 to the BSA solution with constant stirring (1250 rpm) at room temperature using specially built apparatus. The presence of translucency in the fluid suggested that the nanoparticles were formed. To stabilize the unstable particles through cross-linking, 1-ethyl-3-(3-dimethyl aminopropyl) carbodiimide hydrochloride (EDC) (5 mg in 0.5 mL water) was added (Fig. 2). The stirring condition was maintained for three hours to ensure all amino acid residues were cross-linked.302.4. Co-loading of RSV and QDs in albumin NPs
The desolvation process was used to co-load resveratrol and QDs into albumin nanoparticles. BSA was weighed and mixed with carbon quantum dot-infused distilled water. Subsequently, using the specific apparatus and under continuous stirring (1250 rpm with a 1 cm magnet), ethanol was added dropwise at 2 mL min−1 to the BSA mixture at room temperature. The presence of turbidity in the fluid suggested that the nanoparticles were forming. To stabilize the unstable particles through cross-linking, 1-ethyl-3-(3-dimethylaminopropyl) carbodiimide hydrochloride (EDC) (5 mg in 0.5 mL water) was added. The solution was continuously stirred for three hours to ensure all amino acid residues were cross-linked.2.5. Instrumentation and characterization
![[thin space (1/6-em)]](https://www.rsc.org/images/entities/char_2009.gif) :
:![[thin space (1/6-em)]](https://www.rsc.org/images/entities/char_2009.gif) 10 ratio by weight), and compressed at 15
10 ratio by weight), and compressed at 15![[thin space (1/6-em)]](https://www.rsc.org/images/entities/char_2009.gif) 000 PSIG to create pellet discs. The pellets were then scanned with the FT-IR Nicolet, USA6700 apparatus, and the spectra were recorded and interpreted.32
000 PSIG to create pellet discs. The pellets were then scanned with the FT-IR Nicolet, USA6700 apparatus, and the spectra were recorded and interpreted.32
 | (1) |
DPPH assay. Various concentrations of the test samples were prepared. An accurately measured quantity of the test sample was transferred to a clean sample tube wrapped in aluminum foil. To this solution, 800 μL of 0.1 M Tris-HCl buffer (pH 7.4) and 1 mL of DPPH solution were added. The resultant solution was mixed well and placed in a dark chamber for 30 min. After analyzing the absorbance at 517 nm, the inhibition ratio was computed using eqn (2):
 | (2) |
H2O2 assay. This was performed to determine the CQD free-radical scavenging activity. Various concentrations of test samples were prepared. A phosphate buffer was prepared (as per IP) at pH 7.4. One mL of hydrogen peroxide solution was measured precisely, and 0.6 mL of phosphate buffer (pH 7.4) was added. The test solution was then added immediately. This was left at room temperature for 10 min in a dark chamber. Using a UV-visible spectrophotometer (Labtronics-LT 2910, India), absorbance was measured at 230 nm.35 The percentage of radical scavenging activity was determined using eqn (3):
 | (3) |
 | (4) |
3. Results and discussion
3.1. Characterization of quantum dots
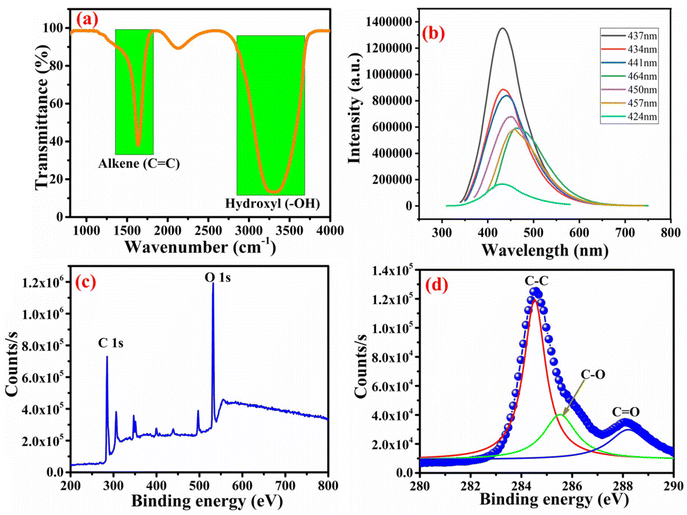
The interaction between the drug and quantum dot-loaded nanoparticles was confirmed by the FTIR study, as shown in Fig. 3a. The data for carbon quantum dots were observed from a wavelength of 4000 cm−1 to 750 cm−1. The corresponding functional groups were subsequently ascertained by interpreting the spectrum's significant peaks. A peak at around 1637.69 cm−1 was found to be due to the alkene (C![[double bond, length as m-dash]](https://www.rsc.org/images/entities/char_e001.gif) C) group. Another broad and intense peak for the hydroxyl group was observed at 3308.94 cm−1. These peaks confirmed the functional groups and the purity of the synthesized carbon quantum dots. Photoluminescence spectra of PCQDs are presented in Fig. 3b, which shows the prominent characteristics of the formation of quantum dots. The optical emission spectrum demonstrates the size-dependent features and the distinctive symbol of quantum confinement.39 With the excitation wavelength at 437 nm, the PCQDs show maximum spectra. The aqueous solution showed a green color in the UV light chamber. The formation of carbon quantum dots was physically confirmed by illumination under UV radiation. The absorption and emission peaks observed through PL indicated that the carbon quantum dots were uniformly formed. It is possible to learn more about the energy transfer procedures inside the material by looking at the photoluminescence spectra for various excitation wavelengths. Multiple emission peaks or variations in peak strength with excitation wavelength might point to flaws in the material or energy transfer between different electronic states. For example, the most significant peak intensity occurs at an excitation wavelength of 437 nm. Photoluminescence spectra can show whether a material has flaws or impurities. These flaws may bring energy levels into the material's bandgap, producing recognizable emission peaks in the ranges. Researchers can learn more about the kind and concentration of flaws or impurities by examining variations in emission intensity and peak locations at various excitation wavelengths. As the excitation wavelength decreases, blue-shifted emission may be seen in the photoluminescence spectra of CQDs. Smaller CQDs have a wider bandgap and emit light at higher energies, which is related to size-dependent quantum confinement effects and the blueshift. Fig. 3c and d show the elemental analysis of PCQDs. The XPS spectrum of the synthesized PCQDs reveals the presence of carbon and oxygen verifying quantum dots. Binding energy positions at 285.8, 285, and 287 eV in the XPS spectrum correspond to deconvoluted peaks that indicate available bonds between C–C, C–O, and C
C) group. Another broad and intense peak for the hydroxyl group was observed at 3308.94 cm−1. These peaks confirmed the functional groups and the purity of the synthesized carbon quantum dots. Photoluminescence spectra of PCQDs are presented in Fig. 3b, which shows the prominent characteristics of the formation of quantum dots. The optical emission spectrum demonstrates the size-dependent features and the distinctive symbol of quantum confinement.39 With the excitation wavelength at 437 nm, the PCQDs show maximum spectra. The aqueous solution showed a green color in the UV light chamber. The formation of carbon quantum dots was physically confirmed by illumination under UV radiation. The absorption and emission peaks observed through PL indicated that the carbon quantum dots were uniformly formed. It is possible to learn more about the energy transfer procedures inside the material by looking at the photoluminescence spectra for various excitation wavelengths. Multiple emission peaks or variations in peak strength with excitation wavelength might point to flaws in the material or energy transfer between different electronic states. For example, the most significant peak intensity occurs at an excitation wavelength of 437 nm. Photoluminescence spectra can show whether a material has flaws or impurities. These flaws may bring energy levels into the material's bandgap, producing recognizable emission peaks in the ranges. Researchers can learn more about the kind and concentration of flaws or impurities by examining variations in emission intensity and peak locations at various excitation wavelengths. As the excitation wavelength decreases, blue-shifted emission may be seen in the photoluminescence spectra of CQDs. Smaller CQDs have a wider bandgap and emit light at higher energies, which is related to size-dependent quantum confinement effects and the blueshift. Fig. 3c and d show the elemental analysis of PCQDs. The XPS spectrum of the synthesized PCQDs reveals the presence of carbon and oxygen verifying quantum dots. Binding energy positions at 285.8, 285, and 287 eV in the XPS spectrum correspond to deconvoluted peaks that indicate available bonds between C–C, C–O, and C![[double bond, length as m-dash]](https://www.rsc.org/images/entities/char_e001.gif) O.40 The sharp peak at 285.8 eV shows the sp2 graphitic structure of synthesized PCQDs. The XPS analysis revealed no contaminants, confirming the purity of the PCQDs in their as-synthesized form.
O.40 The sharp peak at 285.8 eV shows the sp2 graphitic structure of synthesized PCQDs. The XPS analysis revealed no contaminants, confirming the purity of the PCQDs in their as-synthesized form.
UV-visible spectroscopy is based on Beer-Lambert's law. A monochromatic light beam is split into two beams of equal intensity when passed through a beam splitter. One of the two beams passes through the material sample, and the other passes through a reference cell. The beams transmitted through the sample and reference cells are measured as I and Io, respectively.
| αhν = K(hν − Eg)n | (5) |
| (αhν)1/n = A(hν − Eg) | (6) |
The direct allowed and indirect allowed bandgaps can be determined by substituting the values of n as 1/2 and 2, respectively. The bandgap of the nanomaterial in PCQDs was determined from eqn (5) and (6) by extrapolating between the (αhν)1/2 on the Y-axis and hν on the X-axis, as shown in Fig. 4b. The optical bandgap for PCQDs was 5.27 eV, which is too high and confirms quantum confinement.
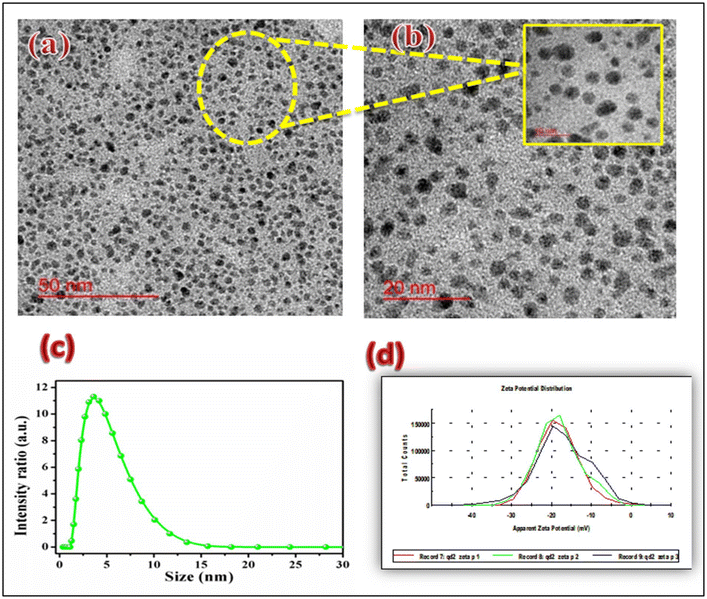 | ||
| Fig. 4 (a) TEM image at the 50 nm scale, (b) TEM image at the 20 nm scale, (c) particle size distribution and (d) zeta potential study. | ||
TEM images, shown in Fig. 4a and b, clearly reveal the particle size distribution of PCQDs. The homogeneous size distribution of the particles is visible in these TEM images. The particle size was determined to be between 2 and 5 nm. The PCQDs are scattered evenly, and there is no prominent grouping. This outcome demonstrated that the PCQDs are made entirely of carbon and not a blend of different organic components.
The particle size distribution was determined using a Nanozetasizer (NSZ90 Malvern) to execute the dynamic light scattering (DLS) method to confirm the size of the carbon quantum dots. Here, the DLS system employs the idea of Brownian motion of particles in a diluted solution of the precursor. When the corresponding data were studied, it was evident that there was just one peak, and the particles were distributed evenly. The average particle sizes were found to be in the range of 2–10 nm. The particle size distribution in the DI water solution is shown in Fig. 4c.
The zeta potential is an important property that characterizes the surface charge of particles or materials in a liquid medium. Carbon quantum dots (CQDs) are nanoscale carbon-based materials with unique properties, including high surface-to-volume ratio (S/V) and tunable surface chemistry. Fig. 4d presents the plot of the zeta potential study of PCQDs, which shows their better stability (−40 mV) and quantum-confined size.
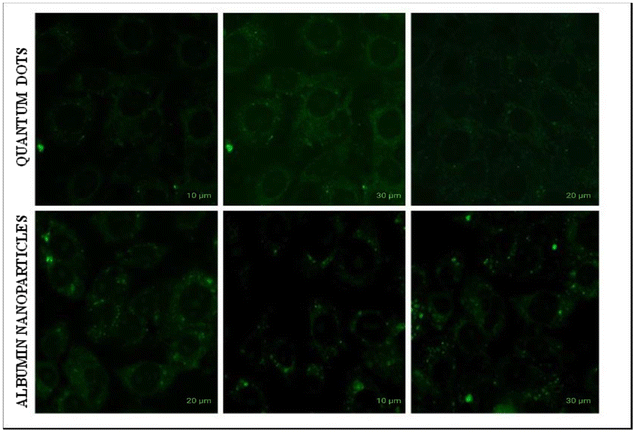
Transmission microscopy allows us to visualize carbon quantum dots with high-resolution and three-dimensional imaging. It helps to characterize their size, shape, and distribution within a sample. Fig. 4a shows the TEM image at 50 nm scale, and Fig. 4b shows the enlarged aerial view of quantum dots. Confocal microscopy enables the imaging of these quantum dots to be observed based on their fluorescence emission, which provides their photophysical properties, such as emission wavelength, intensity, and lifetime.
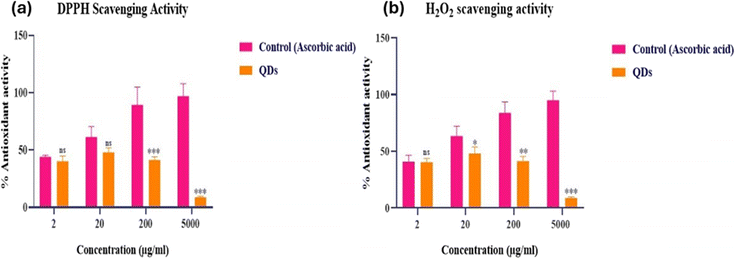
Because of their unprecedented properties, quantum dots have potential for extraordinary applications in medication and drug pharmacy, particularly in cell labeling and long-term bio-imaging.38 However, these nanoparticles cause reactive oxygen species to age, which has a negative impact on metabolic cycles and cell viability. The antioxidant potential of CQDs was determined via DPPH and H2O2 assays, as presented in Fig. S2.† CQDs and ascorbic acid were shown to have concentration-dependent DPPH radical-scavenging activity. The DPPH assessment uses the free-radical scavenging principle as its foundation. DPPH, or 1,1-diphenyl-2-picrylhydrazyl, is a purple, persistent free radical that absorbs light at 517 nm. When free radicals are scavenged, the colour of DPPH changes to yellow. Reactive oxygen species produce hydrogen peroxide (H2O2) as a metabolic byproduct. Antioxidant drugs can reduce H2O2 and regulate various oxidative stress-related states. CQDs at 20 μg mL−1 showed maximum radical-scavenging activity at around 48% during their H2O2 scavenging activity, and CQDs at 20 μg mL−1 showed total radical-scavenging activity of about 49% via their DPPH scavenging activity. As a result of these findings in the current investigation, the produced CQDs may be used as scavengers or inhibitors of free radicals. No significant (p = 0.05) changes were seen in any data for the parameters examined.
3.2 Optimization of formulation variables via complete factorial design
In this study, three independent variables, including albumin concentration, ethanol volume, and drug concentration, were considered, which significantly influenced the observed responses of particle size, zeta potential, and entrapment efficiency of resveratrol.| Run | Albumin conc. (mg) | Ethanol (mL) | Resveratrol (mg) | Particle size (nm) | Zeta potential (mV) | Entrapment efficiency (%) |
|---|---|---|---|---|---|---|
| 1 | 300 | 4 | 10 | 127.3 | −6.65 | 75.2 |
| 2 | 200 | 12 | 10 | 129.4 | 0.104 | 53.3 |
| 3 | 250 | 8 | 7.5 | 155 | −0.204 | 60.2 |
| 4 | 300 | 12 | 10 | 148 | −4.04 | 45.5 |
| 5 | 200 | 4 | 10 | 126 | −0.55 | 64.86 |
| 6 | 200 | 12 | 5 | 118.3 | −0.103 | 46.4 |
| 7 | 300 | 12 | 5 | 125.6 | −0.37 | 51.42 |
| 8 | 300 | 4 | 5 | 177.8 | −0.44 | 59.87 |
| 9 | 200 | 4 | 5 | 145.4 | −0.472 | 54.4 |
Zeta potential. The zeta potential range of the prepared albumin nanoparticle batches was −6.65 to 0.104 mV. Table 1 displays the maximum and minimum PDI for runs 2 and 1, respectively.
Entrapment efficiency. The entrapment efficiency range of the prepared albumin nanoparticle batches was found to be 45.5 to 75.2%. The maximum entrapment efficiency was shown by run 1and the minimum by run 4, as shown in Table 1.
3.3. Characterization of the optimized formulation
The antioxidant potential of QDs, RSV, and the optimized formulation was also determined via the DPPH and H2O2 assays, respectively. DPPH, or 1,1-diphenyl-2-picrylhydrazyl, is a stable free radical with a purple color absorbed at 517 nm. When free radicals are scavenged, DPPH changes color to a yellow hue. Antioxidant activity of QDs was found to be 35–45%, and that of resveratrol was found to be 80–85% via both DPPH and H2O2. The optimized formulation has 96% antioxidant activity that shows a synergistic effect of QDs and RSV. The antioxidant activity of QDs, as assessed by both the DPPH and H2O2 assays, falls within the range of 35–45%. While this level of antioxidant activity is notable, it is relatively moderate compared to other antioxidant compounds. QDs are not typically known for their antioxidant properties, and their primary applications are often related to their unique optical and electronic properties. However, they may still have some capacity to scavenge free radicals to a certain extent. RSV exhibited higher antioxidant activity, ranging from 80–85% in the DPPH and H2O2 tests.6 This is consistent with the known antioxidant potential of RSV, which has been extensively studied for its health benefits. The optimized formulation demonstrates 96% antioxidant activity in both assays. This result indicates a remarkable increase in antioxidant efficacy compared to the individual components (QDs and RSV). The synergistic impact shows that combining QDs and RSV in the optimized formulation has a substantially stronger antioxidant effect than the sum of their individual activities. (Fig. 7). Antioxidants play a crucial role in protecting cells and tissues from oxidative damage, and a formulation with a synergistic effect like this one may have significant benefits in combating oxidative stress-related conditions.44
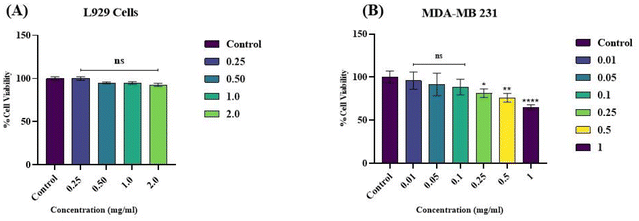
Mouse skin fibroblast cell line. According to Fig. 8, the % cell viability of L929 cells exposed to different concentrations of quantum dots was assessed by the MTT assay at 24, 48, 72, and 96 h. At each time, the values obtained for the control samples were taken as baseline values and compared with those of the corresponding exposed samples. The values are expressed as mean ± SEM of data from three separate studies. (*p < 0.05, **p < 0.01, ***p < 0.001, ****p < 0.0001). The percentage cell viability at 24 h for all the concentrations reduced significantly compared to the control, except for the 0.25 mg mL−1 concentration that did not affect cells. Approximately 90% of cells were viable at 1 mg mL−1 concentration up to 24 h of exposure, and more than 90% were viable at 2 mg mL−1 concentration up to 24 h. However, beyond 24 hours, the quantum dots might have degraded in the medium, allowing the cells to restore their normal physiological function. This is reflected by the increase in the percentage cell viability up to 96 h.45 Based on the results of the cell viability study, it was observed that increasing the quantum dot sample concentration did not significantly affect normal cells. This is likely due to the use of natural paddy husk in synthesizing the quantum dots. Therefore, we can predict that the quantum dots are safe for normal cells.
Metastatic breast cancer cell line. After treating MDA-MB-231 cells with QDs for 24 h, MTT assays were performed to estimate the cytotoxicity of the QDs on malignant cells. When the applied QD concentrations ranged from 1 to 1000 μg mL−1 for MDA-MB-231 cells treated for 24 h, the cell viability of the three groups was maintained at over 90%. For L929 cells treated for 24 h, the trends in cell viability followed a similar pattern; the cell viability was maintained at over 80% for 0.1 mg mL−1. However, a different pattern was observed when we increased the incubation period to 48 h. As the QD concentration rose 48 h after treatment, cell viability dropped, indicating that the QDs had concentration-dependent cytotoxicity on cell viability. Cancerous cells have a cell membrane that is leaky or ruptured. Due to this, quantum dots can easily cross the cell membrane and cause cytotoxicity, or cell death, to cancer cells. If the quantum dots are loaded with an anticancer drug within a suitable carrier, it could be a better drug delivery method for cancer treatment.
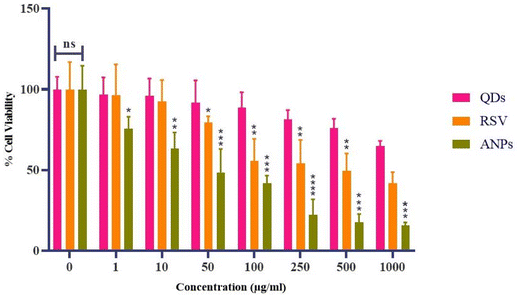
Cytotoxicity assay for albumin nanoparticles. The cytotoxicity of the samples (RSV, QD, and optimized albumin nanoparticles) was evaluated by the MTT assay on MDA-MB-231 cells. The results of the MTT assay revealed the compatibility of the QDs. QDs showed 64.93 ± 3.12% cell viability at the higher concentration of 1000 μg mL−1, RSV showed 41.71 ± 6.98% cell viability at the concentration of 1000 μg mL−1, and for the optimized formulation it was found to be 15.76 ± 1.76%. IC50 values for RSV, QDs, and optimized albumin nanoparticles were 104.4 μg mL−1, 1551 μg mL−1, and 51 μg mL−1, respectively. The IC50 value of the optimized formulation is low because the drug accumulation in the cells is higher than the naïve drug and quantum dots. However, loading this drug and quantum dots into a carrier like albumin nanoparticles shows a better cytotoxicity effect on cancerous cell lines. Due to the nano-size range of particles and better internalization into cells, the lowest IC50 concentration was found in the final optimized nanoformulations.
Fig. 9 shows morphological evaluations of MDA-MB-231 cells after treatment with RSV, QDs, and the optimized formulation. Quantum dots have very high cell viability, meaning they are nontoxic because they are synthesized from a natural source. Cell-to-cell adhesion was lost in the RSV and optimized formulation, leading to cell blebbing conditions.46 One of the components of human blood is albumin. As an endogenous protein (35–50 g L−1 human serum), it exhibits minimal immunogenicity, and albumin-based nanoparticles guarantee its biocompatibility. In human blood, albumin has an average half-life of about 19 days. Albumin has a longer half-life than free medicines, which helps increase the plasma area under the curve (AUC) value and sustain a high plasma drug concentration for a considerable time.
4. Conclusion
QDs lead to many unique optical and transport properties. They are environmentally safe, easily handled, non-toxic, and can be made from a high-carbon source. The current project focuses on synthesizing quantum dots from an agricultural material (paddy husk) employed for fluorescence and bio-imaging features. Resveratrol, a powerful antioxidant, has limitations, such as low solubility, short half-life (<1 h), and low circulation time. Delivering the resveratrol via a suitable nanocarrier and utilizing QDs for their synergistic antioxidant activity was achieved. Combining resveratrol and quantum dots in albumin nanoparticles enhanced the antioxidant activity. The prepared nanoparticles had multifunctional properties (synergized antioxidant efficacy, delivery, and bioimaging). The current study successfully utilized QDs as probes for imaging in MDA-MB-231 cells. Results obtained were satisfactory, with superior imaging and enhanced antioxidant activity, suggesting that the work undertaken has good translational potential. The study can be conducted with other drugs for potential applications in theranostics as future scope.Conflicts of interest
The authors declare that there is no conflict of interest.References
- M. A. Mahjoub, G. Monier, C. Robert-Goumet, F. Réveret, M. Echabaane, D. Chaudanson, M. Petit, L. Bideux and B. Gruzza, J. Phys. Chem. C, 2016, 120, 11652–11662 CrossRef CAS.
- M. Kurian and A. Paul, Carbon Trends, 2021, 3, 100032 CrossRef CAS.
- M. Ballabio and E. Cánovas, ACS Nanosci. Au, 2022, 2, 367–395 CrossRef CAS.
- L. Llatance-Guevara, N. E. Flores, G. O. Barrionuevo and J. L. Mullo Casillas, Catalysts, 2022, 12, 1091 CrossRef CAS.
- N. A. A. Nazri, N. H. Azeman, M. H. A. Bakar, N. N. Mobarak, T. H. T. A. Aziz, A. R. M. Zain, N. Arsad, Y. Luo and A. A. A. Bakar, Nanomaterials, 2022, 12, 2999 CrossRef CAS PubMed.
- R. Das, R. Bandyopadhyay and P. Pramanik, Mater. Today Chem., 2018, 8, 96–109 CrossRef CAS.
- K. J. Nordell, E. M. Boatman and G. C. Lisensky, J. Chem. Educ., 2005, 82, 1697 CrossRef.
- M. Hamer, E. Tóvári, M. Zhu, M. D. Thompson, A. Mayorov, J. Prance, Y. Lee, R. P. Haley, Z. R. Kudrynskyi, A. Patanè, D. Terry, Z. D. Kovalyuk, K. Ensslin, A. V. Kretinin, A. Geim and R. Gorbachev, Nano Lett., 2018, 18, 3950–3955 CrossRef CAS PubMed.
- W. Widowati, C. N. Ginting, I. N. E. Lister, E. Girsang, A. Amalia, S. H. B. Wibowo, H. Kusuma and Rizal, Trop. Life Sci. Res., 2020, 31, 127–144 Search PubMed.
- J. Zhou, Z. Sheng, H. Han, M. Zou and C. Li, Mater. Lett., 2012, 66, 222–224 CrossRef CAS.
- A. Nair, J. T. Haponiuk, S. Thomas and S. Gopi, Biomed. Pharmacother., 2020, 132, 110834 CrossRef CAS.
- R. K. Shukla, V. Sharma, A. K. Pandey, S. Singh, S. Sultana and A. Dhawan, Toxicol. in Vitro, 2011, 25, 231–241 CrossRef CAS PubMed.
- V. Singh, T. Marimuthu, M. M. Makatini and Y. E. Choonara, Polymers, 2022, 14, 5371 CrossRef CAS.
- E. Atta, N. Mohamed and A. Abdelgawad, Eur. Chem. Bull., 2017, 6, 365–375 CrossRef CAS.
- A. Srivastava, S. Singh, A. Pandey, D. Kumar, C. Rajpurohit, V. Khanna and A. Pant, Mol. Neurobiol., 2018, 55, 8293–8305 CrossRef CAS.
- A. Sharma, P. Chaudhary, A. Verma, R. K. Tripathi, R. Kumar, G. Gupta, D. P. Mondal, B. C. Yadav and A. K. Srivastava, ECS J. Solid State Sci. Technol., 2023, 12, 27004 CrossRef.
- Z. Zhang, W. Sun and P. Wu, ACS Sustainable Chem. Eng., 2015, 3, 1412–1418 CrossRef CAS.
- A. Zarepour, A. Khosravi, N. Yücel Ayten, P. Çakır Hatır, S. Iravani and A. Zarrabi, J. Mater. Chem. B, 2024, 12, 4307–4334 RSC.
- A. Nair, J. T. Haponiuk, S. Thomas and S. Gopi, Biomed. Pharmacother., 2020, 132, 110834 CrossRef CAS.
- N. S. Kulkarni, Y. Guererro, N. Gupta, A. Muth and V. Gupta, J. Drug Delivery Sci. Technol., 2019, 49, 352–364 CrossRef CAS.
- S. Wang, L. Chen, J. Wang, J. Du, Q. Li, Y. Gao, S. Yu and Y. Yang, Mater. Sci. Eng., C, 2020, 116, 111233 CrossRef CAS PubMed.
- E. Dhandapani, N. Duraisamy and R. Mohan Raj, Mater. Today: Proc., 2022, 51, 1696–1700 CAS.
- F. F. An and X. H. Zhang, Theranostics, 2017, 7, 3667–3689 CrossRef CAS.
- Y. Hangun-Balkir and M. L. McKenney, Green Chem. Lett. Rev., 2012, 5, 147–153 CrossRef CAS.
- X. Liu, G. B. Braun, H. Zhong, D. J. Hall, W. Han, M. Qin, C. Zhao, M. Wang, Z. G. She, C. Cao, M. J. Sailor, W. B. Stallcup, E. Ruoslahti and K. N. Sugahara, Adv. Funct. Mater., 2016, 26, 267–276 CrossRef CAS.
- N. Lomis, S. Westfall, L. Farahdel, M. Malhotra, D. Shum-Tim and S. Prakash, Nanomaterials, 2016, 6, 116 CrossRef.
- I. Gülçin, Innovative Food Sci. Emerging Technol., 2010, 11, 210–218 CrossRef.
- B. D. Mansuriya and Z. Altintas, Materials, 2020, 13, 96 CrossRef CAS.
- L. Zhao, Y. Wang and Y. Li, Nanomaterials, 2019, 9, 1708 CrossRef CAS PubMed.
- F. F. An and X. H. Zhang, Theranostics, 2017, 7, 3667–3689 CrossRef CAS PubMed.
- S. Chakraborty, I. Ehsan, B. Mukherjee, L. Mondal, S. Roy, K. Das Saha, B. Paul, M. C. Debnath and T. Bera, Nanomedicine, 2019, 20, 102006 CrossRef CAS PubMed.
- A. Al Hoque, D. Dutta, B. Paul, L. Kumari, I. Ehsan, M. Dhara, B. Mukherjee, M. Quadir, B. A. Kaipparettu, S. Laha and S. Ganguly, Cancer Nanotechnol., 2023, 14, 73 CrossRef CAS.
- I. Ehsan, L. Kumari, R. Sen, A. Hoque, B. Mukherjee, A. Mukherjee, P. Ghosh and S. Bhattacharya, J. Drug Delivery Sci. Technol., 2022, 75, 103689 CrossRef CAS.
- M. M. M. Zayed, H. A. Sahyon, N. A. N. Hanafy and M. A. El-Kemary, Pharmaceutics, 2022, 14, 1160 CrossRef PubMed.
- L. Zhao, Y. Wang and Y. Li, Nanomaterials, 2019, 9, 1708 CrossRef CAS.
- C. E. Bradburne, J. B. Delehanty, K. Boeneman Gemmill, B. C. Mei, H. Mattoussi, K. Susumu, J. B. Blanco-Canosa, P. E. Dawson and I. L. Medintz, Bioconjugate Chem., 2013, 24, 1570–1583 CrossRef CAS PubMed.
- Z. Liang, M. B. Khawar, J. Liang and H. Sun, Front. Oncol., 2021, 11, 749970 CrossRef CAS PubMed.
- K. D. Wegner and N. Hildebrandt, Chem. Soc. Rev., 2015, 44, 4792–4834 RSC.
- A. Foerster and N. A. Besley, J. Phys. Chem. A, 2022, 126, 2899–2908 CrossRef CAS.
- J. Drbohlavova, V. Adam, R. Kizek and J. Hubalek, Int. J. Mol. Sci., 2009, 10, 656–673 CrossRef CAS PubMed.
- J. M. Llabot, I. Luis de Redin, M. Agüeros, M. J. Dávila Caballero, C. Boiero, J. M. Irache and D. Allemandi, J. Drug Delivery Sci. Technol., 2019, 52, 379–385 CrossRef CAS.
- A. Jithan, K. Madhavi, M. Madhavi and K. Prabhakar, Int. J. Pharm. Invest., 2011, 1, 119 CrossRef CAS.
- V. Lobo, A. Patil, A. Phatak and N. Chandra, Pharmacogn. Rev., 2010, 4, 118–126 CrossRef CAS PubMed.
- P. Yadav and A. Yadav, Futur. J. Pharm. Sci., 2021, 7, 200 CrossRef.
- R. A., S. Jagadeesan, Y.-J. Cho, J.-H. Lim and K. H. Choi, Mater. Sci. Eng., C, 2017, 81, 551–560 CrossRef PubMed.
- A. Sabzi, A. Rahmani, M. Edalati, H. Kahroba, M. R. Dadpour, R. Salehi and A. Zarebkohan, Colloids Surf., B, 2020, 194, 111225 CrossRef CAS PubMed.
Footnote |
| † Electronic supplementary information (ESI) available. See DOI: https://doi.org/10.1039/d4pm00100a |
| This journal is © The Royal Society of Chemistry 2024 |

