
 Open Access Article
 This Open Access Article is licensed under a Creative Commons Attribution-Non Commercial 3.0 Unported Licence
Thermodynamic and kinetic analysis of the melting process of S-ketoprofen and lidocaine mixtures†
Kanji
Hasegawa
,
Sara
Ogawa
,
Hitoshi
Chatani
,
Hikaru
Kataoka
 ,
Tomohiro
Tsuchida
and
Satoru
Goto
*
,
Tomohiro
Tsuchida
and
Satoru
Goto
*
Faculty of Pharmaceutical Sciences, Tokyo University of Science, 2641 Yamazaki, Noda, Chiba 278-8510, Japan. E-mail: s.510@rs.tus.ac.jp
First published on 25th May 2024
Abstract
Eutectic mixtures are often used in drug design and delivery. Herein, thermodynamic and kinetic analyses of the melting process of S-ketoprofen (KTP)/lidocaine (LDC) mixtures were performed by using differential scanning calorimetry (DSC) and Fourier-transform infrared spectroscopy (FTIR) measurements to trace the composition and melting process of KTP/LDC mixtures. In the binary solid–liquid phase diagram, a constant melting point of 294 K was observed, which is lower than the theoretical eutectic point of 304 K. It is believed that the hydrogen-bonding interactions between KTP and LDC caused a further decrease in the melting point. Melting at 304 K resulted from a eutectic reaction, whereas melting at 294 K was interpreted as the preliminary melting step. A kinetic analysis of the melting process was made possible by performing singular value decomposition (SVD) on a dataset of the FTIR spectra. The principal component vector indicating the magnitude of the contribution of the preliminary melting step reflects the time change in which the molten KTP signal increases after the molten LDC signal increases, which fits the sequential reaction equation. This confirms the preliminary melting stage at 294 K, as indicated by the binary solid–liquid phase diagram obtained by DSC. The activation energy was determined from the reaction rate constant, and a scenario for forming a eutectic mixture was proposed based on the mole fractions of KTP and LDC.
1. Introduction
The solubility of drugs is essential for controlling the bioavailability in the pharmaceutical field.1 A significant percentage of drugs (40% approved, 90% discovered) exhibit poor solubility in water.2 Eutectic systems, commonly used in alloy engineering and metallurgy, have applications in drug development.3 Formation of eutectic and deep eutectic mixtures or solvents enhances the aqueous solubility and bioavailability of active pharmaceutical ingredients (APIs).4 Combining anionic and cationic drugs can enhance solubility by forming hydrophobic complexes via electrostatic interactions.5 Lowering the melting point (Tm) via eutectic mixtures can increase the solubility and drug delivery efficiency.6 EMLA Cream® and S-Caine™ Peel are examples of utilizing eutectic mixtures of local anesthetics for enhanced solubility and effectiveness.7,8 The specific combination of lidocaine (LDC, Tm = 341 K) and prilocaine or that of lidocaine and tetracaine form eutectic mixtures with lowered melting points and increased solubility. Mixing equimolar amounts of indomethacin (INM, Tm = 433 K) and LDC readily yielded a eutectic mixture with Tm of 314 K.9 The water solubility of the INM/LDC mixture was greater than that of INM or LDC alone.10 LDC is an efficient solubilizer of acidic drugs and acts as a stable solvent with a low melting point.In our previous study, we investigated the effects of solubility and membrane permeability to identify combinations that enhance or reduce the solubility and membrane permeability caused by physical interactions between two drugs in the solid phase or solution.10,11 This will help select the optimal formulation for multidrug therapy and optimize formulations that are easier to handle. Local anesthetics similar to LDC, such as procaine (PRO, Tm = 334 K), tetracaine (TET, Tm = 316 K), and dibucaine (DIB, Tm = 338 K), can also be mixed with INM. They form covalent mixtures with melting points of 313, 303, and 325 K. Hydrophilic LDC and PRO increased the solubility of INM, whereas hydrophobic TET and DIB decreased their solubility. Aqueous solubility of eutectic mixtures of acidic INM and these basic drugs depended on hydrophobicity (log![[thin space (1/6-em)]](https://www.rsc.org/images/entities/char_2009.gif) PLA) and melting point depression (R·ΔTm).10 Basic additives have been suggested to interact directly with INM and change its solubility. Additionally, various local anesthetics, including LDC, increase the octanol/water partition coefficient of INM, which is related to the inherent hydrophobicity of local anesthetics.11
PLA) and melting point depression (R·ΔTm).10 Basic additives have been suggested to interact directly with INM and change its solubility. Additionally, various local anesthetics, including LDC, increase the octanol/water partition coefficient of INM, which is related to the inherent hydrophobicity of local anesthetics.11
Deep eutectic solvents (DES) mix hydrogen-bonding acceptors and hydrogen-bonding donors at specific eutectic molar ratios, often leading to a significant decrease in the freezing/melting points.12 The deep eutectic phenomenon was initially discovered in 2003 with a mixture of choline chloride and urea in a 1:2 ratio, exhibiting a notably low melting point compared to the individual components.13 The melting points of choline chloride and urea were 575 and 406 K, respectively, whereas the eutectic mixture melted at 285 K.14 The melting point of S-ibuprofen (Tm = 329 K) decreased to 293 K by the presence of LDC.15 In addition, the phase diagrams of IBP and LDC showed that the mixture was peritectic at two-phase transition temperatures (293 and 310 K), suggesting the presence of a nonuniform intermediate state and the formation of a unique eutectic mixture.15 The mixed solution of IBP and LDC separates into an insoluble phase, behaving as a DES, potentially affecting the solubility of IBP and LDC differently under certain conditions.16 We attempted to apply principles similar to those observed with IBP and LDC to S-ketoprofen (KTP) or S-naproxen (NPX), another arylpropionic acid compound, expecting similar behavior owing to its shared characteristics. We confirmed the formation of a eutectic mixture when KTP was mixed with LDC by analyzing the time and temperature dependence of this process to understand the formation of an eutectic mixture better. Universalizing and reusing the concept of such phenomena will provide new insights into the formation mechanisms of DES.
KTP is a propionic acid compound classified as a non-steroidal anti-inflammatory drug known for its analgesic, anti-inflammatory, and antipyretic effects.17 KTP has analgesic and antipyretic properties and reduces prostaglandins by blocking the production of lipoxygenase and cyclooxygenase, which cause inflammation in the body.18 KTP exhibits low aqueous solubility and dissolution rate, resulting in inconsistent bioavailability.19 KTP has applications not only as an antipyretic and analgesic but also in treating nerve pain, such as sciatica and postherpetic neuralgia (PHN).20 KTP and LDC are individually used for PHN, but they exhibit different pharmacological effects; KTP demonstrates anti-inflammatory and analgesic effects, whereas LDC functions as a local anesthetic. Combining KTP and LDC is expected to yield a potent therapeutic impact against PHN by leveraging their distinct pharmacological actions.
2. Experimental section
2.1. Materials
KTP was purchased from Combi Blocks (San Diego, CA, USA) and LDC from Fujifilm Wako Pure Chemical Industries Ltd (Osaka, Japan).2.2. Dissolution of KTP in aqueous solution of LDC
An excess amount of KTP was added to 25 mM KH2PO4/Na2HPO4 buffer (PB) solution at pH 6.8 of LDC at various concentrations (0–10 mM). The KTP solutions were shaken at 298 K for 120 min, which reached equilibrium concentration. Their samples were filtered using a 0.22 mm polytetrafluoroethylene membrane filter. The concentration of KTP was determined using an SPD-20A high-performance liquid chromatography (HPLC) system (Shimadzu Co., Kyoto, Japan). The mobile phase mixture contained HPLC-grade methanol and PB at a volume ratio of 7:3, and the injection volume of each sample was 10 μL. Separation was conducted on an InertSustainSwift C18 column (5 μL, 150 × 4.6 mm; GL Sciences Inc., Tokyo, Japan) at a flow rate of 0.5 mL min−1 at 313 K, and the elution absorbance was measured at a wavelength of 256 nm. KTP solutions of known concentrations in the mobile phase mixture were measured to obtain standard peak areas. The mobile phase and washing flow, which were HPLC analytical grade, were passed through membrane filters.
2.3. Thermal analysis of KTP and LDC mixtures
DSC was performed using a DSC8230 instrument (Rigaku Co., Tokyo, Japan). The sample was mixed gently with a mortar and pestle at 283 K and sealed in an aluminum pan. The mixture was heated at a heating rate of 5.0 or 10.0 K min−1 and a nitrogen flow rate of 30 mL min−1. The Tm was adopted as the melting start temperature obtained from the intersection of the baseline extension and that of the point of maximum slope of the peak using Thermo Plus 2 software (Rigaku Co.).2.4. Analysis procedure using Gaussian function applied to DSC thermograms
Binary solid–liquid phase diagrams were created using the DSC thermograms to analyze the melting process. We attempted to determine the melting temperature derived from the eutectic mixture and the melting temperature derived from each drug. The thermogram of the mixture contained multiple overlapping peaks. One and two Gaussian functions were assigned to the endothermic peak due to the melting of the eutectic mixture, and the endothermic peak due to the melting of each drug, respectively, and a total of three Gaussian basis functions were linearly combined and fitted. The Gaussian function is given by | (1) |
The peak area of the Gaussian function is given by the formula below.
 | (2) |
The peak area of the Gaussian function was converted to the standard molar enthalpy of fusion (ΔfusH°) for a specific mass of each component. The standard molar melting entropy (ΔfusS°) was approximated using the quotient of ΔfusH divided by Tm, according to the classical definition of Clausius.
2.5. Kinetic analysis of amorphous formation between KTP and LDC
Fourier-transform infrared (FTIR) spectra were recorded in the wavenumber range of 4000–400 cm−1 at 310, 315, and 320 K using an FTIR spectrophotometer (PerkinElmer Co., Waltham, MA, USA) equipped with a temperature-controlled stage. Before the measurement, a handmade cell (radius 3.0 mm, depth 0.2 mm) was installed to hold the crystal in the measurement area. KTP was packed into cells, and LDC was sprinkled on top. FTIR spectra were obtained to investigate the temporal changes in the melting process at the crystal interface where KTP and LDC are in contact (n = 1).2.6. Multivariate analysis procedure applied to spectra generated by FTIR measurements
The observed i-th IR spectrum of the sample was represented as a m-dimensional vertical vector measured at the specific wavenumber. Since the wavenumber is measured over a range of 1800–1000 cm−1 with an interval of 1 cm−1, the value of m is 800 (except for 1653 cm−1). Matrix M is composed of a horizontal sequence of vectors from the first and i-th spectrum vectors, with an m × n rectangular matrix defined by eqn (1):
 | (3) |
Let M and Mt be real and transposed matrices, respectively. Their products MtM and MMt become orthogonal matrices, and the rows of Ψ and Λ are the left and right singular vectors, respectively. The matrices describing M can be transformed into eqn (2):
 | (4) |
The diagonal matrix Σ contains the diagonal elements {σi|1 ≤ i ≤ r} that have positive real values ordered in descending order. These elements represent singular values indicating dispersion. The i-th column of the orthogonal matrix Λ is the coefficient vector corresponding to the singular value σi and vector  is called a specific singular vector. The rows of matrix Ψ are denoted as basis function vectors. The principal component vector
  is the coefficient vector
  multiplied by the corresponding singular value σi.
 | (5) |
Matrix Ψ has rows that are the basis function vectors. In this study, we applied SVD to a matrix of 800 × 415 (wavenumber: 1800–1000 cm−1 except for 1653 cm−1) spectrum data. Matrix Ψ has rows that are the basis function vectors. From the diagram representing the logarithm of the singular value in descending order against the index corresponding to the document spectrum, we practically determined the dimensionality, that is, the minimum dimensionality of the basis functions required to reproduce the vector space of the document spectrum. This may be practically negligible, with a singular value less than several hundredths of the highest singular value of the first principal components, which are components with such too small singular values that contribute little to the reproduced spectrum. Owing to the dimensionality r decided under this criterion instead of the mathematical rank ρ, the yielded principal components approximately reproduce the vector space, including the documental spectrum, as the j-th feature vector  composed of the i-th elements xi,j:
 | (6) |
Principal component analysis (PCA)21,22 was performed on  extracted by SVD to perform axis rotation. The axis rotation of
  by PCA is PCi, and the axis rotation of the basis vector (Ψi) from the loadings results is the reproduction basis vector (Φi).
3. Results
3.1. Solubility behavior of KTP in the LDC solution
Fig. 1 shows the phase solubility diagram of KTP in the presence of LDC. The equilibrium concentration of KTP was shown to increase proportionally with increasing LDC concentration. According to the classification of Higuchi and Connors,21 the phase solubility diagrams of KTP with LDC were AL type. In the AL-type, the stoichiometry of the complex does not change, and a 1:1 complex is always formed.23 The stability constants of KTP/LDC were K1:1 = 0.49 M−1. This indicates that KTP forms a 1:1 soluble complex with LDC in solution.
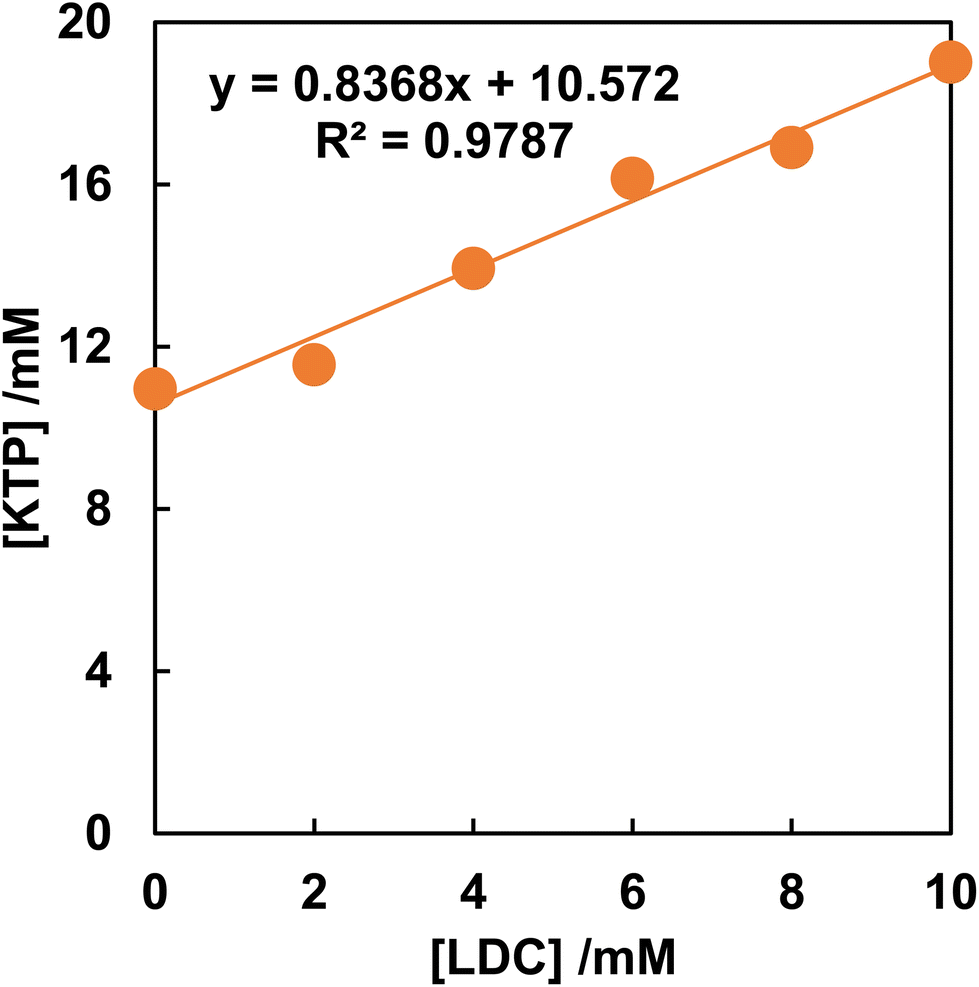 | ||
| Fig. 1 Phase solubility diagram of KTP in the presence of LDC. | ||
The equilibrium concentration of NPX increased in the presence of LDC, indicating the AL-type (Fig. S1†). The stability constants of NPX/LDC were K1:1 = 0.17 M−1.
3.2. At a heating rate of 10.0 K min−1, the KTP/LDC and NPX/LDC mixtures show an ideal eutectic reaction
The formation of eutectic mixtures results in melting point depression, which is why they are often used in drug design and delivery. To compare the behavior of the binary mixture of KTP and LDC with that of an ideal eutectic, the melting point of the mixture was investigated using DSC.
Fig. 2(a) shows the DSC thermograms of KTP/LDC mixtures at various ratios at a heating rate of 10.0 K min−1. The KTP and LDC monomers exhibited a sharp single endothermic peak (with Tm's of 349 K and 341 K, respectively). A broad peak with multiple overlapping endothermic peaks was observed in the thermogram of the mixture. The lowest Tm was 302 K for a 4:6 mixture of KTP/LDC.
 | ||
| Fig. 2 (a) DSC thermograms of KTP/LDC mixtures with various ratios at a heating rate of 10.0 K min−1 (n = 1). Black arrows show the melting points of neat LDC, neat KTP, and 6:4 mixtures. (b) Binary solid–liquid phase diagram of melting points of KTP/LDC system at a heating rate of 10.0 K min−1. The phase transition temperatures were calculated from the obtained Gaussians, orange circles (G1), yellow squares (G2), and gray triangles (G3), respectively. | ||
The broad peak is attributed to a drop in the melting point due to forming a eutectic mixture. For peak assignment and physical description, these curves were solved as a linear combination of three Gaussian basis functions using the solver program module in Microsoft Excel. Three independent peaks are observed in each KTP/LDC mixture thermogram. The left foot of each Gaussian curve (i.e., the peak temperature minus three times the variance) was defined as the phase transition temperature. This corresponds to a 99.5% confidence interval of the Gaussian function. The thermograms were linearly combined using three Gaussian functions. The binary solid–liquid phase diagram was created using the left leg of the Gaussians as the melting point.
Fig. 2(b) shows the binary solid–liquid phase diagram of KTP and LDC mixtures at a heating rate of 10.0 K min−1. The Tm determined from the Gaussian function was plotted against the mole fraction of KTP. KTP formed a eutectic mixture with LDC, with a KTP mole fraction of 0.4 and a eutectic point of 304 K.
An ideal eutectic mixture does not interact with the two components to form new compounds. At specific ratios, crystallization was inhibited, and the melting temperature was lower than that of the individual components. The Tm determined from the Gaussian function was plotted against the mole fraction of KTP, and the theoretical liquidus line in an ideal eutectic mixture was determined using the Schröder–Van Laar (SVL) equation:24
 | (7) |
The intersection of the liquidus lines determined by the SVL model for the KTP/LDC mixture was 304 K, and the KTP mole fraction was 0.39. The eutectic point obtained from the peak separation in the DSC thermogram was close to that of the SVL model (304 K), resulting from an ideal eutectic reaction.
The peak areas of the Gaussian function were converted to the total melting enthalpy (ΔfusH) for the mass of the content component through compensation with an instrumental coefficient. The total melting entropy (ΔfusS) for the mass of the component was simultaneously approximated by dividing the quotient of ΔfusH by Tm.
The entropy changes due to the melting of KTP and LDC (ΔfusSKTP, ΔfusSLDC) and the entropy changes due to the formation of a eutectic mixture (ΔfusSeutec) are shown in Fig. 3. These values were determined based on the assumption that the eutectic mixture consisted of KTP and LDC at a molar ratio 4:6 (Fig. 3). When the LDC and KTP were 100%, the melting entropy was 32.1 and 51.0 J K−1 mol−1. The melting entropy of the eutectic mixture (KTP + LDC) was a constant value of approximately 18.0 J K−1 mol−1.
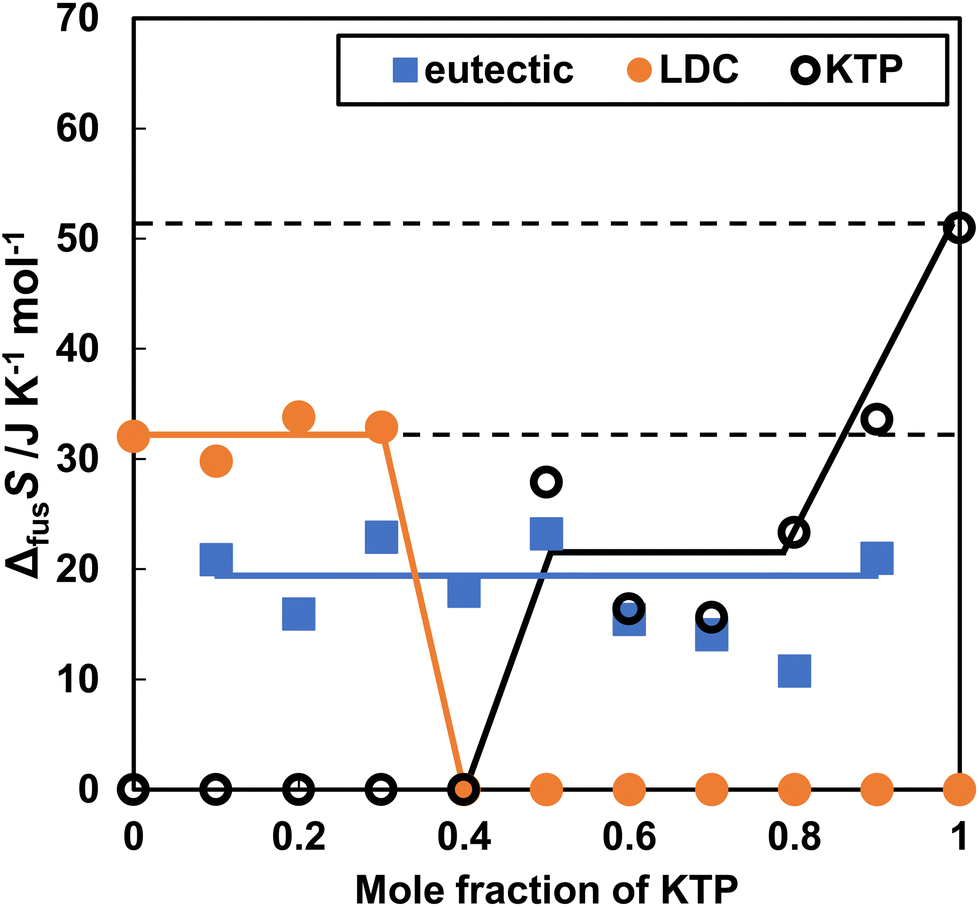 | ||
| Fig. 3 Entropy of fusion in KTP and LDC upon heating of the KTP/LDC mixtures. ΔfusSLDC, ΔfusSKTP, and ΔfusSeutec are shown by orange closed circles, black open circles, and blue closed squares. | ||
For NPX, the Tm of monomers was 430 K, and the lowest Tm was 303 K for a 6:4 mixture of NPX/LDC, as shown in Fig. S2(a).† Fig. S2(b)† shows the binary solid–liquid equilibrium phase diagram for the NPX/LDC mixture. NPX formed a eutectic mixture with LDC with an NPX mole fraction of 0.4 and a eutectic point of 305 K. A similar analysis was performed for NPX/LDC mixtures (Fig. S3†). The melting entropy of NPX was 56.1 J K−1 mol−1. The melting entropy of the eutectic mixture (NPX + LDC) was a constant value of approximately 24.5 J K−1 mol−1.
ΔfusSKTP, ΔfusSNPX, and ΔfusSLDC were calculated by subtracting the mole fraction consumed eutectic. The solid phase in the non-eutectic portion remained as drug-specific crystals. Therefore, it should remain constant, even for mixed samples. ΔfusSLDC was invariable at 30 J K−1 mol−1. However, ΔfusSKTP or ΔfusSNPX decreased as the KTP or NPX mole fraction decreased. This difference depends on the asymmetry of the action, in which the effect of LDC on melting KTP or NPX is greater than that of KTP or NPX.
3.3. At a heating rate of 5.0 K min−1, a eutectic point indicating a preliminary melting stage was observed at 294 K in KTP/LDC mixtures
Using thermograms obtained at lower heating rates, we created a binary phase diagram and attempted to separate the melting processes of the eutectic mixtures. Fig. 4(a) shows the DSC thermograms of the KTP/LDC mixtures with various mole fractions. The thermograms were obtained at a heating rate of 5.0 K min−1. The Tm of KTP and LDC monomers were 348 K and 342 K, respectively.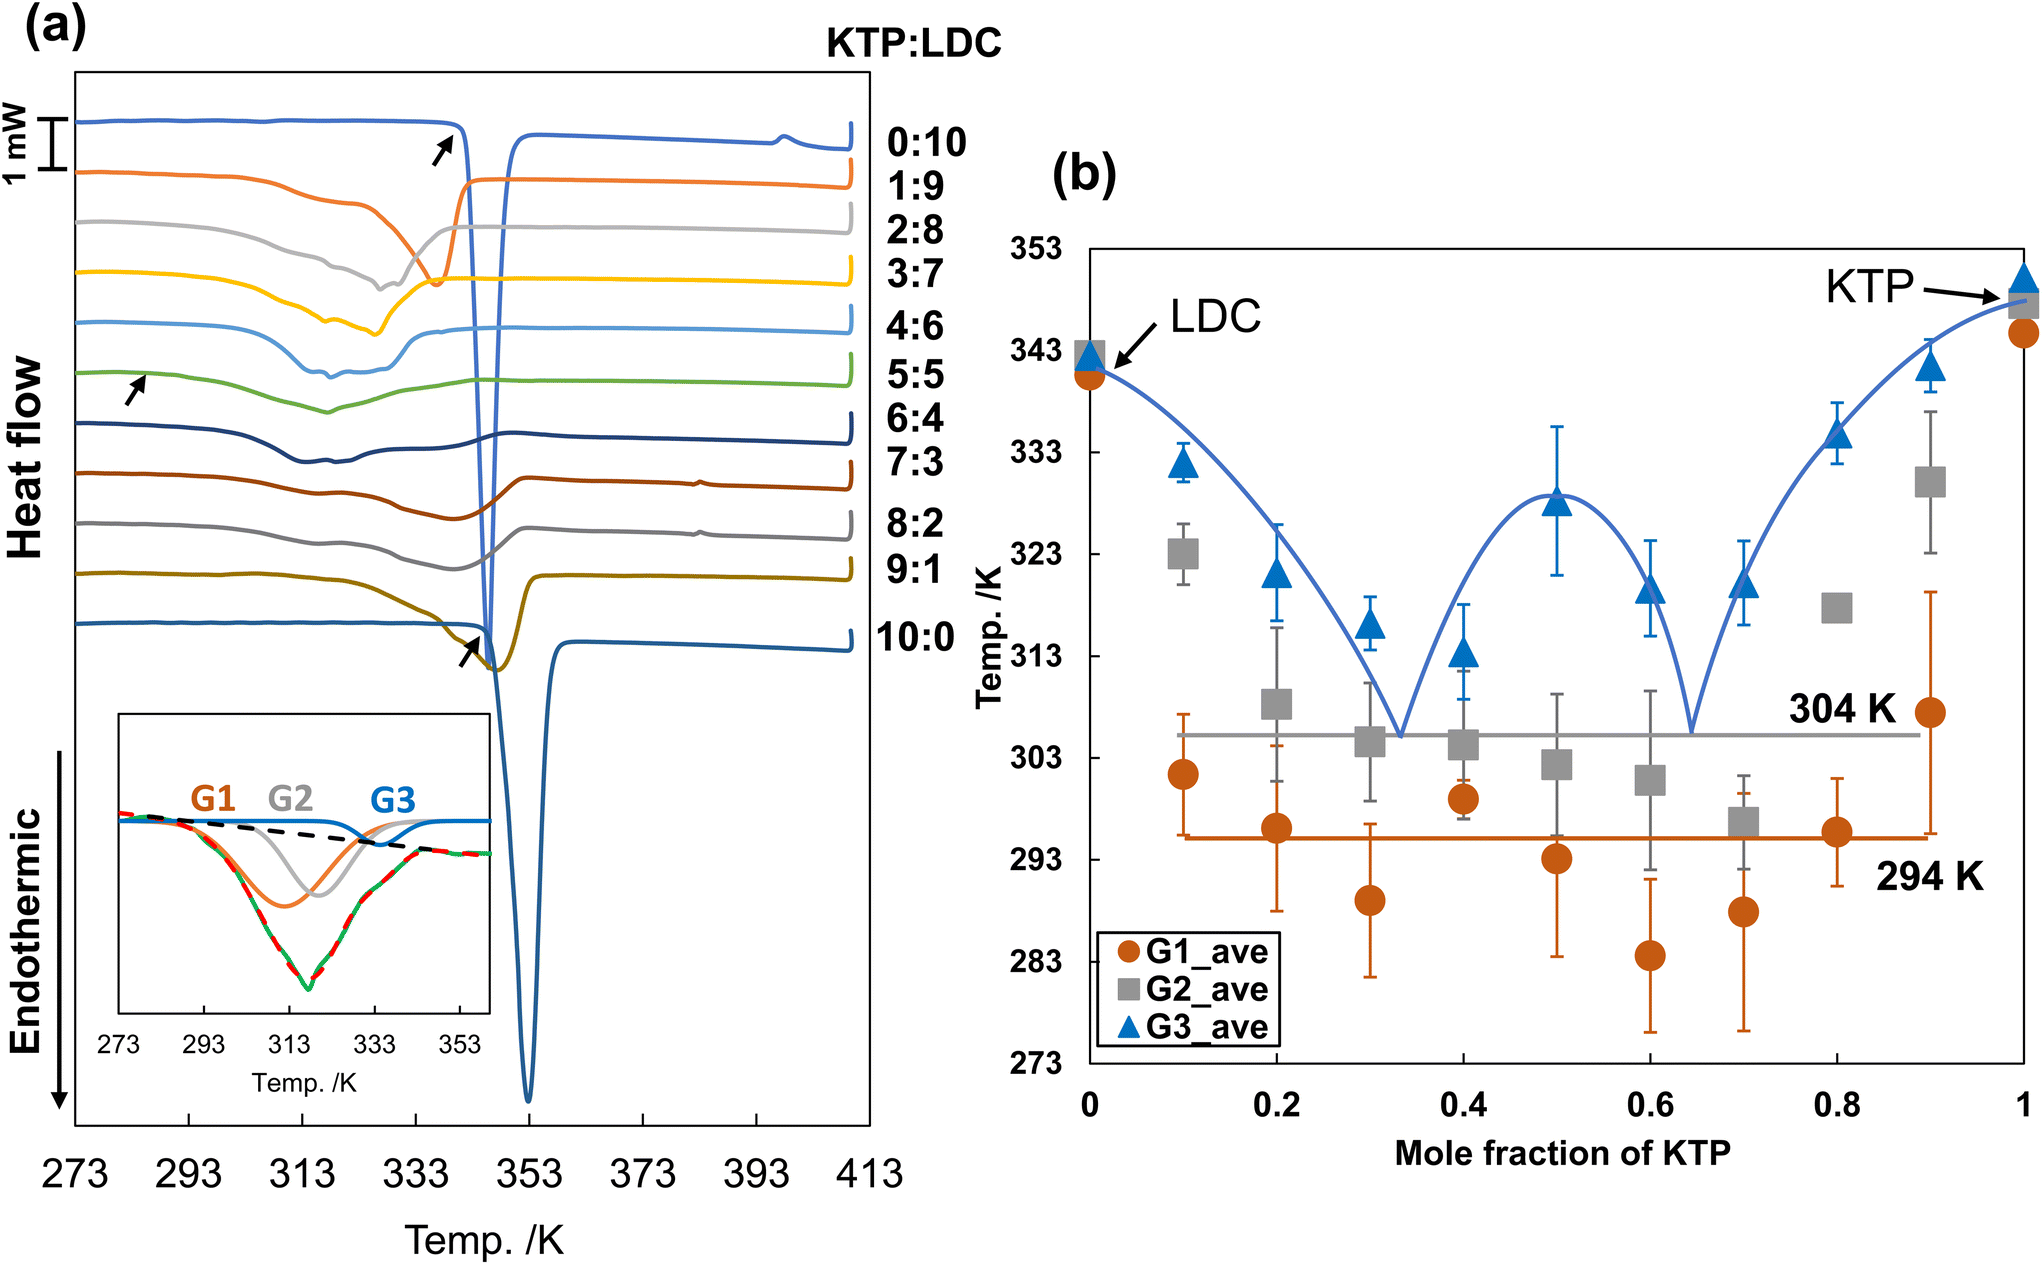 | ||
| Fig. 4 (a) DSC thermograms of KTP/LDC mixtures with various ratios at a heating rate of 5.0 K min−1 (n = 3). Black arrows show the melting points of neat LDC, neat KTP, and 5:5 mixture. (b) Binary solid–liquid phase diagram of melting points of KTP/LDC system at a heating rate of 5.0 K min−1. Each plot is the average of values obtained from three experiments. | ||
The binary phase diagram is obtained by plotting the phase transition temperature against the mole fraction, as shown in Fig. 4(b). The lowest phase transition temperature of the mixtures was approximately 294 K, except for the mixtures with extreme mole fractions (KTP:LDC = 1:9, 9:1). Substantial proton transfer typically occurs in aqueous solutions when the pKa difference is more significant than 3.25,26 KTP (pKa 3.98) acts as Brønsted acids, and LDC (pKa 8.01) acts as a Brønsted base. This result suggests the formation of deep eutectic liquid co-crystals through solid hydrogen-bondings or interactions between partially ionized species. The subsequent phase transition temperatures varied around 304 K, and a horizontal line was tentatively drawn at this temperature. Melting at 294 and 304 K was not observed for neat KTP or LDC, indicating two-step melting caused by the interaction and nanostructure of both substances after mixing.
The curve formed by the highest phase transition temperature (liquidus) touches the 304 K line at two points corresponding to KTP mole fractions of 1/3 and 2/3.
Further melting point depression due to hydrogen-bonding interactions between KTP and LDC may be observed at a constant melting point of 294 K (lower than the melting temperature of 304 K observed in the eutectic reaction). In addition, a maximum was observed at a KTP mole fraction of 1/2 in the binary solid–liquid phase diagram. When KTP and LDC act as Brønsted acid and Brønsted base, respectively, they form an ion pair in a 1:1 stoichiometric ratio. This strong ionic interaction may be attributed to the behavior of the molecular compounds.
Fig. S4† shows time-lapse observations using a polarizing microscope after the KTP and LDC crystals were brought into contact at room temperature. A complete glass transition occurred 72 hours after the two crystals were brought into contact. After 2.5 hours, the crystals were surrounded by a liquid phase. This is considered a preliminary melting state, as suggested by the solid–liquid phase diagram obtained by DSC.
The DSC results for a 1:1 mixture of KTP/LDC are shown immediately after mixing the samples and left to stand for a certain period. A glass transition temperature of 258 K was observed over time (Fig. S5†). Also, the endothermic peak in the eutectic mixture decreased. A small exothermic peak at approximately 282 K indicated LDC crystallization. In the 2nd heating sample, a phase transition temperature of 255 K was observed, and no endothermic peak was observed in the eutectic mixture. Since the glass transition temperature is sufficiently lower than room temperature, the glass transition progresses at room temperature.
3.4. Time evolution of FTIR spectra due to melting of KTP and LDC crystals
In the previous section, we described the melting of the KTP/LDC mixture at 294 K. The endothermic process occurring between 294 and 304 K involved two steps. First, the contact between the LDC and KTP crystallites induces the melting of LDC, and then the molten LDC phase starts to melt the remaining KTP crystals.We determined the phase transition temperatures for various mole fractions from the DSC measurements. However, because DSC measurements involve temperature modulation, it is impossible to comment on the reaction rates of the eutectic mixtures. To investigate not only the melting rate from the contact interface of the KTP/LDC crystals but also the potential amorphization through preliminary melting, we conducted time-dependent IR spectroscopy measurements at temperatures of 310, 315, and 320 K for mixed samples of KTP:LDC in mole fractions of 1:3, 2:1, 1:1, 2:1, and 3:1 (n = 1). The samples’ absorbance before melting was not observed (Fig. S6†). As the samples melted, the absorbance increased and eventually saturated at a constant absorbance. The time-dependent spectral changes in the mixed samples were highly complex because multiple factors continuously evolved.
Chemometric techniques are helpful in analyzing complex overlapping peaks and wavenumber shifts in spectral data. The spectral data were considered to be a multidimensional matrix dataset. Multivariate analysis reduces the dimensionality based on variables in the spectral dataset. The extracted spectra were used to evaluate the molecular interactions.27,28 Singular value decomposition (SVD) is an approach to analyze the resulting data quantitatively. This makes it possible to extract the characteristic changes.22 In our previous work, the effects of phase transformations on INM, cimetidine (CIM), and their 1:1 eutectic mixtures were investigated using FTIR spectroscopy and multivariate analysis.29 By applying the UV spectrum of the reaction solution to SVD, we monitored the photodecomposition of KTP by ultraviolet irradiation in real-time.30 We also recently reported using mathematical models and linear algebra on XRPD measurement to understand the drug complexes’ crystalline structures and interconversion pathways with β-cyclodextrin (β-CD).31
In this study, we investigated the mechanism of eutectic mixture formation in KTP/LDC by tracking the changes over time using SVD. SVD was performed on the spectral data in the 1800–1000 cm−1 range obtained from these measurements.
Fig. 4–6 show the SVD analysis results. The singular value (σ) indicates the magnitude of the contribution of each component (Fig. 5). It also shows the cumulative contribution rate for all the data, particularly up to the fifth component, with the most significant value. The cumulative contribution rates were 81.0% for the 1st component, 83.2% for the 2nd component, 84.5% for the 3rd component, 85.5% for the 4th component, and 87.0% for the 5th component. The gap between the 5th and 6th σ plots is separated from the adjacent plot of the previous component, which led to the selection of 1st to 5th components (ρ = 5). The measured spectrum can almost be reproduced by adding these spectra of up to 5th components with large singular values σi representing the size of the basis vector ψi that compose component i.
 | ||
| Fig. 5 Singular values (σ) and cumulative contribution ratio obtained by SVD analysis of IR spectra. | ||
 | ||
| Fig. 6 Reproduction basis vector (Φ) showing the spectral change of each component; Φ1 (a), Φ2 (b), Φ3 (c), Φ4 (d), and Φ5 (e). Summarized scheme of the obtained components by the SVD analysis (f). | ||
The reproductive basis vector (Φ) showing the spectral elements that make up the IR spectrum of each drug is shown in Fig. 6(a)–(e). Assigning the respective reproduction basis vectors was performed using neat KTP, neat LDC measured at 298 K, molten KTP, and molten LDC measured at 353 K (Fig. S7 and S8†).
The IR spectrum of neat KTP showed an extended C![[double bond, length as m-dash]](https://www.rsc.org/images/entities/char_e001.gif) O peak at 1727 cm−1 and a carboxylic acid band with a shoulder at 1687 cm−1, while the ketone CO was revealed at 1653 cm−1. Aromatic CC stretches were evident at 1597, 1582, and 1455 cm−1. C–H deformation of CH3 was observed at 1370 cm−1.32–34
O peak at 1727 cm−1 and a carboxylic acid band with a shoulder at 1687 cm−1, while the ketone CO was revealed at 1653 cm−1. Aromatic CC stretches were evident at 1597, 1582, and 1455 cm−1. C–H deformation of CH3 was observed at 1370 cm−1.32–34
In contrast, in molten KTP, the carboxylic acid bands (1727 and 1687 cm−1) of neat KTP are red-shifted to 1739 and 1704 cm−1, respectively, due to the cancellation of intermolecular interactions in the hydrogen-bonded dimer of KTP. A similar redshift was also reported for the carbonyl peak, contributing to the hydrogen-bonded dimer of IBP.35
In the neat FTIR spectrum of LDC, the N–H bend of the secondary amide group was observed at 1490 cm−1. The amide carbonyl stretching vibration was recorded as a sharp absorption band at 1662 cm−1. Aromatic CC was found at 1594 cm−1. The C–N absorption band is observed at 1166 cm−1.32,33,36 In molten LDC, the amide carbonyl CO stretch (1662 cm−1) of neat LDC was red-shifted to 1686 cm−1.
Φ 1 showed the average amount of change observed in all spectra. Bands at 1656, 1596, 1577, 1318, and 1280 cm−1 derived from molten KTP were observed, but a peak at 1390–1370 cm−1 and a shoulder at 1690 cm−1 derived from molten LDC were observed. Assigning this to a spectrum that indicates a specific state is difficult.
For Φ2, the positive basis vector was assigned to the spectrum of molten KTP. In contrast, on the negative side, bands derived from molten LDC were seen at 1497, 1425, and 1370 cm−1. In addition, Φ4 reflected a spectral change that reversed the positive/negative of Φ2. From this result, it can be concluded that the principal component vectors PC2 and PC4 indicate the amount of change in the spectra of Φ2 and Φ4 at each time, depending on the preliminary melting step in which LDC is melted and KTP is dissolved into molten LDC. Conceivable, positive changes in Φ3 indicated neat LDC and molten LDC, and Φ5 was assigned to neat KTP. Fig. 6(f) shows a scheme summarizing the components obtained by SVD analysis by assigning basis vectors.
3.5. The preliminary melting step was compatible with the successive reaction equation derived from the intermediates
This section describes the kinetic analysis of the components successfully extracted in the preliminary melting step. If a reaction occurs via a preliminary melting step, it can be considered a successive reaction. In the preliminary melting step, the state in which molten LDC wraps around KTP is defined as “peritectic.”The melting behavior can be described as a successive reaction when passing through the peritectic phase as an intermediate in the melting process.
 | (8) |
For melting behavior showing supersaturation according to eqn (8), the experimental data were fitted to eqn (9).
 | (9) |
Since Φ2 and Φ4 were assigned as vectors with the positive and negative sides reversed, kinetic analysis was performed on −(PC2–PC4). k1 and k2 were determined by an optimization calculation using eqn (8) and the least-squares method for the values of −(PC2–PC4). Fig. 7 shows the temporal change in −(PC2–PC4) at various KTP/LDC molar ratios. The optimized X0, k1, k2, and root-mean-square (RMS) values, which indicate the fitting accuracy, are listed in Table S1.† Because both showed high fitting accuracy, we could extract the peritectic phenomenon using multivariate analysis.
 | ||
| Fig. 7 Principal component vector (PC) showing the magnitude of spectral change at various temperatures; 310 K (blue circles), 315 K (gray squares) and 320 K (orange diamonds). The components assigned to the peritectic phenomenon were plotted and fitted using a sequential reaction equation. | ||
3.6. Activation energy of the preliminary melting process
The activation energy was determined to determine whether the progress of the peritectic melting process differed for various KTP:LDC molar ratios.
The activation energies at k1 and k2 were calculated from the Arrhenius equation:
 | (10) |
The activation energy was determined from the slope of the approximately straight line of the Arrhenius plot with logk on the vertical axis and 1000/T on the horizontal axis (Fig. S9†). Fig. 8 shows the activation energy as a function of the KTP mole fraction.
 | ||
| Fig. 8 Activation energy, Ea1 (blue close circles), and Ea2 (yellow open triangles) at various mole fraction of KTP and LDC. | ||
E
a1 and Ea2 are the activation energies of the process of forming a peritectic state and the process of forming an amorphous state, respectively. Ea1 reached a maximum value when the KTP:LDC ratio was 1:1. Ea2 decreased as the molar ratio of KTP decreased. Ea1 and Ea2 are the activation energies of the process of forming a peritectic state and the process of creating an amorphous state, respectively. Ea1 reached its maximum value when KTP:LDC = 1:1 and decreased as the molar ratio increased. This tendency depends on the degree of melting of the LDC and is similar to the fact that the binary solid–liquid phase diagram has a minimum point at 1:2 and 2:1. As the KTP molar ratio decreased, Ea2 increased.
4. Discussion
In Sections 3.3 and 3.4, DSC measurements with different heating rates of 10.0 K min−1 and 5.0 K min−1 were performed (Fig. 2a and 4a). The solid–liquid phase diagrams were created from the Tm obtained by fitting the thermogram with Gaussian functions (Fig. 2b and 4b). Different heating rates caused two differences in the binary solid–liquid phase diagram. (i) At 10.0 K min−1, there was only the ideal eutectic point (304 K), and at 5.0 K min−1, there were two points, 294 K and 304 K. (ii) The minimum point of the liquidus line was at a mole fraction of 1/3 at 10.0 K min−1, and 1/3 and 2/3 at 5.0 K min−1.Since KTP (pKa 3.98) and NPX (pKa 4.18) act as Brønsted acids, and LDC (pKa 8.01) acts as a Brønsted base, hydrogen-bonding interactions caused by proton transfer are expected to form a more complex system. DSC is measured by heating the material from low to high temperatures. At low heating rates, multiple peaks were observed, whereas at extremely high heating rates, a single peak was observed in the thermogram of isotactic polystyrene.37 The peak temperature of the endotherm was highly dependent on the heating rate. This may have been caused by the heating rate exceeding the melting or crystallization rates. In this study, since the heating rate at 10.0 K min−1 was fast for the time it takes for the crystal to melt and its responsiveness to temperature, the information based on interactions that would indicate DES (the preliminary melting step at 294 K) could not be extracted as a linear combination of Gaussian functions. On the other hand, it is reasonable that a preliminary melting stage could be observed in the analysis of thermograms measured at a slow heating rate of 5.0 K min−1 and in the study of FTIR spectra measured under annealing conditions.
At a KTP mole fraction of 1/3, a minimum point originating from the eutectic reaction was observed, even at 10.0 K min−1 and 5.0 K min−1. This minimum point at 1/3 coincided with the eutectic point resulting from the eutectic ideal response given by the SVL equation. In contrast, a new minimum point in the KTP ratio 2/3 was also observed (Fig. 4b). Fiandaca et al. showed that the transfer of the carboxylic acid proton of naproxen to LDC promoted hydrogen-bonding between naproxen, which has an electron-deficient carbonyl oxygen, and another molecular form of naproxen.38 As a result, a minimum point was seen at 2/3 in the binary solid–liquid phase diagram for the mixture of naproxen and LDC. It is believed that such an interaction occurred even when the KTP ratio was 2/3. The KTP mole fractions of 1/3 and 2/3 indicate that the cooperation of the KTP and LDC molecules accelerated melting. In Fig. 7, at any ratio, LDC melts first, then KTP is melted into the molten LDC. The molten LDC envelops and melts the KTP, achieving an “island in the sea” arrangement (Fig. S4†).
Macheras and Iliadis et al.39 modeled the random release of particles from a fractal polymer matrix by percolation clusters at critical points in the pharmaceutical field. In site percolation theory, the threshold that affects the propagation by the mixing ratio of two components of equally sized spheres is called the critical probability (Pc). For example, for a simple cubic lattice, Pc is 0.312,40 and above this ratio both materials are interpreted as continuous phases. Fig. S10† shows SEM images of KTP and LDC. The ground KTP was maximum or minimum size approximated by projected area diameter: 0.151 and 0.586 mm, respectively. The ground LDC was maximum or minimum size: 2.28 and 0.397 mm, respectively. Although some variation in particle size was observed, the interpretation based on the percolation model was a sufficiently acceptable result.
Cerajewski et al.41 reported that the macroscopic DES properties of mixtures of 1-ethyl-3-methylimidazolium chloride [EMIm][Cl] and urea were dominated by nanoscale interfaces. In the urea:[EMIm][Cl] = 25:75 sample, the hydrogen-bonding between the Cl anion and urea takes precedence, resulting in the formation of an excess cationic phase of [EMIm], and urea behaves as a homogeneous dispersed phase. In urea:[EMIm][Cl] = 72.5:27.5, the imidazolium cations cause phase separation owing to the lack of chlorine anions. In contrast, when urea:[EMIm][Cl] = 50:50, a network was formed in which imidazolium and urea invaded each other and were separated on the nanoscale. This can be considered reasonable from an interpretation based on percolation theory. In addition, in the case of urea:[EMIm][Cl] = 50:50, imidazolium and urea were crosslinked in the right amount via chlorine cations, forming a strong hydrogen-bonding network and increasing the melting point.
Kataoka et al.15 proposed different scenarios for melting IBP (Tm = 325 K) and LDC (Tm = 341 K) mixtures depending on their proportions. When the amount of IBP was more significant than that of LDC, the molten IBP surrounded the isolated crystalline LDC, and further melting of the LDC proceeded with zero-order kinetics. When the amount of IBP was less than that of LDC, the molten IBP accelerated in the matrix on the LDC solid and penetrated the solid to form a liquid network. A reaction rate of negative 1/2 order was obtained for melting. Three regimes with apparent reaction orders of 0, 1/2, and −1/2 were observed at different molar ratios and interpreted in site percolation theory.
Different melting scenarios depending on the KTP and LDC mole fraction were proposed from the activation energy results obtained by kinetic analysis based on FTIR spectra. When KTP ≫ LDC, the LDC surrounded by KTP melts excess KTP from the interface in a chain reaction. In contrast, when KTP ≪ LDC, KTP is in the state of an “island” floating in the “sea” of molten LDC, and KTP becomes fine particles and has a high surface energy. This fine particle state is observed as a peritectic phenomenon; as a result, Ea2 increases in the LDC-rich state.
5. Conclusion
An attempt was made to analyze the melting point depression and formation of KTP and LDC eutectic mixtures. In the binary solid–liquid phase diagram, at a heating rate of 5.0 K min−1, the constant melting point was lower than the ideal eutectic point. Melting of both crystals at room temperature was observed using a polarizing microscope. This abnormal drop in melting point can be understood from the fact that the pKa difference between KTP and LDC is more than 3, which facilitates proton transfer and indicates the properties of the DES. The entropy of fusion (ΔfusSeutec) of the eutectic mixture is approximately 20.0 J K−1 mol−1, which is less than ΔfusSLDC (32.0 J K−1 mol−1) and ΔfusSKTP (51.0 J K−1 mol−1). It is thermodynamically advantageous to form eutectic mixtures. Furthermore, ΔfusSLDC showed approximately constant values at various mixing ratios, whereas ΔfusSKTP decreased as the molar ratio of KTP decreased. The time course of melting from the contact surface of the KTP and LDC crystals was obtained by IR spectroscopy and analyzed by SVD. A preliminary melting step was assigned to the basis vector. The molten LDC signal first increased, followed by a change in the molten KTP signal. Therefore, LDC is believed to melt and dissolve the drug by converting it into fine particles. The difference in activation energy depending on the molar ratio was interpreted by the “island in the sea” model and revealed the contribution of percolation to the melting mechanism of eutectic mixtures.Abbreviations
| KTP | S-Ketoprofen |
| LDC | Lidocaine |
| DSC | Differential scanning calorimetry |
| FTIR | Fourier-transform infrared spectroscopy |
| SVD | Singular value decomposition |
| APIs | Active pharmaceutical ingredients |
| T m | Melting point |
| INM | Indomethacin |
| PRO | Procaine |
| TET | Tetracaine |
| DIB | Dibucaine |
| DES | Deep eutectic solvents |
| PHN | Postherpetic neuralgia |
| HPLC | High-performance liquid chromatography |
| SVL equation | Schröder–Van Laar equation |
Author contributions
Kanji Hasegawa: investigation, visualization, writing – original draft. Sara Ogawa: investigation for Section 3.2. Hikaru Kataoka: review, and editing. Hitoshi Chatani: review and editing. Tomohiro Tsuchida: review and editing. Satoru Goto: supervision.Conflicts of interest
There are no conflicts to declare.References
- P. Augustijns and M. E. Brewster, Solvent Systems and Their Selection in Pharmaceutics and Biopharmaceutics, Springer, 2007, vol. 190, pp. 1–27, 221–256 Search PubMed.
- S. Kalepu and V. Nekkanti, Acta Pharm. Sin. B, 2015, 5, 442–453 CrossRef PubMed.
- F. Al-Akayleh, H. H. M. Ali, M. M. Ghareeb and M. Al-Remawi, J. Drug Delivery Sci. Technol., 2019, 53, 101159 CrossRef CAS.
- M. A. R. Martins, L. P. Silva, P. S. Jorge, D. O. Abranches, S. P. Pinho and J. A. P. Coutinho, Eur. J. Pharm. Sci., 2020, 156, 105583 CrossRef PubMed.
- A. P. S. Raman, P. Jain, A. Kumar, P. Singh, K. Kumari, I. Bahadur, F. Mohammad and N. K. Kaushik, ChemistrySelect, 2023, 8, e202300824 CrossRef.
- W. Qu, I. B. Qader and A. P. Abbott, Drug Delivery Transl. Res., 2022, 12, 1187–1194 CrossRef CAS PubMed.
- M. M. Buckley and P. Benfield, Drugs, 1993, 46(1), 126–151 CrossRef CAS PubMed.
- H. A. Bryan and T. S. Alster, Dermatol. Surg., 2002, 28, 999–1003 Search PubMed.
- Y. Shimada, S. Goto, H. Uchiro, H. Hirabayashi, K. Yamaguchi, K. Hirota and H. Terada, Colloids Surf., B, 2013, 102, 590–596 CrossRef CAS PubMed.
- Y. Shimada, R. Tateuchi, H. Chatani and S. Goto, J. Mol. Struct., 2018, 155, 165–170 CrossRef.
- R. Tateuchi, N. Sagawa, Y. Shimada and S. Goto, J. Phys. Chem. B, 2015, 119, 9868–9873 CrossRef CAS PubMed.
- M. Saha, Md S. Rahman, Md N. Hossain, D. E. Raynie and M. A. Halim, J. Phys. Chem. A, 2020, 124, 4690–4699 CrossRef CAS PubMed.
- A. P. Abbott, D. Boothby, G. Capper, D. L. Davies and R. K. Rasheed, J. Am. Chem. Soc., 2004, 126(29), 9142–9147 CrossRef CAS PubMed.
- S. B. Vepuri, S. Anbazhagan, D. Divya and D. Padmini, Indones. J. Pharm., 2013, 24, 131–150 Search PubMed.
- H. Kataoka, Y. Sakaki, K. Komatsu, Y. Shimada and S. Goto, J. Pharm. Sci., 2017, 106, 3016–3021 CrossRef CAS PubMed.
- H. Chatani, S. Goto, H. Kataoka, M. Fujita, Y. Otsuka, Y. Shimada and H. Terada, Chem. Phys., 2019, 525, 110415 CrossRef CAS.
- T. G. Kantor, Pharmacotherapy, 1986, 6(3), 93–102 CrossRef CAS PubMed.
- J. Kuczynska and B. Nieradko-Iwanickaet, Biomed. Pharmacother., 2021, 139, 111608 CrossRef CAS PubMed.
- H. A. Abou-Taleb, M. E. Shoman, T. S. Makram, J. A. Abdel-Aleem and H. Abdelkader, Pharmaceutics, 2023, 15, 713 CrossRef CAS PubMed.
- S. Yoon, S. Kim, S. Park, E. Hong, J. Kim, S. Kim, T. H. Yoo and Y. Ryu, J. Mol. Catal. B: Enzym., 2014, 100, 25–31 CrossRef CAS.
- S. Wold, K. Esbensen and P. Geladi, Chemom. Intell. Lab. Syst., 1987, 2, 37–52 CrossRef CAS.
- E. R. Henry and J. Hofrichter, Singular Value Decomposition: Application to Analysis of Experimental Data, Methods in Enzymology, Academic Press, Inc., 1992, vol. 210, pp. 129–139 Search PubMed.
- T. Higuchi and K. A. Connors, Adv. Anal. Chem. Instrum., 1965, 4, 117–212 CAS.
- K. Lbmann, R. Laitinen, H. Grohganz, K. C. Gordon, C. Strachan and T. Rades, Mol. Pharm., 2011, 8, 1919–1928 CrossRef PubMed.
- K. Bica, J. Shamshina, W. L. Hough, D. R. MacFarlane and R. D. Rogers, Chem. Commun., 2011, 47, 2267–2269 RSC.
- J. Stoimenovski, E. I. Izgorodina and D. R. MacFarlane, Phys. Chem. Chem. Phys., 2010, 12, 10341–10347 RSC.
- N. Kumar, A. Bansal, G. S. Sarma and R. K. Rawal, Talanta, 2014, 123, 186–199 CrossRef CAS PubMed.
- M. D. Peris-Díaz and A. Krezel, TrAC, Trends Anal. Chem., 2021, 135, 116157 CrossRef.
- Y. Otsuka, W. Kuwashima, Y. Tanaka, Y. Yamaki, Y. Shimada and S. Goto, J. Pharm. Sci., 2021, 110, 1142–1147 CrossRef CAS PubMed.
- R. Hiroshige, S. Goto, C. Tsunoda, R. Ichii, S. Shimizu, Y. Otsuka, K. Makino, H. Takahashi and H. Yokoyama, J. Inclusion Phenom. Macrocyclic Chem., 2022, 102, 791–800 CrossRef CAS.
- K. Hasegawa, S. Goto, C. Tsunoda, C. Kuroda, Y. Okumura, R. Hiroshige, A. Wada-Hirai, S. Shimizu, H. Yokoyama and T. Tsuchida, Phys. Chem. Chem. Phys., 2023, 25, 29266 RSC.
- H. F. Marei, M. F. Arafa, E. A. Essa and G. M. El Maghraby, J. Drug Delivery Sci. Technol., 2021, 61, 102338 CrossRef CAS.
- A. Umerska, J. Zotova and L. Tajber, Int. J. Pharm., 2021, 607, 120969 CrossRef CAS PubMed.
- K. Florey, Analytical Profiles of Drug Substances, Academic Press, 1981, vol. 10, pp. 443–471 Search PubMed.
- H. Wang, G. Gurau, J. Shamshina, O. A. Cojocaru, J. Janikowski, D. R. MacFarlane, J. H. Davis and R. D. Rogers, Chem. Sci., 2014, 5, 3449–3456 RSC.
- M. F. Powell, Analytical Profiles of Drug Substances, 1986, vol. 15, pp. 761–779 Search PubMed.
- C. Schick, Anal. Bioanal. Chem., 2009, 395, 1589–1611 CrossRef CAS PubMed.
- M. Fiandaca, G. Dalwadi, R. Wigent and P. Gupta, Int. J. Pharm., 2020, 575, 118946 CrossRef CAS PubMed.
- P. Macheras and A. Iliadis, Modeling in Biopharmaceutics, Pharmacokinetics, and Pharmacodynamics: Homogeneous and Heterogeneous Approaches, Interdisciplinary Applied Mathematics, Springer, New York, 2006, vol. 30, pp. 75–82 Search PubMed.
- M. B. Isichenko, Rev. Mod. Phys., 1992, 64(4), 961–1043 CrossRef.
- U. Cerajewski, J. Trager, S. Henkel, A. H. Roos, M. Brehm and D. Hinderberger, Phys. Chem. Chem. Phys., 2018, 20, 29591 RSC.
Footnote |
| † Electronic supplementary information (ESI) available. See DOI: https://doi.org/10.1039/d4pm00039k |
| This journal is © The Royal Society of Chemistry 2024 |