 Open Access Article
Size and temperature dependent shapes of copper nanocrystals using parallel tempering molecular dynamics†
Huaizhong
Zhang‡
a,
Mohd Ahmed
Khan‡
a,
Tianyu
Yan
a and
Kristen A.
Fichthorn
 *ab
*ab
aDepartment of Chemical Engineering, The Pennsylvania State University, University Park, Pennsylvania 16802, USA. E-mail: fichthorn@psu.edu
bDepartment of Physics, The Pennsylvania State University, University Park, Pennsylvania 16802, USA
First published on 18th March 2024
Abstract
We performed parallel-tempering molecular dynamics simulations to predict the temperature- and size-dependent equilibrium shapes of a series of Cu nanocrystals in the 100- to 200-atom size range. Our study indicates that temperature-dependent, solid–solid shape transitions occur frequently for Cu nanocrystals in this size range. Complementary calculations with electronic density functional theory indicate that vibrational entropy favors nanocrystals with a shape intermediate between a decahedron and an icosahedron. Overall, we find that entropy plays a significant role in determining the shapes Cu nanocrystals, so studies aimed at determining minimum-energy shapes may fail to correctly predict shapes observed at experimental temperatures. We also observe significant shape changes with nanocrystal size – sometimes with changes in a single atom. The information from this study could be useful in efforts to devise processing routes to achieve selective nanocrystal shapes.
Introduction
Metal nanocrystals are useful in a host of applications, ranging from catalysis1–4 to plasmonics1,5–7 to electronics8,9 to various personal and health applications,8,10 and many studies show there are optimal nanocrystal sizes and morphologies for these applications. In the interest of reliably synthesizing optimal nanocrystals, it is important to understand the shape trajectories nanocrystals follow as they grow. In a self-seeding synthesis, the small (likely single-nm) nanocrystal seeds that form after nucleation are fluxional and we expect them to assume an equilibrium shape distribution as they grow.11,12 As the nanocrystals grow larger, they may become locked into kinetic shapes.13–19 It is important to understand the thermodynamic-to-kinetic shape transition to design processing routes by which nanocrystals with specific sizes and shapes could be synthesized. The time scales over which shape transitions occur as nanocrystals grow are poorly understood at present and it is important to first understand the thermodynamics of nanocrystal shapes to make progress toward this goal.In this paper, we focus our attention on predicting the equilibrium shapes attained by Cu nanocrystals. Significant effort has been directed toward studying the shapes of small Cu nanocrystals, with 60 atoms or less, using various theoretical techniques.20–29 The minimum-energy shapes of larger Cu nanocrystals have been studied previously using semi-empirical force fields combined with global optimization techniques,30,31 or energy minimization of fixed shapes.32–34 In a recent study, a theoretical framework was proposed to combine global optimization, classical molecular dynamics, and unsupervised machine learning algorithms to characterize the shapes of Cu nanocrystals.35
In this work, we use Parallel Tempering Molecular Dynamics (PTMD) to probe the temperature-dependent, minimum free-energy shapes of Cu nanocrystals in the 100–200 atom size range. A few recent studies have used PTMD36–39 or variants39 to obtain temperature-dependent shape distributions of Au,36–38 Cu,38 and Ag38,39 nanocrystals. In PTMD simulations, parallel, canonical MD simulations are used to simulate a series of nanocrystal replicas whose temperatures span the lowest temperatures of interest to temperatures above melting. Replicas with neighboring temperatures are exchanged based on Monte Carlo (MC) trials that satisfy the detailed-balance criterion. Replicas at high temperatures can transition between various shapes on the MD time scale. Exchange of the high-temperature replicas with those at lower temperatures enables us to access shapes that would not be accessible in a single-temperature MD simulation.
In prior studies, Settem and colleagues used PTMD, in combination with the Harmonic Superposition Approximation (HSA), to probe the temperature-dependent structures of Cu nanocrystals containing 90, 147, and 201 atoms. Here, we present PTMD results for 22 distinct Cu nanocrystals in the 100–200 atom size range. As we will discuss below, the capabilities of PTMD applied to a relatively extensive collection of nanocrystal sizes reveals new insight into the temperature-dependent shape distributions of these small Cu nanoparticles and how these shape distributions evolve as the nanocrystal size changes.
Methods
We consider the temperature-dependent shapes of Cu nanocrystals containing between 100 and 200 atoms in vacuum. The nanocrystal sizes investigated were 100, 110–122 in single-atom increments, and 130–200 in ten-atom increments. Cu-atom interactions were described using an Embedded Atom Method (EAM) potential.40 The LAMMPS code41 was utilized for the MD simulations. Details of these simulations are given in the ESI, including in Fig. S1.† To compare results from the EAM potential to those from first principles, we performed DFT calculations using the Vienna Ab Initio Simulation Package (VASP).42–44 Details of these calculations are given in the ESI.† Calculations of the vibrational entropy were performed using the open-source Phonopy code45,46 used together with VASP.Common neighbor analysis
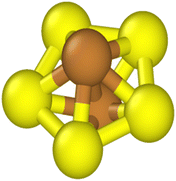
We used Common Neighbor Analysis (CNA) to classify the nanocrystal structures.47,48 In CNA, we first identify the bonds between an atom and its nearest neighbors. The nearest neighbors of a given atom are defined as those atoms within a cut-off distance of dcut. The number of bonds between an atom and its nearest neighbors, which is also the number of nearest neighbors, is the coordination number CN. For example, an atom in a perfect FCC bulk environment has 12 nearest neighbors, with CN = 12. We then identify the common neighbors shared by the two atoms in a bond.A set of three integers {i,j,k} is used to represent the common neighbors of each nearest-neighbor bond. Here, i denotes the number of shared nearest neighbors between a pair of atoms, j is the number of bonds connecting the i shared neighbors, and k is the number of bonds in the longest continuous chain that can be formed by the j bonds connecting the common neighbors. Fig. 1 shows a pair of nearest neighbors with five common neighbors (i = 5), five bonds between the common neighbors (j = 5), and five bonds in the longest continuous chain that can be formed by the five bonds connecting the five common neighbors (k = 5). Thus, the CNA index associated with this bond is {5,5,5}. An atom with CN = N will possess N sets of {i,j,k} and we denote this as the CNA signature.
If two atoms are in equivalent environments, they not only possess the same coordination number but also exhibit the same CNA signature. Atoms in different environments may also have the same coordination number. For example, an atom in a perfect FCC bulk environment with CN = 12 and a CNA signature of {4,2,1}(12) will possess the same coordination number as an atom in a perfect HCP bulk environment, only the atom in the HCP environment has a CNA signature of {4,2,1}(6) and {4,2,2}(6). A unique identity is assigned to an atom based on its CNA signature and a list of the CNA signatures assigned to each identity is given in Table 1.
| CNA Signature | C N | {i,j,k}(#) | {i,j,k}(#) | {i,j,k}(#) | {i,j,k}(#) | {i,j,k}(#) | {i,j,k}(#) |
|---|---|---|---|---|---|---|---|
| FCC bulk | 12 | {4,2,1}(12) | |||||
| FCC {100} surface | 8 | {4,2,1}(4) | {2,1,1}(4) | ||||
| FCC{111} surface | 9 | {4,2,1}(3) | {3,1,1}(6) | ||||
| FCC {111}–{100} edge | 7 | {4,2,1}(2) | {3,1,1}(2) | {2,1,1}(3) | |||
| FCC (111)–(111) edge | 7 | {4,2,1}(1) | {3,1,1}(4) | {2,0,0}(2) | |||
| TO vertex (corner) | 6 | {4,2,1}(1) | {3,1,1}(2) | {2,1,1}(2) | {2,0,0}(1) | ||
| HCP bulk | 12 | {4,2,1}(6) | {4,2,2}(6) | ||||
| Ih spine | 12 | {4,2,2}(10) | {5,5,5}(2) | ||||
| Ih surface edge | 8 | {4,2,2}(2) | {3,2,2}(2) | {3,1,1}(4) | |||
| Ih center | 12 | {5,5,5}(12) | |||||
| Ih/Dh surface vertex | 6 | {5,5,5}(1) | {3,2,2}(5) | ||||
| Ih/Dh notch vertex | 7 | {4,2,2}(1) | {3,2,2}(1) | {3,1,1}(2) | {3,0,0}(1) | {2,0,0}(2) | |
| Dh notch edge | 10 | {4,2,2}(2) | {4,2,1}(2) | {3,1,1}(4) | {3,0,0}(2) | ||
| Dh–Ih bulk 5-fold ring: 1 | 11 | {4,2,2}(3) | {4,2,1}(2) | {4,3,3}(1) | {3,1,1}(3) | {3,2,2}(1) | {2,0,0}(1) |
| Dh–Ih bulk 5-fold ring: 2 | 11 | {4,2,2}(4) | {4,2,1}(2) | {4,3,3}(1) | {3,1,1}(3) | {3,0,0}(1) | |
| Dh–Ih bulk 5-fold ring: 3 | 11 | {4,2,2}(4) | {4,1,1}(1) | {3,1,1}(3) | {3,0,0}(1) | {2,0,0}(2) | |
| Dh–Ih bulk 5-fold ring: 4 | 11 | {5,5,5}(1) | {4,2,2}(6) | {3,1,1}(2) | {3,2,2}(1) | {2,0,0}(1) | |
| Dh–Ih {111} surface | 9 | {4,1,1}(1) | {3,1,1}(8) | ||||
| Dh–Ih surface edge | 8 | {4,2,2}(1) | {3,2,2}(1) | {3,1,1}(5) | {2,0,0}(1) | ||
| Dh–Ih {111}–{100} edge | 7 | {4,3,3}(1) | {3,2,2}(2) | {3,1,1}(2) | {2,0,0}(2) | ||
| Dh–Ih surface vertex | 6 | {4,3,3}(1) | {3,2,2}(2) | {3,1,1}(2) | {2,0,0}(1) | ||
| Twisted Ih surface vertex | 6 | {4,2,2}(1) | {3,2,2}(1) | {3,1,1}(1) | {2,1,1}(1) | {2,0,0}(2) | |
| Twisted Ih surface edge vertex | 8 | {5,5,5}(1) | {4,2,2}(2) | {3,2,2}(3) | {2,0,0}(2) | ||
| Twisted Ih surface edge | 9 | {4,2,2}(2) | {4,2,1}(2) | {3,2,2}(2) | {3,1,1}(2) | {2,1,1}(1) |
We used bulk CNA signatures to classify nanocrystal shapes. In our classification system, a single crystal is purely FCC if it has no icosahedral (Ih) spine atoms, no Ih center, no HCP atoms, and an FCC bulk percentage of greater than 10%. We note that the designation of 10% FCC bulk is somewhat dictated by the small size of the nanocrystals in our study. A single crystal disrupted by HCP plane(s) is classified as a single crystal with stacking faults (SCSF) (no Ih spine, no Ih center, HCP atoms > 0%, and FCC + HCP bulk atoms >10%). Nanocrystals in possession of an Ih center are classified as Ih. A nanocrystal possessing Ih spine atoms, but no Ih center, as well as greater than 20% of FCC and HCP bulk atoms, is classified as a decahedron (Dh).
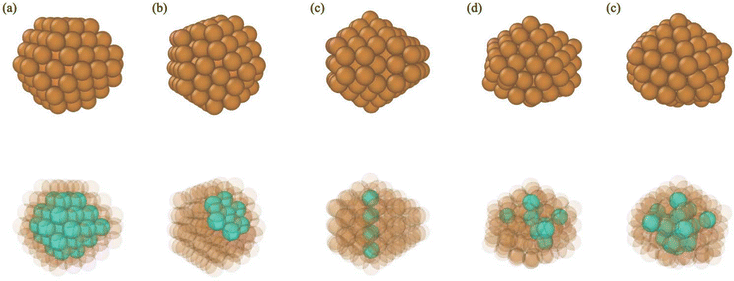
In our recent study of Ag nanocrystals,39 we added a category for particles with intermediate structures between Dh and Ih: Dh–Ih. We note this shape category bears similarity to the mix category defined by Settem et al. in their recent study.38 Dh–Ih nanocrystals possess Ih spine atoms, but no Ih center, like a Dh. To distinguish a Dh–Ih from a Dh, we stipulate that a Dh has a linear Ih spine, while a Dh–Ih does not. We employed linear regression to fit the coordinates of all the Ih spine atoms to a line. The classification of a nanocrystal's shape as Dh is based on R2 > 0.9, while the classification of Dh–Ih was assigned when R2 < 0.9. We found that every nanocrystal designated as Dh by the linear spine criterion also possessed greater than 20% of FCC and HCP bulk atoms. Similarly, every nanocrystal defined as Dh–Ih by the linear spine criterion contained less than 20% of FCC and HCP atoms. Finally, we define a nanocrystal as “amorphous” when more than 40% of its atoms are “uncategorized”, meaning their CNA indices do not occur in Table 1. Fig. 2 shows an example of each type of structure.
During CNA, atoms can occur with indices not listed in Table 1. A common reason for this is that the atoms reside in an amorphous environment in a (partially) melted nanocrystal. However, we found atoms in ordered environments with undefined CNA indices. These entries are shaded in Table 1 and we will discuss them below.
Fig. 3 shows snapshots of a Cu116 nanocrystal from four different viewpoints. All views of this nanocrystal reveal that it is highly ordered and CNA analysis indicates the shape is an Ih. 116 is not a magic size for the Ih and the surface atoms of this nanocrystal are distorted from those in a perfect Ih – thus, we designate it as a “twisted Ih”. We note that 116 is a magic size for the Dh–Ih39 and the “twisted Ih” bears similarity to the Dh–Ih in its surface atoms. Previously unclassified atoms with CNA are shown in yellow in Fig. 3. These are all surface atoms, with CN = 6, 8, and 9. Because these atoms belong to an Ih and they are distorted from their normal positions in an Ih, we designate them as “twisted” in Table 1.
Since CNA relies on a cut-off distance of dcut, it is important to specify this distance at the outset. The CNA environments for dcut between 2.6 and 3.6 Å for nanocrystals with 100, 116 and 130 atoms are illustrated in Fig. S2–S4.† If dcut is too small, few atoms fall within the geometrically bonded domain of the nearest neighbors. In this case, the CNA signature of those atoms is unclassified. We see a high percentage of unclassified atoms for all three sizes with dcut ≲ 2.7 Å. Considering large values of dcut, we observe a high percentage of unclassified atoms for Cu100 and Cu116 with dcut > 3.0 Å and for Cu130 with dcut > 3.4 Å. Thus, we obtain CNA indices with the least percentages of unclassified atoms for cut-off values in the range of 2.8–3.0 Å for these nanocrystal sizes and we adopted a value of dcut = 2.9 Å for our CNA analysis.
Validation of EAM potential using DFT
To assess the accuracy of the EAM potential used here, we performed DFT optimization of the most frequent shapes for five Cu nanocrystals containing 200 atoms, as described in the ESI.† Fig. S5† shows a plot of the DFT total energy of these nanocrystals as a function of the EAM energy. Though the EAM potential predicts the same energetic order as DFT for the various shapes, there is not a linear trend between the two methods. While the EAM energies for FCC, SCSF, and Dh nanocrystals are relatively close, the DFT energies show a larger spread. Conversely, the DFT energies of the Dh, Ih, and Dh–Ih are relatively close, but there is a relatively large gap between them in the EAM potential. We also compared the CNA environments of the optimized structures for these five different Cu nanocrystals from EAM and DFT. As shown in Fig. S6,† the distribution of CNA environments for each shape remains nearly the same after optimization. Although we did not study the same Cu nanocrystal sizes as Settem et al.,38 they found that the Cu EAM potential used here yields similar results to the Gupta potential used by them. They found a mixed agreement between the Gupta potential and DFT for a similar level of DFT used in their study.Results and discussion
In Fig. 4, we present the temperature-dependent distributions of the Cu nanocrystal shapes, in ten-atom increments. For the smallest size (N = 100, where N is the number of atoms in the nanocrystal), we see the Ih is the predominant shape at low temperatures, but the Dh–Ih becomes the most probable shape as the temperature increases. The amorphous shapes at the highest temperatures arise from melted Cu nanocrystals. Progressing to N = 110, there is a significant shift in the most probable shape to an Ih for most temperatures, with Dh–Ih appearing at temperatures close to melting. At nanocrystal sizes of 120 atoms, there is another significant transition in the most probable shape to FCC with a sizeable fraction of SCSF at low temperatures – consistent with prior predictions that N = 120 could be a magic size for an FCC nanocrystal49 – to a mix of Ih and Dh–Ih at higher temperatures. At 130 atoms, there is another significant change in the nanocrystal shape distribution to Ih at virtually all temperatures below melting. The Ih is essentially the only shape for nanocrystals with sizes ranging from 130–160 atoms, likely because of the proximity of these sizes to the magic size (147 atoms) for an Ih.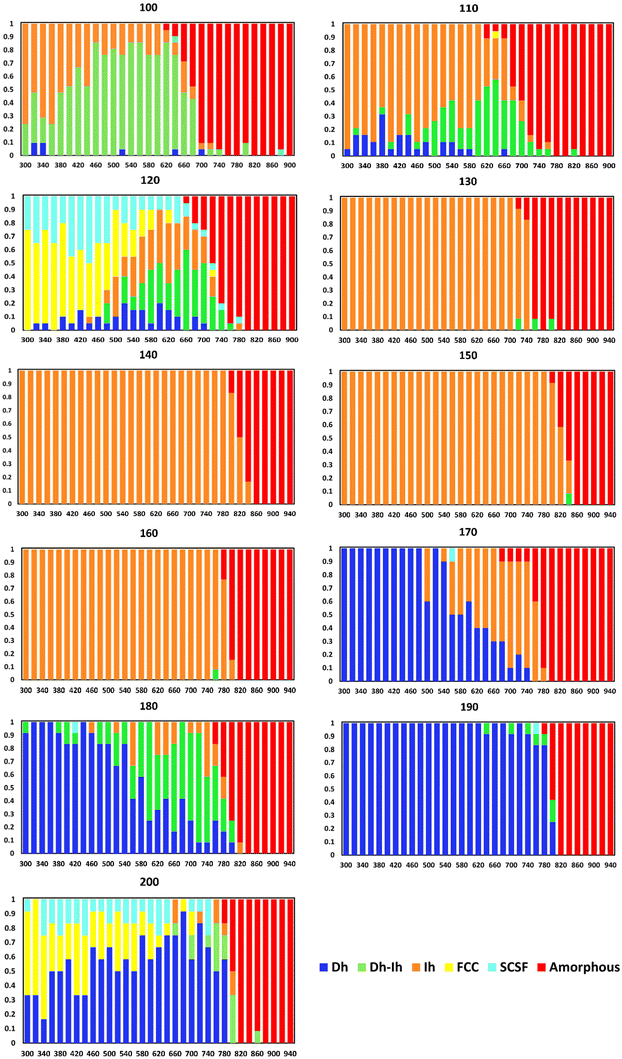 | ||
| Fig. 4 Nanocrystal shape distributions (fractions) as a function of temperature (K) for select sizes. | ||
At a nanocrystal size of 170 atoms, the Dh emerges as the most probable shape at low temperatures, while the Ih becomes the most probable shape at high temperatures. This trend continues to 180 atoms, except the Dh–Ih becomes the most probable shape at high temperatures. At N = 190, the Dh is virtually the only observable shape below the melting temperature. We note that the structure of the Dh with 190 atoms is similar to the magic structure of the (3,3,2) m-Dh truncated Marks Dh at size 192.50 At N = 200 the FCC is the most probable shape at the lowest temperatures – consistent with the findings of Rahm and Erhart,30 and the Dh becomes increasingly probable as the temperature increases. We note that Settem et al. studied the shapes of Cu201 using the Gupta potential and found a large proportion of Dh at this size.38
A couple of experimental studies probed the shapes of Cu nanocrystals in a vacuum environment and found that the nanocrystal shape depended on its size,51 as well as on temperature.52 While these studies are generally consistent with ours, the nanocrystals in the experiments were larger than those probed here. It would be beneficial for experiments to probe temperature-dependent nanocrystal shapes in the size range of this study.
Thus, in Cu we see the frequent occurrence of one shape being the most probable at low temperatures and another being the most probable at high temperatures. This was not observed in earlier studies of Au37 and Cu38 – though a limited number of sizes were probed in these studies – and it was observed to a lesser extent for Ag.39 Since the Helmholtz free energy (the relevant free energy for our PTMD simulations) is given by A = U − TS, where U is the potential energy and S is the entropy, we expect structures with the lowest potential energies to occur at low temperatures, and those with a significant entropic component to emerge at sufficiently high temperatures.
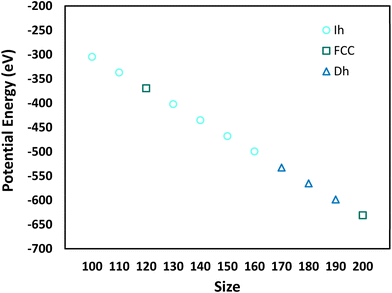
Fig. 5 shows the minimum potential energy as a function of nanocrystal size and delineates the shape for each minimum potential energy. Comparing the shapes in Fig. 5 to the most probable shapes at 300 K in Fig. 4, we see that the most probable shapes at 300 K are the shapes with the minimum potential energy. A detailed analysis of the shapes, which goes beyond the general classifications given in Fig. 4 and 5, reveals that the exact shapes from which the potential energies in Fig. 5 were derived are indeed the exact most probable shapes in Fig. 4. Thus, we would expect the most probable shapes at 300 K to occur at lower temperatures, with the effects of entropy emerging at higher temperatures.
There are three shapes that appear to be favored by entropy (i.e., they are not the most probable shape at low temperatures, but they become the most probable shape at high temperatures): Dh–Ih (N = 100–120, 180), Ih (N = 170), and Dh (N = 200). We note that the FCC and SCSF shapes are observed at low temperatures for N = 120 and 200 but are not prominent at temperatures around melting. These shapes are not favored by entropy.
To assess the entropic contribution to the free energy, we note the metal nanocrystals in our study possess three different types of entropy: configurational, rotational, and vibrational. Of all the shapes in Fig. 2, it is straight-forward to see how the FCC crystal would have the lowest configurational entropy. Interestingly for Ag, we observed that SCSF structures had a lower free energy (more frequent occurrence) than FCC structures – at sizes where such shapes occurred.39 We attributed the preference for SCSF to the low stacking-fault energy for Ag,53 which complements the high configurational entropy associated with stacking faults to produce a majority of SCSF shapes. Cu has a higher stacking-fault energy than Ag53 and though the most probable structures for the FCC and SCSF are close in energy (see Fig. S5†), we found that other SCSF structures with single stacking faults and multiple stacking faults have higher energies than the lowest-energy FCC structure. These observations contrast what we observed for Ag, where multiple structures with stacking faults were nearly degenerate in energy with the FCC shape. Thus, energy does not favor the SCSF shape, and it is not the most probable shape for Cu.
It is relatively straightforward to envision how the Dh, which is constrained to having a linear Ih spine, could rank lower than the Ih or the Dh–Ih in terms of its configurational entropy. Prior studies have shown Ih possess higher vibrational entropy than Dh, due to their lower vibrational frequencies.54,55 However, it is unclear where Dh–Ih structures rank in terms of their vibrational entropy. To assess these tendencies, we evaluated the vibrational entropies of the most probable Dh, Ih, and Dh–Ih structures (shown in Fig. S5†) for nanocrystals containing 200 atoms. Details of these calculations are given in the ESI.†
Fig. 6 shows the vibrational entropies for the three shapes as a function of temperature. The Dh–Ih exhibits the highest vibrational entropy across the entire temperature range, while the Dh consistently displays the lowest and the Ih is intermediate between the Dh and Ih. Our results for the vibrational entropy of the Dh and Ih are in agreement with those of Doye and Calvo, who also found higher entropy for the Ih.54 Our findings align well with the PTMD results in Fig. 4 that show increasing Dh–Ih in the shape distribution with increasing temperature. For sizes where Dh–Ih do not occur (N = 170) – presumably because these shapes are not favored by energy – Ih are favored over Dh as the temperature increases and for sizes where neither Dh–Ih nor Ih occur (N = 200), Dh become favored as the temperature increases.
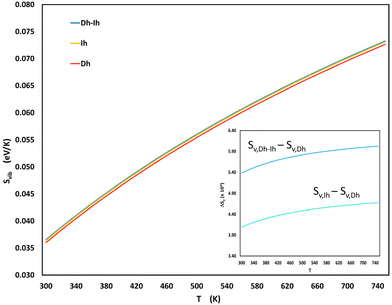 | ||
| Fig. 6 Vibrational entropy, given by eqn (S2) and (S3),† as a function of temperature for the most probable Dh, Ih, and Dh–Ih at a size of 200. The inset shows the entropy difference (×104) between the Dh–Ih and Dh, as well as between the Ih and the Dh as a function of temperature. | ||
Another trend in Fig. 4 is we see large shifts in the nanocrystal shape distributions with changes of ten atoms: in going from N = 100 → 110 → 120 → 130 and from N = 180 → 190 → 200. To further resolve this trend, we obtained shape distributions in single-atom increments for nanocrystal sizes ranging from 110–122 atoms. Fig. 7 shows the nanocrystal shape distributions for key sizes in this range. Shape distributions for sizes not shown in Fig. 7 are in Fig. S7† and we note these shape distributions are close to those of smaller neighboring sizes in Fig. 7.
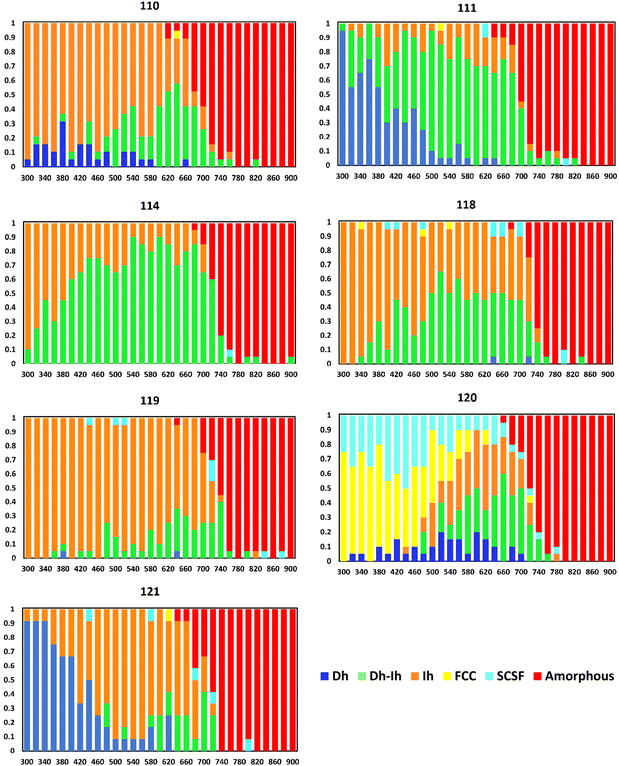 | ||
| Fig. 7 Nanocrystal shape distributions (fractions) as a function of temperature (K) for select sizes. | ||
From Fig. 7 and S7,† we see a major change in the shape distribution in going from 110 to 111 atoms, where the Ih is the most probable shape over a wide temperature range at N = 110, while for N = 111, the Dh is the most probable at low temperatures and the Dh–Ih is the most probable shape at high temperatures. The shape distribution at N = 111 is largely held for N = 112 and N = 113, then there is a significant change in going from N = 113 to N = 114, where we see an Ih is the most probable shape at low temperatures and the Dh–Ih emerges as the most probable shape at high temperatures. As we increase the number of atoms from N = 114, there is a smoothly decreasing fraction of Dh–Ih accompanied by an increasing fraction of Ih until N = 119, where the Ih is the most probable shape for all temperatures below melting. Moving from N = 119 to N = 120, there is a dramatic change in the shape distribution and another significant shape change occurs in going from 120 to 121 atoms. Thus, we see an interesting trend of alternating gradual shape changes over certain size ranges, and dramatic shape changes with a change of just one atom.
Fig. 8 shows the distribution of nanocrystal shapes as a function of size for four different temperatures. Here, we see dramatic changes in the shape distribution with size at 300 K in going from N = 110 to 111, 113 to 114, 119 to 120, and 120 to 121 – as we discussed above. Increasing the temperature to 400 K, we see a significant change in the shape distribution going from N = 110 to 111, 119 to 120, and 120 to 121, as we did for T = 300. However, we lose the abrupt change from N = 113 to 114 and there is a gradual change in the shape distribution going from N = 111 to 119 at 400 K. At the highest temperature of 600 K, the shape distribution changes gradually over the whole size range, with either the Dh–Ih or the Ih as the most probable shape. Thus, entropy tends to promote uniform nanocrystal shapes with increasing temperature.
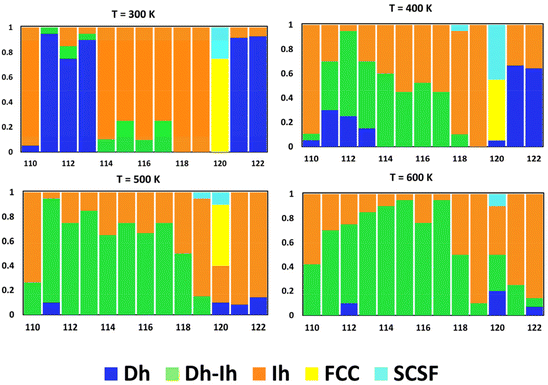 | ||
| Fig. 8 Nanocrystal shape distribution (fraction) as a function of size for four different temperatures (K). | ||
In a prior study of Ag nanocrystals in vacuum and solution environments, we observed similar changes in the shape distribution, termed “shape fluctuations” in vacuum, but not in solution.39 We could correlate these shape fluctuations with fluctuations in the percentage of surface atoms in vacuum – i.e., though the percentage of surface atoms decreases overall as the nanocrystal size increases, there are sizes at which this percentage increases. We saw the suppression of fluctuations with surface disorder, which was prominent in the solution environment. A similar analysis for Cu (details provided in the ESI†) reveals surface-atom fluctuations also accompany shape fluctuations for the significant shape transitions observed in going from N = 110 to 111 and for N = 119 to 120 to 121 (cf., Fig. 8 and Fig. S8†). However, unlike the case for Ag, this is not exclusive for Cu and surface-atom fluctuations do not accompany the significant shape transition going from N = 113 to 114. This may be related to similarities in the shapes of Dh, Ih, and Dh–Ih for these sizes, such that all these shapes possess similar surface environments.
Conclusions
In summary, we performed PTMD simulations of a series of Cu nanocrystals containing 100 to 200 atoms. These simulations allowed us to predict the temperature- and size-dependent shapes of the nanocrystals. Nanocrystals in this size range tended to exhibit dramatic shape changes with both size (sometimes with a change of just one atom) and with temperature for a single size. Complementary DFT calculations indicated that vibrational entropy favors nanocrystals with the Dh–Ih shape, with Ih nanocrystals falling second, and Dh ranking third in terms of vibrational entropy. These DFT results were consistent with the PTMD results, as well as with the results of prior studies. Overall, our studies indicated that entropy plays a significant role in determining the shapes of Cu nanocrystals, so studies aimed at determining minimum-energy shapes may fail to correctly predict shapes observed at experimental temperatures. The information from this study could be useful in efforts to devise processing routes to achieve selective nanocrystal shapes.Conflicts of interest
There are no conflicts to declare.Acknowledgements
This work was funded by the Department of Energy, Office of Basic Energy Sciences, Materials Science Division, Grant DE-FG02-07ER46414. This work used Bridges-2 at the Pittsburgh Supercomputing Center through allocation DMR110061 from the Advanced Cyberinfrastructure Coordination Ecosystem: Services & Support (ACCESS) program, which is supported by National Science Foundation grants #2138259, #2138286, #2138307, #2137603, and #2138296.References
- Y. Xin, K. Yu, L. Zhang, Y. Yang, H. Yuan, H. Li, L. Wang and J. Zeng, Adv. Mater., 2021, 33, 2008145 CrossRef CAS PubMed.
- B. Xiao, Z. Niu, Y. G. Wang, W. Jia, J. Shang, L. Zhang, D. Wang, Y. Fu, J. Zeng, W. He, K. Wu, J. Li, J. Yang, L. Liu and Y. Li, J. Am. Chem. Soc., 2015, 137, 3791–3794 CrossRef CAS PubMed.
- G. L. De Gregorio, T. Burdyny, A. Loiudice, P. Iyengar, W. A. Smith and R. Buonsanti, ACS Catal., 2020, 10, 4854–4862 CrossRef CAS PubMed.
- Y. X. Wang, C. L. Niu, Y. C. Zhu, D. He and W. X. Huang, ACS Appl. Energy Mater., 2020, 3, 9841–9847 CrossRef CAS.
- P. Zheng, H. Tang, B. Liu, S. Kasani, L. Huang and N. Wu, Nano Res., 2018, 12, 63–68 CrossRef.
- A. Ali, F. El-Mellouhi, A. Mitra and B. Aissa, Nanomaterials, 2022, 12, 788 CrossRef CAS PubMed.
- Z. Lyu, S. Zhu, M. Xie, Y. Zhang, Z. Chen, R. Chen, M. Tian, M. Chi, M. Shao and Y. Xia, Angew. Chem., Int. Ed., 2021, 60, 1909–1915 CrossRef CAS PubMed.
- S. Ding, J. Jiu, Y. Gao, Y. Tian, T. Araki, T. Sugahara, S. Nagao, M. Nogi, H. Koga, K. Suganuma and H. Uchida, ACS Appl. Mater. Interfaces, 2016, 8, 6190–6199 CrossRef CAS PubMed.
- M. L. R. Liman, M. T. Islam and M. M. Hossain, Adv. Electron. Mater., 2022, 8, 2100578 CrossRef CAS.
- Z. G. Guo, C. Sun, J. Zhao, Z. S. Cai and F. Y. Ge, Adv. Mater. Interfaces, 2021, 8, 2001695 CrossRef CAS.
- K. A. Fichthorn, Chem. Rev., 2023, 123, 4146–4183 CrossRef CAS PubMed.
- K. A. Fichthorn and T. Yan, J. Phys. Chem. C, 2021, 125, 3668–3679 CrossRef CAS.
- J. Kim, J. Cui and K. A. Fichthorn, ACS Nano, 2021, 15, 18279–18288 CrossRef CAS PubMed.
- X. Qi, Z. Chen, T. Yan and K. A. Fichthorn, ACS Nano, 2019, 13, 4647–4656 CrossRef CAS PubMed.
- J. Kim and K. A. Fichthorn, Faraday Discuss., 2022, 235, 273–288 RSC.
- J. Cui and K. A. Fichthorn, J. Chem. Phys., 2023, 158, 164707 CrossRef CAS PubMed.
- K. A. Fichthorn, Z. Chen, Z. Chen, R. M. Rioux, M. J. Kim and B. J. Wiley, Langmuir, 2021, 37, 4419–4431 CrossRef CAS PubMed.
- T. Balankura, T. Yan, O. Jahanmahin, J. Narukatpichai, A. Ng and K. A. Fichthorn, Nanoscale Adv., 2020, 2, 2265–2270 RSC.
- H. Xu, Z. Chen, S. Hao, K. A. Fichthorn and B. J. Wiley, Nanoscale, 2023, 15, 5219–5229 RSC.
- V. G. Grigoryan, D. Alamanova and M. Springborg, Eur. Phys. J. D, 2005, 34, 187–190 CrossRef CAS.
- M. Kabir, A. Mookerjee and A. K. Bhattacharya, Phys. Rev. A, 2004, 69, 10 CrossRef.
- H. Hakkinen, M. Moseler, O. Kostko, N. Morgner, M. A. Hoffmann and B. von Issendorff, Phys. Rev. Lett., 2004, 93, 093401 CrossRef PubMed.
- J. Wang, G. Wang and J. Zhao, Chem. Phys. Lett., 2003, 380, 716–720 CrossRef CAS.
- J. Oviedo and R. E. Palmer, J. Chem. Phys., 2002, 117, 9548–9551 CrossRef CAS.
- C. Massobrio, A. Pasquarello and A. Dal Corso, J. Chem. Phys., 1998, 109, 6626–6630 CrossRef CAS.
- J. P. K. Doye and D. J. Wales, New J. Chem., 1998, 22, 733–744 RSC.
- P. Calaminici, A. M. Koster, N. Russo and D. R. Salahub, J. Chem. Phys., 1996, 105, 9546–9556 CrossRef CAS.
- J. Garcia-Rodeja, C. Rey, L. J. Gallego and J. A. Alonso, Phys. Rev. B: Condens. Matter Mater. Phys., 1994, 49, 8495–8498 CrossRef CAS PubMed.
- O. B. Christensen and K. W. Jacobsen, Phys. Rev. B: Condens. Matter Mater. Phys., 1993, 5, 5591–5602 CrossRef CAS.
- J. M. Rahm and P. Erhart, Nano Lett., 2017, 17, 5775–5781 CrossRef CAS PubMed.
- V. G. Grigoryan, D. Alamanova and M. Springborg, Phys. Rev. B: Condens. Matter Mater. Phys., 2006, 73, 115415 CrossRef.
- C. Mottet, G. Treglia and B. Legrand, Surf. Sci., 1997, 383, L719–L727 CrossRef CAS.
- F. Baletto, R. Ferrando, A. Fortunelli, F. Montalenti and C. Mottet, J. Chem. Phys., 2002, 116, 3856–3863 CrossRef CAS.
- S. Valkealahti and M. Manninen, Phys. Rev. B: Condens. Matter Mater. Phys., 1992, 45, 9459–9462 CrossRef CAS PubMed.
- J. P. A. de Mendonca, F. V. Calderan, T. C. Lourenco, M. G. Quiles and J. L. F. Da Silva, J. Chem. Inf. Model., 2022, 62, 5503–5512 CrossRef CAS PubMed.
- N. Tarrat, M. Rapacioli and F. Spiegelman, J. Chem. Phys., 2018, 148, 204308 CrossRef PubMed.
- M. Settem, R. Ferrando and A. Giacomello, Nanoscale, 2022, 14, 939–952 RSC.
- M. Settem, C. Roncaglia, R. Ferrando and A. Giacomello, J. Chem. Phys., 2023, 159, 094303 CrossRef CAS PubMed.
- T. Yan, H. Zhang and K. A. Fichthorn, ACS Nano, 2023, 17, 19288–19304 CrossRef CAS PubMed.
- Y. Mishin, M. J. Mehl, D. A. Papaconstantopoulos, A. F. Voter and J. D. Kress, Phys. Rev. B: Condens. Matter Mater. Phys., 2001, 63, 224106 CrossRef.
- S. Plimpton, J. Comput. Phys., 1995, 117, 1–19 CrossRef CAS.
- G. Kresse and J. Hafner, Phys. Rev. B: Condens. Matter Mater. Phys., 1993, 47, 558–561 CrossRef CAS PubMed.
- G. Kresse and J. Hafner, Phys. Rev. B: Condens. Matter Mater. Phys., 1994, 49, 14251–14269 CrossRef CAS PubMed.
- G. Kresse and J. Furthmüller, Phys. Rev. B: Condens. Matter Mater. Phys., 1996, 54, 11169–11186 CrossRef CAS PubMed.
- A. Togo, L. Chaput, T. Tadano and I. Tanaka, J. Phys.: Condens. Matter, 2023, 35, 353001 CrossRef CAS PubMed.
- A. Togo, J. Phys. Soc. Jpn., 2023, 92, 012001 CrossRef.
- D. Faken and H. Jonsson, Comput. Mater. Sci., 1994, 2, 279–286 CrossRef CAS.
- C. L. Cleveland and U. Landman, J. Chem. Phys., 1991, 94, 7376–7396 CrossRef CAS.
- J. P. K. Doye and D. J. Wales, Chem. Phys. Lett., 1995, 247, 339–347 CAS.
- F. Baletto, C. Mottet and R. Ferrando, Phys. Rev. B: Condens. Matter Mater. Phys., 2001, 63, 155408 CrossRef.
- C. Langlois, D. Alloyeau, Y. Le Bouar, A. Loiseau, T. Oikawa, C. Mottet and C. Ricolleau, Faraday Discuss., 2008, 138, 375–391 RSC.
- F. Silly and M. R. Castell, ACS Nano, 2009, 3, 901–906 CrossRef CAS PubMed.
- R. Li, S. Lu, D. Kim, S. Schonecker, J. Zhao, S. K. Kwon and L. Vitos, J. Phys.: Condens. Matter, 2016, 28, 395001 CrossRef PubMed.
- J. P. Doye and F. Calvo, Phys. Rev. Lett., 2001, 86, 3570–3573 CrossRef CAS PubMed.
- S. Jindal and S. S. Bulusu, J. Chem. Phys., 2020, 152, 154302 CrossRef CAS PubMed.
Footnotes |
| † Electronic supplementary information (ESI) available. See DOI: https://doi.org/10.1039/d4nr00317a |
| ‡ Equal contributions by both authors. |
| This journal is © The Royal Society of Chemistry 2024 |

