
Exploring the formation of gold/silver nanoalloys with gas-phase synthesis and machine-learning assisted simulations†
Quentin
Gromoff
a,
Patrizio
Benzo
a,
Wissam A.
Saidi
 bc,
Christopher M.
Andolina
c,
Marie-José
Casanove
a,
Teresa
Hungria
d,
Sophie
Barre
a,
Magali
Benoit
a and
Julien
Lam
*ae
bc,
Christopher M.
Andolina
c,
Marie-José
Casanove
a,
Teresa
Hungria
d,
Sophie
Barre
a,
Magali
Benoit
a and
Julien
Lam
*ae
aCEMES, CNRS and Université de Toulouse, 29 rue Jeanne Marvig, 31055 Toulouse Cedex, France
bNational Energy Technology Laboratory, United States Department of Energy, Pittsburgh, PA 15236, USA
cDepartment of Mechanical Engineering and Materials Science, University of Pittsburgh, Pittsburgh, PA 15261, USA
dCentre de MicroCaractérisation Raimond Castaing, Université de Toulouse, 3 rue Caroline Aigle, F-31400 Toulouse, France
eUniv. Lille, CNRS, INRA, ENSCL, UMR 8207, UMET, Unité Matériaux et Transformations, F 59000 Lille, France. E-mail: julien.lam@cnrs.fr
First published on 20th November 2023
Abstract
While nanoalloys are of paramount scientific and practical interest, the main processes leading to their formation are still poorly understood. Key structural features in the alloy systems, including the crystal phase, chemical ordering, and morphology, are challenging to control at the nanoscale, making it difficult to extend their use to industrial applications. In this contribution, we focus on the gold/silver system that has two of the most prevalent noble metals and combine experiments with simulations to uncover the formation mechanisms at the atomic level. Nanoparticles were produced using a state-of-the-art inert-gas aggregation source and analyzed using transmission electron microscopy and energy-dispersive X-ray spectroscopy. Machine-learning-assisted molecular dynamics simulations were employed to model the crystallization process from liquid droplets to nanocrystals. Our study finds a preponderance of nanoparticles with five-fold symmetric morphology, including icosahedra and decahedra which is consistent with previous results on mono-metallic nanoparticles. However, we observed that gold atoms, rather than silver atoms, segregate at the surface of the obtained nanoparticles for all the considered alloy compositions. These segregation tendencies are in contrast to previous studies and have consequences on the crystallization dynamics and the subsequent crystal ordering. We finally showed that the underpinning of this surprising segregation dynamics is due to charge transfer and electrostatic interactions rather than surface energy considerations.
1. Introduction
By combining two or more metallic elements within the same nanoparticle, synergistic properties can emerge and result in innovative technological applications.1–4 Numerous research fields including optics, catalysis, biomedicine and electronics are already considering these so-called nanoalloys mainly because they exhibit the fundamental advantage of an extremely rich structural landscape with a variety of shapes, chemical ordering and crystalline phases. However, since the physical and chemical properties of nanoalloys are intrinsically related to their internal structure, advances in this field are strictly constrained by synthesis experiments, and it becomes crucial to better understand the intricate relationship between the experimental conditions and the obtained structures. Addressing this pivotal challenge first comes directly from experimental studies, where two types of complementary approaches are usually considered: (1) systematic variations of experimental conditions are followed by post-mortem structural analysis5–10 and (2) in situ experiments allow for a direct observation of the nanoalloy formation.11–17Computational simulations have been the ideal complementary tool because they offer an unambiguous atomistic picture and enable standardized examinations of various experimental parameters. In this context, the dynamics of nanoalloy formation are usually investigated with classical force fields via Monte Carlo and molecular dynamics simulations, typically employed to study large-scale systems.18–22 The derived predictions, however, often lack chemical accuracy and can hardly be used to draw quantitative conclusions. As an alternative, quantum simulations based on first-principles density functional theory (DFT) have been performed in order to address this accuracy issue.23–27 However, due to their high computational costs, these methods are often limited to the equilibrium properties of bulk systems or small clusters. Recently, machine-learning approaches have been proposed to bridge the gap between these two approaches. Indeed, machine-learning interaction potentials (MLIP) are constructed by combining a very complex mathematical formulation with numerous fitting parameters along with an extensive DFT-generated database composed of different structures in conjunction with their associated energies, forces, and virials. Evidence of the success of these methods can be seen through the very diverse types of materials that have been so far modeled with MLIP, including metals, oxides, carbon and silicon-based organics, and perovskites.28–44 Prompted by these advances, DFT accurate large scale simulations can finally be carried out to investigate the intricate formation processes occurring in nanoparticle synthesis.
Herein we studied the formation of AuAg nanoalloys that have been considered in many applications owing to, in particular, their plasmonic,45–47 catalytic45,47–49 and antibacterial50–53 properties. In this context, targeted technological applications require the control over two principal structural parameters. First, different morphologies can be stabilized with a competition between truncated octahedron structures and five-fold symmetric morphology including an icosahedron and decahedron that originates from the balance between cohesive, surface and elastic strain energies.54–64 Second, while metallic species can be found in different chemical arrangements with the possibility of surface segregation, there is currently no consensus in the literature on whether gold or silver is more likely to segregate on the surface.23,57,65–80
In this contribution, we experimentally show that gas-phase synthesis can lead to decahedral and icosahedral AuAg nanoalloys both exhibiting unambiguous gold surface segregation. Our machine-learning assisted simulations confirmed these experimental findings and enabled investigations over a wider spectrum of chemical compositions. Moreover, the simulations allowed us to go beyond post-mortem analysis, thus uncovering how gold segregation can affect the nucleation process triggering the nanoparticle crystallization at the atomistic level. When compared to the current literature, the novelty of this work is three-fold: (1) pentatwinned decahedra/icosahedra are not only present in mono-metallic systems and can also be stabilized in the case of AgAu nanoalloys, (2) gold atoms can segregate at the nanoparticle's surface even with equimolar and silver-rich compositions and (3) machine-learning assisted simulations can be used to model nanoalloys accurately to observe atomic scale processes occurring during their formation.
2. Methodology
Two complementary approaches were applied to investigate the formation of AgAu nanoalloys. We used gas-aggregation magnetron-sputter deposition from two elemental targets of gold and silver to synthesize the AuAg nanoparticles. Note that this synthesis process involves the nucleation and growth of the nanoparticles inside a gas aggregation chamber, before their landing on the substrate.81 These nanoparticles are extremely pure, i.e., free from any ligand or surfactant. The synthesized nanoparticles were further investigated using high-resolution transmission electron microscopy (HRTEM) and high-angle annular dark-field scanning TEM (HAADF-STEM) for uncovering their structural and morphological details. The chemical distribution of the two elements inside a given nanoparticle was analyzed by energy-dispersive X-ray spectroscopy (EDS-STEM). In concert, machine-learning-assisted simulations were carried out. In particular, we used a deep neural network potential (DNP) that was previously developed by Andolina et al.82 and was further tested under numerous conditions [see ESI A†]. A key advantage of using the DNP approach is that, although this is not yet sufficient for reaching the observed experimental sizes (≈7.5 nm), we still managed to perform molecular dynamics (MD) with a much longer duration and a larger number of atoms (≈15![[thin space (1/6-em)]](https://www.rsc.org/images/entities/char_2009.gif) 000 atoms i.e. 6.3 nm) than that can be expected from typical DFT calculations.
000 atoms i.e. 6.3 nm) than that can be expected from typical DFT calculations.
2.1. Experimental setup
AuAg nanoparticles were grown in a water-cooled Nanogen-Trio Gas Aggregation Source (GAS), from Mantis Deposition Ltd. The nucleation and growth of the particles are obtained through DC magnetron co-sputtering of extremely pure (99.99%) Au and Ag targets of diameter equal to 1 inch, located side by side on an integrated magnetron sputtering head, positioned at 90 mm from the exit slit of the aggregation zone. The DC magnetron current, applied independently to the two targets, was fixed to 40 mA for both gold and silver. With the synthetic method, it would be possible to control the stoichiometry by using an alloyed target with precise chemical composition. However, studying the influence of the chemical composition would then require the fabrication of targets with different stoichiometry. For each of them, the sputtering property would not necessarily be similar which should change the nanoparticle size distribution. In order to study the influence of the chemical composition for a fixed size distribution, we opted instead to use two elemental targets with a specific set of electrical powers applied in each of them. This allows us to obtain different chemical compositions in a single experiment all with the same sputtering conditions. Before depositing on the ultra-thin-carbon coated copper TEM grid, located in an ultra-high-vacuum deposition chamber (with a base pressure of 10−9 mbar), the nanoparticles were size-selected using a quadrupole mass filter installed between the GAS and the deposition chamber. The obtained nanoparticles were studied through high-resolution TEM (HRTEM), atomically resolved high-angle annular-dark-field scanning TEM (HAADF-STEM) and energy-dispersive X-ray spectroscopy (EDS) experiments. A Cs-corrected 200 kV FEI Tecnai F20 microscope was used for HRTEM studies, and a probe-corrected Jeol ARM200F microscope was used for HAADF-STEM and EDS studies. We noted that no oxidation of the nanoparticles was observed even when the EDS analysis was performed several months after the synthesis.2.2. Atomistic simulations
Regarding the interaction potentials, the complexity and non-linearity of deep neural networks allowed the development of interaction potentials capable of making predictions close to DFT accuracy. The deep neural network interaction potential for Au–Ag (DNP) developed by Andolina et al.82 using the DeepPot-SE83 method of the DeePMD-Kit84 was selected for this work because of its excellent accuracy with pure as well as alloyed systems [see ESI A†]. All DFT calculations were performed with VASP85–87 using the Perdew–Burke–Ernzerhof88 (PBE) functional and the projector augmented wave (PAW) method89 with an energy cutoff of 400 eV.Molecular dynamics (MD) trajectories were obtained using a large-scale atomic/molecular massively parallel simulator (LAMMPS) coupled to the DNP. We employed a constant volume and constant temperature (NVT) ensemble in these simulations with a time-step of 1 fs and a damping coefficient of 100 fs. Liquid droplets were obtained by melting nanoparticles of three sizes (250, 500 and 750 atoms with respectively 1.4 nm, 2.0 nm and 2.4 nm diameters) for three stoichiometries (Ag3Au, AgAu and AgAu3) at 2000 K. For the freezing simulations, we utilized a cooling rate of 2 × 10¹¹ K s−1 from 750 K to 350 K. The process was repeated three times with different initial velocities. The employed numerical setup that involved freezing disordered liquid droplets was already used to simulate nanoparticle formation and mimic gas-phase synthesis.90–92 In addition, to assess the stability of our obtained systems, we also carried out hybrid MD/MC simulations that involved 10 Monte Carlo (MC) moves combined with 10 atomic species swapping every 100 MD time steps.
We noted that our choice of simulation protocol assumes that the nanoparticles were formed from the liquid phase. However, we must note that similar experiments have also been modeled with atom by atom growth directly from solid precursors.93–95 At this stage, it remains difficult experimentally to know which formation pathway is more likely to occur in our experimental protocol.
Finally, simulations were analyzed using Ovito96 built-in functions. Common neighbor analysis was employed to measure crystal ordering.97 To obtain the size of the largest ordered cluster, atoms with crystalline order were grouped together in clusters within a cut-off equal to 3.5 Å.
3. Results
3.1. Morphology
We began by analyzing the morphologies of both the experimentally synthesized and the simulated structures. HAADF-STEM observations show that the synthesized nanoparticles are well-dispersed on the substrate and show a narrow size distribution with a mean diameter of 7.4 nm and a standard deviation of 0.75 nm (see ESI B†). When suitably oriented along (or close to) one of their low-index zone axes, the synthesized nanoparticles can be clearly identified as either decahedra or icosahedra,98 both exhibiting triangular surfaces dominated by (111) orientations. Fig. 1(a–c) show three different HRTEM images of representative nanoparticles, one 10.5 nm large decahedron (Fig. 1(a)), one 7.5 nm large icosahedron (Fig. 1(b)) and one 9.9 nm large icosahedron (Fig. 1(c)). Similarly, although not with the same size because of the computational cost of the numerical freezing setup, our MD simulations in conjunction with the DNP were able to reproduce the (111) surface preponderance signature of the icosahedron and decahedron shapes [see Fig. 1(d–f)]. In addition, DNP simulations allowed for characterizing the crystal structure at the atomic scale [Fig. 1(d–f)]. In all cases, the facets consist of face-centered cubic triangles whose edges are characterized by hexagonal close-packed atoms which is consistent with the (111) orientation of the surfaces. To better characterize the crystallinity of the simulated nanoparticles, we also measured the atomic strain distribution with respect to the radial position [see ESI E†]. The strain map shows overall very small deviations from the bulk. The latter is slightly more pronounced for atoms located at the droplet surface, which can be attributed to inherent surface relaxations. Importantly, with our hybrid MD/MC simulations, no structural modification was observed, thus confirming the stability of five-fold symmetric shapes [see ESI C†]. Altogether, our results suggest that an icosahedron/decahedron can be stabilized instead of a truncated octahedron even with AgAu nanoparticles in the investigated size regime, i.e. up to 10.5 nm in experiments and up to 2.4 nm in simulations.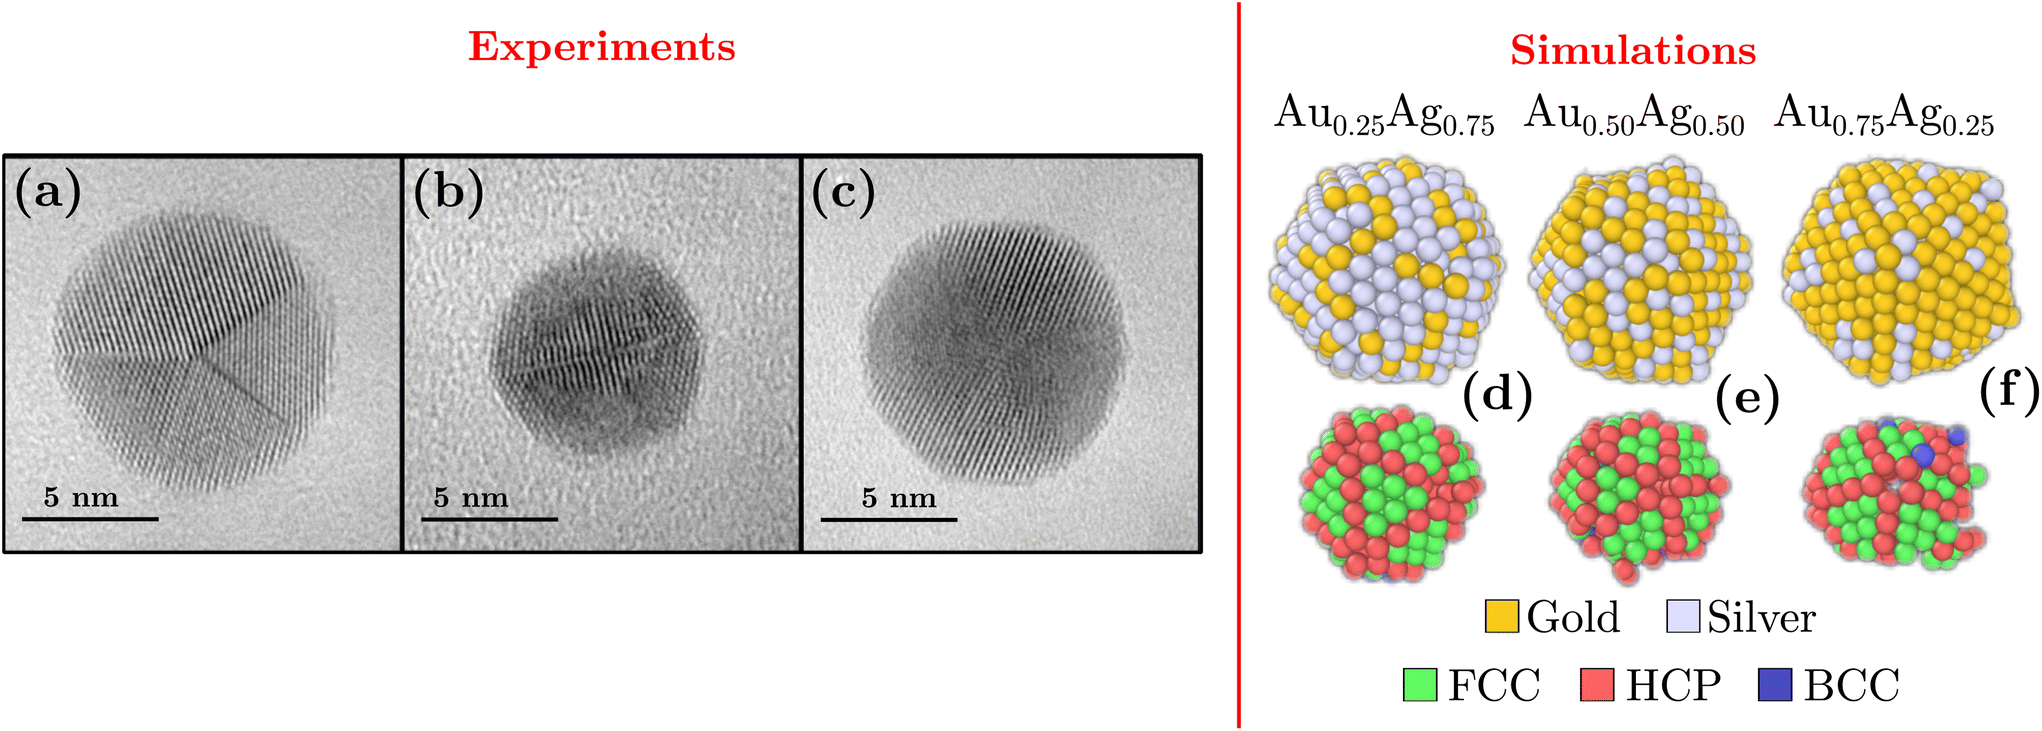 | ||
| Fig. 1 (Left) HRTEM images of 3 representative AuAg nanoparticles. (a) A decahedral NP observed along its five-fold symmetry axis, (b) an icosahedral NP observed along its two-fold symmetry axis, (c) an icosahedral NP observed close to its 3 fold-symmetry axis. (Right) (d–f) Typical nanoparticles obtained after freezing using machine-learning-assisted MD simulations for three different chemical compositions along with the corresponding crystal analysis as obtained using common neighbor analysis with FCC, HCP and BCC being respectively face-centered cubic, hexagonal close-packed and body-centered cubic. Non-crystalline atoms (including surface atoms) were removed for clarity. | ||
For metallic systems in general, icosahedron/decahedron and truncated octahedral shapes are considered more stable respectively at small and large sizes according to surface vs. volume energy considerations54–56,59–64 However, the size threshold allowing for the transition between the two shapes is still highly debated. In experiments for mono-metallic systems, an icosahedron and decahedron were usually obtained by physical methods of synthesis.54–56,58 Furthermore, previous studies investigated gold nanoparticles of diameters up to 10 nm and showed that the as-obtained icosahedron/decahedron-shaped nanoparticles remain stable after long periods of electron irradiation in the TEM experiments,54,55 demonstrating that, even when obtained under non-equilibrium conditions, both an icosahedron and decahedron are thermodynamically more stable than a truncated octahedron. So far, such experimental results were only obtained with mono-metallic systems including both silver and gold. Meanwhile, from the simulation viewpoint, the literature regarding this competition in shape also focused solely on mono-metallic systems. In this context, early works based on semi-empirical interaction potentials attained much smaller crossover sizes leading to truncated octahedral particles being more preponderant even at sizes in the 1 nm to 10 nm regimes.62–64,99 However, most recent results combining DFT accurate models with equilibrium thermodynamic approaches based on Helmholtz free energy demonstrated instead the decahedral stability54,60 for nanoparticles up to 15 nm. Similar to previous studies focusing on mono-metallic systems, our study shows with alloyed AuAg nanoparticles that icosahedron/decahedron shapes are stable even for diameters up to 10.5 nm. Altogether, our results are therefore consistent with the literature obtained in the mono-metallic regime. Finally, we must note that the stability of non-crystalline structures including decahedra can be favored when mixing different metals in a nanoparticle like in AgCu.100,101 Furthermore, it cannot be ruled out that the observed decahedra may also result from kinetic trapping at the early stages of the growth processes.
3.2. Chemical ordering
By using EDS measurements, we were able to investigate the chemical distribution inside a given nanoparticle. Fig. 2(a–c) display the chemical maps of isolated nanoparticles with compositions Au0.58Ag0.42, Au0.65Ag0.35 and Au0.74Ag0.26. Interestingly, these different compositions were observed in the same sample. Such composition variations can be attributed to a slight evolution of the synthesis conditions such as targets’ race track and temperature during the deposition time, which was in our case as long as 15 minutes, a duration necessary to collect a sufficiently large number of nanoparticles on the TEM grid in our setting. We were thus able to analyze nanoparticles with different compositions although silver-rich nanoparticles were not observed experimentally. A striking feature in all these maps is the occurrence of a non-homogeneous distribution with gold atoms segregating at the surface for all of the synthesized chemical compositions. For a more quantitative picture, density profiles recorded along the diameter of the nanoparticles are presented in Fig. 2(d–f). These profiles confirm the gold surface segregation, the silver atoms being mostly confined in the nanoparticle core. In more details, for nanoparticles with compositions Au0.58Ag0.42, Au0.65Ag0.35 and Au0.74Ag0.26, we obtained the following respective Au/Ag ratio 1.41, 1.29 and 1.10 by averaging the Au content over the 5 external atomic layers (∼1.25 nm). Note that gold surface segregation was also qualitatively confirmed by HAADF-STEM observations owing to the sensitivity of this technique to the atomic number of the encountered elements (z-contrast) (see ESI B†).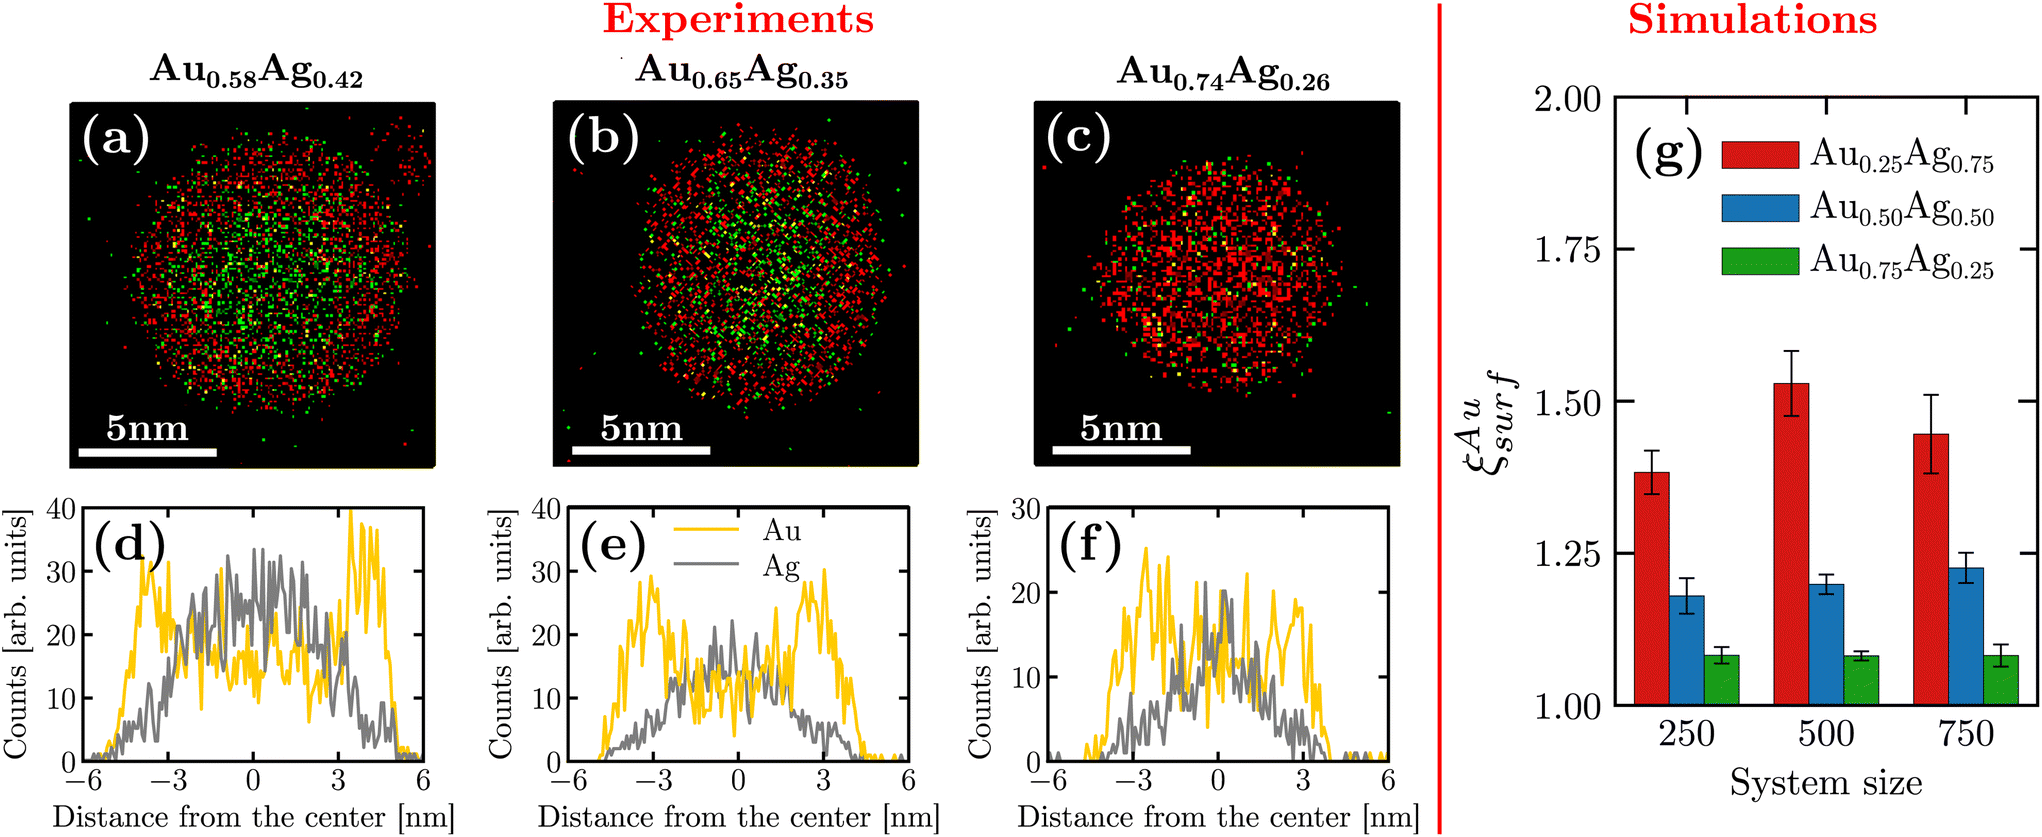 | ||
| Fig. 2 (Left) (a–c) Experimental EDS measurements for three nanoparticles with different chemical compositions. Au and Ag elements are respectively colored in red and green. (d–f) Distribution of atomic species for the corresponding nanoparticles. (Right) (g) Surface chemical composition obtained in machine-learning assisted MD simulations. Results are shown for different chemical compositions and nanoparticle sizes. Error bars are obtained from averaging over three independent initial conditions. | ||
In order to span a larger range of chemical composition, we complemented the experimental observations with numerical simulations. We separated surface atoms from the bulk based on their lower coordination numbers (<10). Fig. 2(g) shows the ratio between the gold proportion at the surface and in the entire nanoparticle denoted by ξAusurf. As seen in the figure, our results confirm that gold segregates on the surface even in the regime of silver-rich nanoparticles [see ESI D† for the density profile obtained from the simulations].
An additional finding is that the gold surface segregation is larger for Au0.25Ag0.75 than for the less silver-rich nanoparticles. In order to better understand the gold surface segregation obtained at the end of the freezing simulation, we also measured the temporal evolution of the mean square displacement in the initial liquid regime[see Fig. SI F†]. While all atoms located in the center of the droplet exhibit similar behavior for the mean square displacement, atoms located at the surface possess different diffusion properties depending on their chemical nature or the chemical composition of the droplet. In particular, the diffusion at the surface is lowered when increasing the gold composition. More importantly, silver atoms are always more diffusive than gold atoms at the surface which is consistent with silver atoms being less stable at the surface and showing the tendency to migrate inside the core of the droplet.
Because these first numerical results were obtained from fully freezing liquid droplets, we could only consider systems not larger than 750 atoms which correspond to a diameter of 2.4 nm. Therefore, we also performed simulations with an alternative protocol to study larger nanoparticles of diameters up to 6.3 nm. The systems were initialized in the icosahedral structures that circumvent the necessity of having to simulate the whole freezing mechanisms while enabling for directly reaching the previously observed morphology. The atomic chemical species between gold and silver were then randomly assigned to correspond to the three studied stoichiometries of AgAu alloys. MD simulations were combined with MC moves and atomic species swapping at 600 K, which is large enough for atomic swapping to operate while maintaining the crystal ordering and overall morphology. By starting with ordered structures yet with chemical disorder, we can focus on the temporal evolution of the surface composition while simulating the larger nanoparticles. In particular, we studied nanoparticles made of 923, 5083 and 14993 atoms, which correspond respectively to 2.5 nm, 4.4, nm and 6.3 nm. Fig. 3 shows that the convergence is already obtained after 10 ps for the smallest studied systems while the others would require unreasonably higher computational times. Yet, it remains that in all cases, while starting at a value of 1, ξAusurf monotonically increases with time indicating that similar to the smaller nanoparticles gold segregation at the surface exists in the larger sizes, which is consistent with the experimental results. Moreover, similar to previous results obtained after the freezing simulations for the smaller nanoparticles, the gold surface segregation remains higher in the silver-rich stoichiometries.
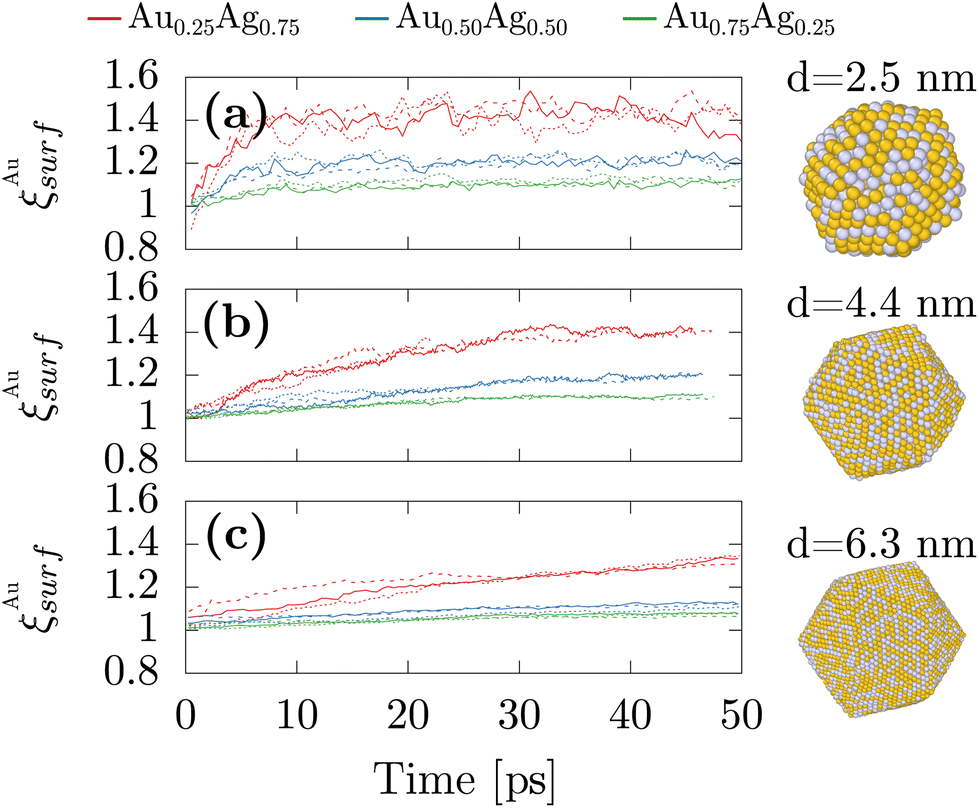 | ||
| Fig. 3 Temporal evolution of the surface chemical composition obtained from machine-learning assisted MD simulations combined with Monte-Carlo and atomic species swap initialized with icosahedral nanoparticles for three different nanoparticles sizes 923, 5083 and 14993 atoms which correspond respectively to 2.5 nm (a), 4.4, nm (b) and 6.3 nm (c). | ||
Altogether, both our experimental and numerical results demonstrate that gold surface segregation can be obtained in AgAu nanoparticles regardless of the size and the composition. In experiments, we show that it happens for gold-rich systems while in simulations, we confirm the experimental results and predict that it remains true even for silver-rich systems.
3.3. Study of the crystallization dynamics
A key advantage of our DNP simulations over experiments, and also DFT calculations that usually employ 0 K minimization to explore the structural landscape, is that we can retrieve the crystallization dynamics at the atomistic scale. To this end, we followed the evolution of crystal ordering by measuring the size of the biggest ordered cluster [Ncrys in Fig. 4(a)] and observed that crystallization started at different temperatures depending on the chemical composition. In particular, silver-rich nanoparticles crystallized first and also reached a higher final value for Ncrys. Fig. 4(b) shows the temporal evolution of ξAusurf. While oscillations were observed, ξAusurf consistently remains greater than one, indicating that gold segregation already occurs in the liquid regime at the early stages of freezing. A plateau in ξAusurf is also reached after 1 ns and bellow 550 K. In the same intermediate times, according to Fig. 4(a), the plateau for Ncrys is not yet fully achieved, suggesting that chemical ordering happens beforehand. We further define ξAucrys as the relative chemical composition that was previously measured, but within the largest crystalline cluster as opposed to the surface. Fig. 4(c) shows that ξAucrys also quickly converges when compared to Ncrys thus confirming that chemical ordering occurs first. The values of the observed plateaus are all below or close to 1, which is consistent with ξAusurf being above 1. Indeed, the more gold atoms are present at the surface, the more silver atoms are within the crystalline core of the nanoparticles. For this analysis, while we only showed the temporal evolution of one nanoparticle per chemical composition, ESI G† shows two additional cases that exhibit similar behavior. Finally, the associated snapshots for different sizes of the largest crystalline cluster can be retrieved from those temporal evolutions [see Fig. 4(d)]. From these images, one can observe that crystallization occurs first at the periphery of the droplet instead of its core and slowly grows towards the core [see ESI H† for a more quantitative confirmation].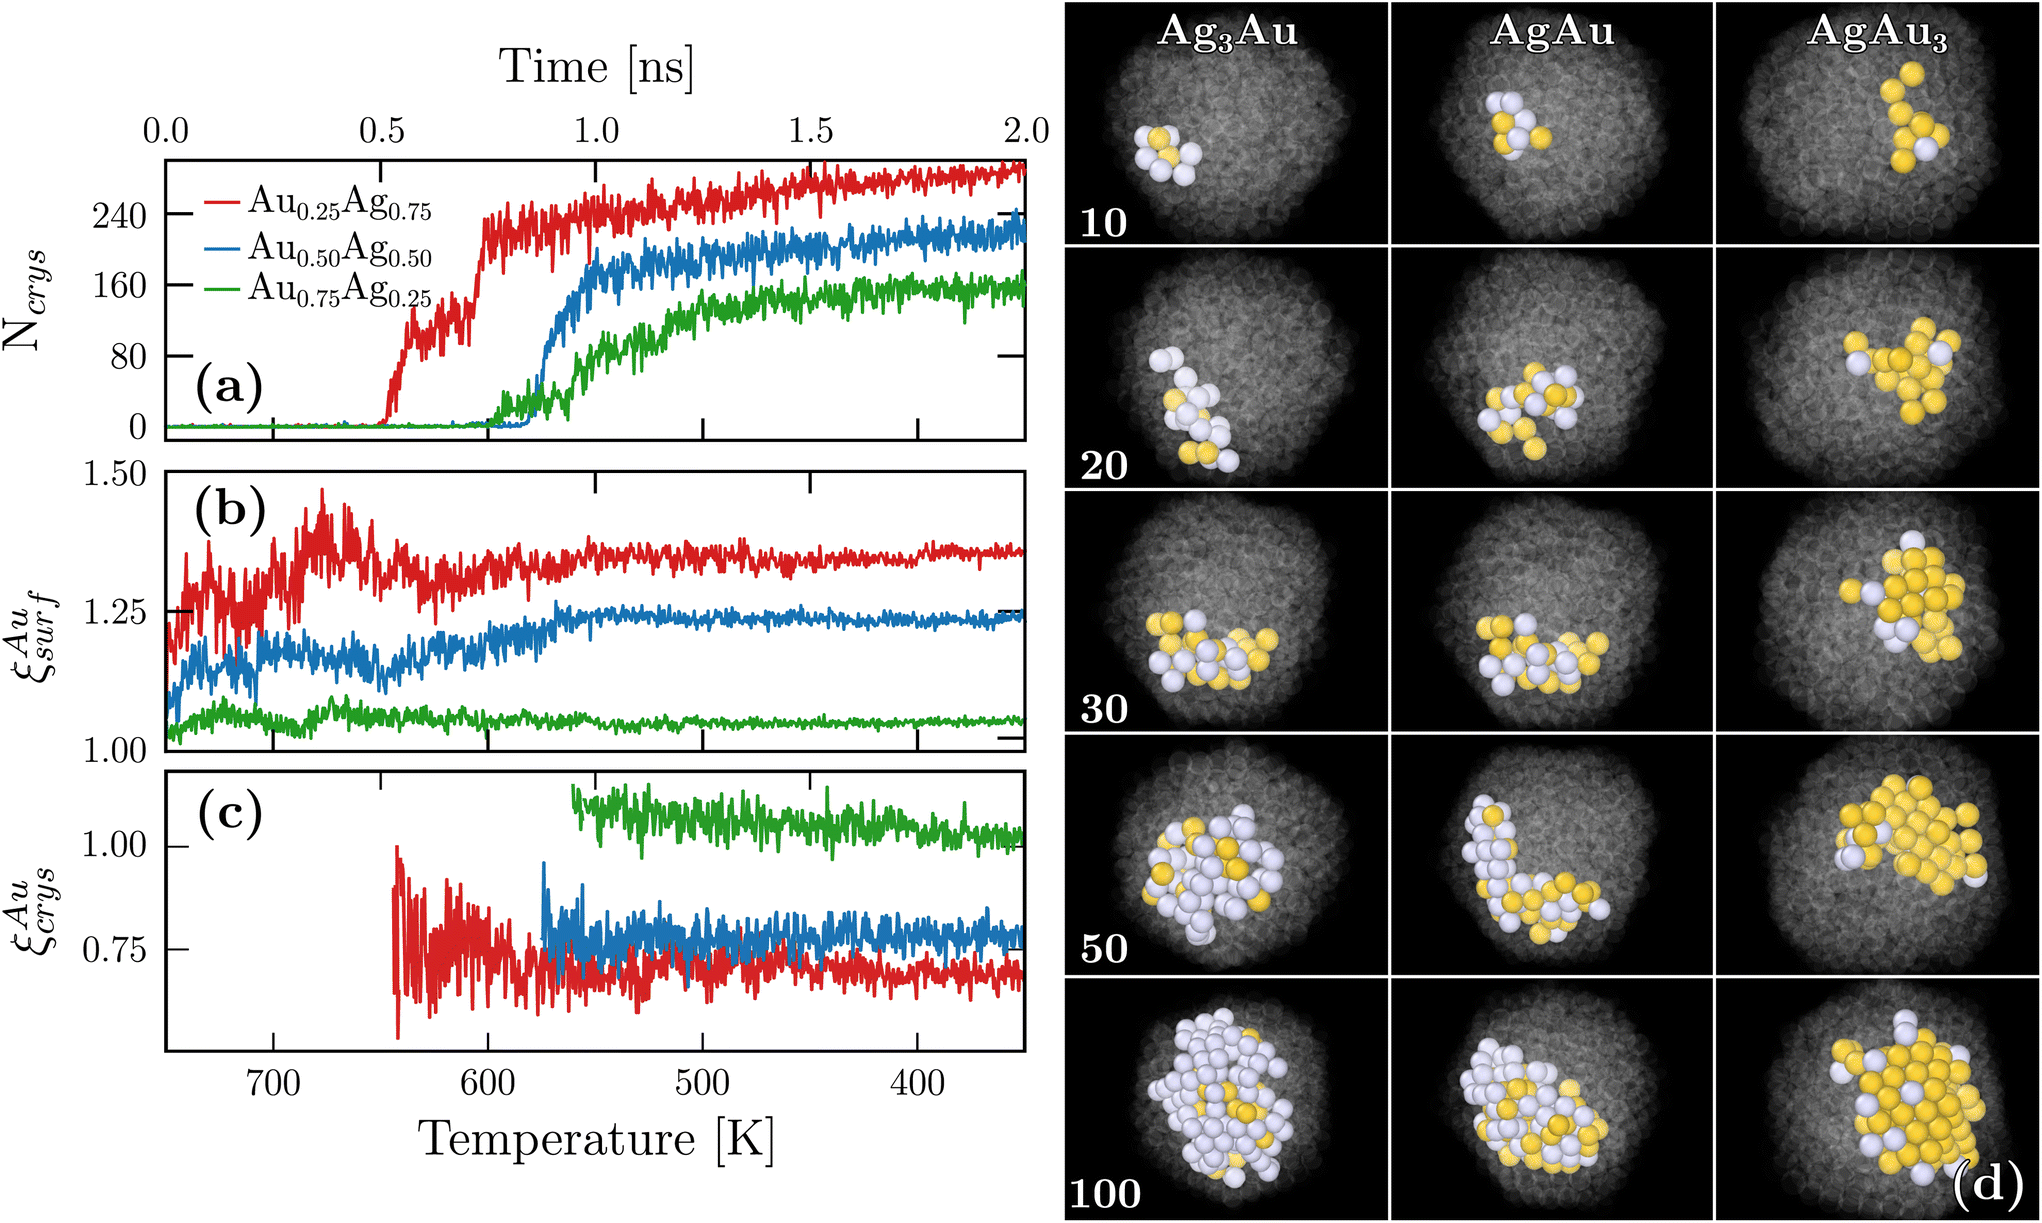 | ||
| Fig. 4 (a–c) Temporal evolution obtained from MD freezing with nanoparticles of 750 atoms. Ncrys is the number of atoms within the biggest crystalline cluster. ξAusurf (resp. ξAucrys) denotes the ratio between the gold proportion at the surface (resp. in the biggest crystalline cluster) and in the entire nanoparticle. We note that for ξAucrys results are only shown when the crystalline cluster is big enough i.e. Ncrys > 50. (d) The corresponding images obtained during the crystallization. Non-crystalline atoms are rendered in transparency and grey (resp. yellow) spheres correspond to silver (resp. gold) atoms. | ||
Altogether, our findings show that the gold surface segregation occurs already in the liquid regime which has consequences on the subsequent crystallization process. First, we note that gold possesses a larger melting temperature both in bulk and at the nanoscale thus indicating that gold crystals are more stable than silver ones. However, in the silver-rich system, the atoms available to trigger crystallization are mostly silver since the majority of gold atoms are at the surface. In contrast, in the gold-rich system, there is a mixture of the remaining gold atoms with all the silver atoms. In one case, a nearly pure metal crystallizes, but in the other, nucleation occurs in an alloying regime which is less favorable. As such, the fact that silver-rich nanoparticles are more crystalline in our simulations is a consequence of the initial chemical ordering that is established already in the liquid regime.
4. Discussion
The surface segregation in AgAu nanoparticles has been the subject of numerous studies with experimental65–69 and numerical70–80,102 approaches. Experimentally, chemically-synthesized nanoparticles have been found to exhibit silver surface segregation,65–67 which was explained in part by the presence of the oxidized surfaces.77 To the best of our knowledge, only two experimental studies observed surface segregation in AgAu nanoalloys made with physical routes of synthesis which is crucial for comparison with our results since they allow for the effects of the ligands and the liquid solvent to be ruled out.57,69 The first study shows surface segregation occurring for the most preponderant chemical species and explained these observations by kinetic trapping at the early stages during growth.57 On the one hand, in the gold-rich system, their result is similar to ours although we will show later that kinetic trapping is not the only possible stabilizing effect and that charge transfer can also stabilize the gold segregated structures. On the other hand, in the silver-rich system, difficulty in interpreting the experimental results can arise because oxidation seems to be present and to provoke the apparent silver segregation. Similar to our work, the second study also used EDS to characterize the chemical ordering69 and reported Au surface segregation. However, the results were obtained only with one nanoparticle that exhibited equal amounts of gold and silver (Ag0.51Au0.49).In the present study, while we consistently observed gold segregation, we did not manage to generate silver-rich nanoparticles using our experimental approach and it is therefore difficult to be assertive that gold segregation remains in the whole composition range of the alloy. However, our machine-learning assisted simulations predict that Au would segregate even for Ag-rich compositions. While further experimental studies are required to confirm these trends, we posit that these predictions can be rationalized by combining a literature review of the numerical simulations along with additional calculations, as discussed below. Indeed, the gold segregation at the surface, even for silver-rich nanoparticles, might appear counterintuitive at first sight because it is not found in all experiments, and because it is in contradiction with the surface energy hierarchy (γ(Ag) is slightly lower than γ(Au)) and with the atomic size (Ag is slightly bigger than Au). Furthermore, silver surface segregation was consistently found in simulations when using empirical force fields.70,71,73,74,102 However, in this context, the simplicity of the employed empirical force fields when compared to our MLIP may lead to inaccurate modeling. In particular, in the work of Paz-Borbón et al.,73 the Gupta potential seemed at first to demonstrate silver segregation but when further optimization was made at the DFT level, the authors found that gold segregation was favored instead. Similarly, we tested an embedded-atom model (EAM) which was used in the recent paper of Moreira et al.102 and demonstrated that it leads to much more energetic nanoparticles when exhibiting silver surface segregation [see ESI J†].
Meanwhile, all ofthe DFT studies also showed the gold segregation both for extended surfaces or for nanoparticles up to a few hundred atoms.73,75–80 As an explanation, it has been shown from electronic structural investigations that the segregation of the Au atoms at the surface, regardless of the composition, is caused by electrostatic forces rather than the surface energy. In order to confirm this hypothesis, we performed single-point DFT calculations initialized with the 250-atom nanoparticles found with our freezing simulations and computed the Bader charges. In Fig. 5(a), the total charge on the different layers from the center of the NP (index 1) to the surface of the NP (index 4) are shown for the three compositions. It is interesting to note that the surface is always negatively charged and the subsurface is positively charged, by the same magnitude in all the studied chemical compositions. The charge distribution on the different atom types is depicted in Fig. 5(b–d) as color maps and in Fig. 5(e–g) as histograms of averaged values taken over atoms in the different layers. A significant charge transfer from Ag atoms to Au atoms is thus observed with Au and Ag atoms being always respectively negatively and positively charged. A striking observation is that the charge transfer is more observed for the silver-rich nanoparticles. Indeed, in the Au0.25Ag0.75 nanoparticles (Fig. 5(b) and (e)), a small number of surface Au atoms bear a negative charge of ≈−0.3e whereas the Au atoms at the Au0.75Ag0.25 nanoparticles surface carry a much lower average charge of ≈−0.1e (Fig. 5(d) and (g)). Overall, the total charge of the surface layer remains the same for all the studied compositions but it is carried by a few but highly charged Au atoms in Au0.25Ag0.75 nanoparticles and by many but less charged Au atoms in Au0.75Ag0.25 nanoparticles. These results show that the same effects observed in previous DFT studies on small clusters are also present in larger nanoparticles obtained in our own machine-learning based simulations. They also show that charge transfer between Ag and Au always yields the same surface charge irrespective of the alloy composition. We therefore hypothesize that, as Au atoms become negatively charged when alloyed with silver, they will tend to move towards the surface due to Coulomb repulsion. Furthermore, because the nanoparticle's surfaces then become negatively charged, positively charged Ag atoms are attracted to the subsurface. As the charge transfer from Ag atoms to Au atoms is more pronounced for Ag-rich compositions, the segregation of gold at the surface will be favored even for such compositions, over that of the majority species, as could be intuitively expected. We note that, even if it did not explicitly take into account the atomic charges, the DNP model as it was fitted to DFT calculations was still able to remarkably translate such complex charge transfer mechanisms into the corresponding changes in forces.
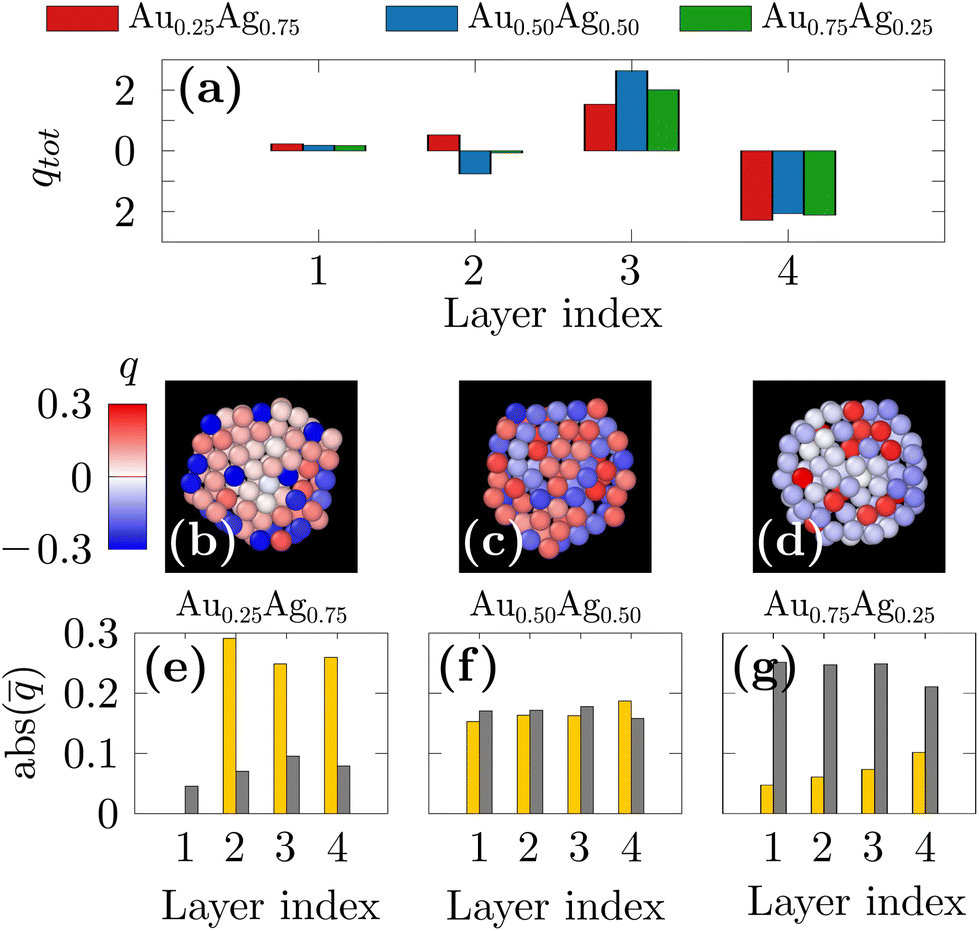 | ||
| Fig. 5 (a) The total Bader charge distribution averaged over the three nanoparticles per chemical composition. (b–d) Slices of typical nanoparticles where atoms are colored following the Bader charges. (e–g) The absolute value of the Bader charge distribution per atomic species averaged over three nanoparticles per chemical composition. We note that the charges are always negative for gold and positive for silver and that only the nanoparticles made of 250 atoms were studied because of the large computational costs associated with DFT calculations. | ||
5. Conclusion
The main goal of this work was to study the formation of AgAu nanoalloys. Our results in terms of experimental synthesis in the gas phase produced two remarkable observations. First, we found five-fold symmetric particles, including both an icosahedron and decahedron with nanoparticles of diameters up to 10 nm. Second, while surface oxidation can induce silver segregation, only gold segregation was observed in our synthesis results that were obtained under vacuum conditions. These experimental findings were first confirmed by machine-learning assisted simulations. Then, we further explored the chemical phase space by reaching different chemical compositions and confirming the gold segregation and the stability of the five-fold symmetric morphology, even in silver-rich systems. We emphasize that in contrast to previous works using classical interaction potentials, the use of MLIP to provide quantum accurate modeling was the key to reproduce the gold surface segregation. An additional advantage of our simulation approach was that we managed to explore the crystallization dynamics that required large-scale simulations with unprecedented chemical accuracy and found that gold surface segregation occurs before crystal ordering and leads to better crystallization in silver-rich composition.By showing that gold surface segregation can be observed under vacuum while silver surface segregation is usually found under more reactive conditions, our study highlights the importance of environmental effects on the chemical distribution of species in a bi-metallic nanoparticle. It also demonstrates the need to study nanoparticles using advanced experimental observations to be able to harness these effects. Furthermore, our results show the importance of taking into account electronic structural effects in nanoalloys, which are impossible to reproduce with conventional empirical potentials. To this end, we demonstrate the tremendous power of MLIP-type potentials for studies of this kind, making it possible to combine the modeling of nucleation processes in realistically-sized systems with DFT precision calculations.
Conflicts of interest
There are no conflicts to declare.Acknowledgements
This study was supported by the French National Research Agency (ANR) in the framework of its “Jeunes chercheuses et jeunes chercheurs” program, ANR-21-CE09-0006 and by the EUR grant NanoX n ANR-17-EURE-0009 in the framework of the “Programme des Investissements d'Avenir”. Computational resources have been provided by CALMIP, by Jean Zay and by TGCC. WAS and CA acknowledge support through the U.S. National Science Foundation (Award No. CSSI-2003808). Computational support was provided in part by the University of Pittsburgh Center for Research Computing through the resources provided on the H2P cluster, which is supported by NSF (Award No. OAC-2117681).References
- D. Alloyeau, C. Mottet and C. Ricolleau, Nanoalloys: Synthesis, Structure and Properties, Springer London Ltd, London, England, UK, 2012 Search PubMed.
- F. Calvo, Nanoalloys, Elsevier, Walthm, MA, USA, 2020 Search PubMed.
- R. Ferrando, Structure and Properties of Nanoalloys, Elsevier, Walthm, MA, USA, 2016 Search PubMed.
- R. Ferrando, J. Jellinek and R. L. Johnston, Chem. Rev., 2008, 108, 845–910 CrossRef CAS PubMed.
- J. Penuelas, P. Andreazza, C. Andreazza-Vignolle, H. C. N. Tolentino, M. De Santis and C. Mottet, Phys. Rev. Lett., 2008, 100, 115502 CrossRef CAS PubMed.
- V. Amendola, S. Scaramuzza, S. Agnoli, S. Polizzi and M. Meneghetti, Nanoscale, 2014, 6, 1423–1433 RSC.
- Z. Swiatkowska-Warkocka, A. Pyatenko, F. Krok, B. R. Jany and M. Marszalek, Sci. Rep., 2015, 5, 1–6 Search PubMed.
- N. Ahmad, M. Bon, D. Passerone and R. Erni, ACS Nano, 2019, 11, 13333–13342 CrossRef PubMed.
- P. Benzo, S. Combettes, B. Pecassou, N. Combe, M. Benoit, M. Respaud and M. J. Casanove, Phys. Rev. Mater., 2019, 3, 096001 CrossRef CAS.
- Y. Wang, W. Nong, N. Gong, T. Salim, M. Luo, T. L. Tan, K. Hippalgaonkar, Z. Liu and Y. Huang, Small, 2022, 18, 2203340 CrossRef CAS PubMed.
- J. van der Hoeven, T. A. J. Welling, T. A. G. Silva, J. E. van den Reijen, C. La Fontaine, X. Carrier, C. Louis, A. van Blaaderen and P. E. de Jongh, ACS Nano, 2018, 12, 8467–8476 CrossRef CAS PubMed.
- Y. Liu and C. Z. Huang, ACS Nano, 2013, 7, 11026–11034 CrossRef CAS PubMed.
- P. Carrillo, R. Shi, K. Teeluck, S. D. Senanayake and M. G. White, ACS Catal., 2018, 8, 7279–7286 CrossRef CAS.
- J. Ramade, C. Langlois, M. Pellarin, L. Piccolo, M.-A. Lebeault, T. Epicier, M. Aouine and E. Cottancin, Nanoscale, 2017, 9, 13563–13574 RSC.
- S. F. L. Mertens, M. Gara, A. S. Sologubenko, J. Mayer, S. Szidat, K. W. Krämer, T. Jacob, D. J. Schiffrin and T. Wandlowski, Adv. Funct. Mater., 2011, 21, 3259–3267 CrossRef CAS.
- X. Chen, S. Zhang, C. Li, Z. Liu, X. Sun, S. Cheng, D. N. Zakharov, S. Hwang, Y. Zhu, J. Fang, G. Wang and G. Zhou, Proc. Natl. Acad. Sci. U. S. A., 2022, 119, e2117899119 CrossRef CAS PubMed.
- N. Ahmad, G. Wang, J. Nelayah, C. Ricolleau and D. Alloyeau, J. Microsc., 2018, 269, 127–133 CrossRef CAS PubMed.
- E. Goudeli and S. E. Pratsinis, ACS Nano, 2017, 11, 11653–11660 CrossRef CAS PubMed.
- D. Nelli, A. Krishnadas, R. Ferrando and C. Minnai, J. Phys. Chem. C, 2020, 124, 14338–14349 CrossRef CAS.
- D. Nelli and R. Ferrando, Nanoscale, 2019, 11, 13040–13050 RSC.
- G. D. Förster, M. Benoit and J. Lam, Phys. Chem. Chem. Phys., 2019, 21, 22774–22781 RSC.
- A. Hizi, G. D. Forster, R. Ferrando, Y. Garreau, A. Coati, C. Andreazza-Vignolle and P. Andreazza, Faraday Discuss., 2023, 242, 35–51 RSC.
- F. Chen and R. L. Johnston, ACS Nano, 2008, 2, 165–175 CrossRef CAS PubMed.
- I. Demiroglu, Z. Y. Li, L. Piccolo and R. L. Johnston, Catal. Sci. Technol., 2016, 6, 6916–6931 RSC.
- G. Barcaro, A. Fortunelli, M. Polak and L. Rubinovich, Nano Lett., 2011, 11, 1766–1769 CrossRef CAS PubMed.
- T. L. Tan, L.-L. Wang, D. D. Johnson and K. Bai, Nano Lett., 2012, 12, 4875–4880 CrossRef CAS PubMed.
- J. B. A. Davis, S. L. Horswell and R. L. Johnston, J. Phys. Chem. A, 2014, 118, 208–214 CrossRef CAS PubMed.
- P. Wisesa, C. M. Andolina and W. A. Saidi, J. Phys. Chem. Lett., 2022, 14, 468–475 CrossRef PubMed.
- B. Wang, W. Chu, Y. Wu, D. Casanova, W. A. Saidi and O. V. Prezhdo, J. Phys. Chem. Lett., 2022, 25, 5946–5952 CrossRef PubMed.
- C. M. Andolina, P. Williamson and W. A. Saidi, J. Chem. Phys., 2020, 152, 154701 CrossRef CAS PubMed.
- C. M. Andolina, J. G. Wright, N. Das and W. A. Saidi, Phys. Rev. Mater., 2021, 5, 083804 CrossRef CAS.
- D. Bayerl, C. M. Andolina, S. Dwaraknath and W. A. Saidi, Digital Discovery, 2022, 1, 61–69 RSC.
- L. C. Erhard, J. Rohrer, K. Albe and V. L. Deringer, npj Comput. Mater., 2022, 8, 1–12 CrossRef.
- F. Mocanu, K. Konstantinou, T. H. Lee, N. Bernstein, V. L. Deringer, G. Csányi and S. R. Elliott, J. Phys. Chem. B, 2018, 122, 8998–9006 CrossRef CAS PubMed.
- T. E. Gartner, P. M. Piaggi, R. Car, A. Z. Panagiotopoulos and P. G. Debenedetti, Phys. Rev. Lett., 2022, 129, 255702 CrossRef PubMed.
- P. M. Piaggi, J. Weis, A. Z. Panagiotopoulos, P. G. Debenedetti and R. Car, Proc. Natl. Acad. Sci. U. S. A., 2022, 119, e2207294119 CrossRef CAS PubMed.
- E. Panizon, J. A. Olmos-Asar, M. Peressi and R. Ferrando, Phys. Chem. Chem. Phys., 2015, 17, 28068–28075 RSC.
- M. Benoit, J. Amodeo, S. Combettes, I. Khaled, A. Roux and J. Lam, Mach. Learn.: Sci. Technol., 2020, 2, 025003 Search PubMed.
- G. Tallec, G. Laurens, O. Fresse-Colson and J. Lam, Quantum Chemistry in the Age of Machine Learning, Elsevier, Walthm, MA, USA, 2023, pp. 253–277 Search PubMed.
- G. Laurens, M. Rabary, J. Lam, D. Peláez and A.-R. Allouche, Theor. Chem. Acc., 2021, 140, 1–12 Search PubMed.
- J. Goniakowski, S. Menon, G. Laurens and J. Lam, J. Phys. Chem. C, 2022, 126, 17456–17469 CrossRef CAS.
- J. Lam, S. Abdul-Al and A.-R. Allouche, J. Chem. Theory Comput., 2020, 16, 1681–1689 CrossRef CAS PubMed.
- M. A. Caro, V. L. Deringer, J. Koskinen, T. Laurila and G. Csányi, Phys. Rev. Lett., 2018, 120, 166101 CrossRef CAS PubMed.
- V. L. Deringer and G. Csányi, Phys. Rev. B, 2017, 95, 094203 CrossRef.
- Y.-C. Tsao, S. Rej, C.-Y. Chiu and M. H. Huang, J. Am. Chem. Soc., 2014, 136, 396–404 CrossRef CAS PubMed.
- A. G. M. da Silva, T. S. Rodrigues, V. G. Correia, T. V. Alves, R. S. Alves, R. A. Ando, F. R. Ornellas, J. Wang, L. H. Andrade and P. H. C. Camargo, Angew. Chem., Int. Ed., 2016, 55, 7111–7115 CrossRef CAS PubMed.
- M. B. Newmai, M. Verma, A. Dahiya and P. S. Kumar, J. Phys. Chem. Solids, 2022, 161, 110371 CrossRef CAS.
- C. Han, X. Yang, G. Gao, J. Wang, H. Lu, J. Liu, M. Tong and X. Liang, Green Chem., 2014, 16, 3603–3615 RSC.
- E. Urzúa, F. Gonzalez-Torres, V. Beltrán, P. Barrias, S. Bonardd, A. M. R. Ramírez and M. Ahumada, Nanoscale Adv., 2022, 4, 4789–4797 RSC.
- Q. Li, F. Lu, H. Ye, K. Yu, B. Lu, R. Bao, Y. Xiao, F. Dai and G. Lan, ACS Sustainable Chem. Eng., 2018, 6, 9813–9821 CrossRef CAS.
- P. Velmurugan, V. Mohanavel, P. Sekar, S. Vijayanand, A. Chinnathambi, C. Govindasamy and S. Sivakumar, Mater. Lett., 2022, 310, 131471 CrossRef CAS.
- J. D. Padmos, M. Langman, K. MacDonald, P. Comeau, Z. Yang, M. Filiaggi and P. Zhang, J. Phys. Chem. C, 2015, 119, 7472–7482 CrossRef CAS.
- X. Ding, P. Yuan, N. Gao, H. Zhu, Y. Y. Yang and Q.-H. Xu, Nanomedicine, 2017, 13, 297–305 CrossRef CAS PubMed.
- A. S. Barnard, N. P. Young, A. I. Kirkland, M. A. van Huis and H. Xu, ACS Nano, 2009, 3, 1431–1436 CrossRef CAS PubMed.
- Z. W. Wang and R. E. Palmer, Phys. Rev. Lett., 2012, 108, 245502 CrossRef CAS PubMed.
- D. Pohl, A. Surrey, L. Schultz and B. Rellinghaus, Appl. Phys. Lett., 2012, 101, 263105 CrossRef.
- T.-W. Liao, A. Yadav, K.-J. Hu, J. van der Tol, S. Cosentino, F. D'Acapito, R. E. Palmer, C. Lenardi, R. Ferrando, D. Grandjean and P. Lievens, Nanoscale, 2018, 10, 6684–6694 RSC.
- D. Belić, R. L. Chantry, Z. Y. Li and S. A. Brown, Appl. Phys. Lett., 2011, 99, 171914 CrossRef.
- G. Casillas, J. J. Velázquez-Salazar and M. Jose-Yacaman, J. Phys. Chem. C, 2012, 116, 8844–8848 CrossRef CAS PubMed.
- A. L. Garden, A. Pedersen and H. Jónsson, Nanoscale, 2018, 10, 5124–5132 RSC.
- B. Wang, M. Liu, Y. Wang and X. Chen, J. Phys. Chem. C, 2011, 115, 11374–11381 CrossRef CAS.
- A. V. Myshlyavtsev, P. V. Stishenko and A. I. Svalova, Phys. Chem. Chem. Phys., 2017, 19, 17895–17903 RSC.
- F. Baletto, C. Mottet and R. Ferrando, Phys. Rev. B: Condens. Matter Mater. Phys., 2001, 63, 155408 CrossRef.
- F. Baletto, R. Ferrando, A. Fortunelli, F. Montalenti and C. Mottet, J. Chem. Phys., 2002, 116, 3856–3863 CrossRef CAS.
- C.-W. Yen, M.-L. Lin, A. Wang, S.-A. Chen, J.-M. Chen and C.-Y. Mou, J. Phys. Chem. C, 2009, 113, 17831–17839 CrossRef CAS.
- S. Liao, Z. Luo, J. B. Metternich, R. Zenobi and F. Stellacci, Nanoscale, 2020, 12, 22639–22644 RSC.
- G. Guisbiers, R. Mendoza-Cruz, L. Bazán-Díaz, J. J. Velázquez-Salazar, R. Mendoza-Perez, J. A. Robledo-Torres, J.-L. Rodriguez-Lopez, J. M. Montejano-Carrizales, R. L. Whetten and M. José-Yacamán, ACS Nano, 2016, 10, 188–198 CrossRef CAS PubMed.
- F. Stein, S. Kohsakowski, R. Martinez-Hincapie, S. Reichenberger, C. Rehbock, V. Colic, D. Guay and S. Barcikowski, Faraday Discuss., 2022, 242, 301–325 RSC.
- L. Martínez, M. Díaz, E. Román, M. Ruano, D. Llamosa, D. Llamosa and Y. Huttel, Langmuir, 2012, 28, 11241–11249 CrossRef PubMed.
- X. He, S.-E. Zhang, F. Cheng and Z.-X. Chen, Chem. Commun., 2018, 54, 638–641 RSC.
- R. Du, S. Tang, X. Wu, Y. Xu, R. Chen and T. Liu, R. Soc. Open Sci., 2019, 6, 190342 CrossRef CAS PubMed.
- M. Bon, N. Ahmad, R. Erni and D. Passerone, J. Chem. Phys., 2019, 151, 064105 CrossRef.
- L. O. Paz-Borbón, R. L. Johnston, G. Barcaro and A. Fortunelli, J. Chem. Phys., 2008, 128, 134517 CrossRef PubMed.
- L. Deng, W. Hu, H. Deng, S. Xiao and J. Tang, J. Phys. Chem. C, 2011, 115, 11355–11363 CrossRef CAS.
- M. Cerbelaud, R. Ferrando, G. Barcaro and A. Fortunelli, Phys. Chem. Chem. Phys., 2011, 13, 10232–10240 RSC.
- F. Chen and R. L. Johnston, Acta Mater., 2008, 56, 2374–2380 CrossRef CAS.
- S. Hoppe and S. Müller, J. Appl. Phys., 2017, 122, 235303 CrossRef.
- D. Rapetti and R. Ferrando, J. Alloys Compd., 2019, 779, 582–589 CrossRef CAS.
- Y. Wang, L. Zhang, B. Xu, X. Wang and H. Wang, Model. Simul. Mater. Sci. Eng., 2021, 30, 025003 CrossRef.
- A. L. Gould, C. J. Heard, A. J. Logsdail and C. R. A. Catlow, Phys. Chem. Chem. Phys., 2014, 16, 21049–21061 RSC.
- Y. Huttel, Gas-Phase Synthesis of Nanoparticles, 2017 Search PubMed.
- C. M. Andolina, M. Bon, D. Passerone and W. A. Saidi, J. Phys. Chem. C, 2021, 125, 17438–17447 CrossRef CAS.
- L. Zhang, J. Han, H. Wang, W. A. Saidi, R. Car and E. Weinan, arXiv, 2018, arXiv:1805.09003, DOI:10.48550/arXiv.1805.09003.
- H. Wang, L. Zhang, J. Han and W. E, Comput. Phys. Commun., 2018, 228, 178–184 CrossRef CAS.
- G. Kresse and J. Hafner, Phys. Rev. B: Condens. Matter Mater. Phys., 1993, 47, 558–561 CrossRef CAS PubMed.
- G. Kresse and J. Furthmüller, Comput. Mater. Sci., 1996, 6, 15–50 CrossRef CAS.
- G. Kresse and J. Furthmüller, Phys. Rev. B: Condens. Matter Mater. Phys., 1996, 54, 11169–11186 CrossRef CAS PubMed.
- J. P. Perdew, K. Burke and M. Ernzerhof, Phys. Rev. Lett., 1996, 77, 3865–3868 CrossRef CAS PubMed.
- G. Kresse and D. Joubert, Phys. Rev. B: Condens. Matter Mater. Phys., 1999, 59, 1758–1775 CrossRef CAS.
- J. Amodeo, F. Pietrucci and J. Lam, J. Phys. Chem. Lett., 2020, 11, 8060–8066 CrossRef CAS PubMed.
- M. Snellman, N. Eom, M. Ek, M. E. Messing and K. Deppert, Nanoscale Adv., 2021, 3, 3041–3052 RSC.
- D. Nelli, E. Y. El Koraychy, M. Cerbelaud, B. Crespin, A. Videcoq, A. Giacomello and R. Ferrando, ACS Nano, 2023, 17, 587–596 CrossRef CAS PubMed.
- J. Goniakowski and C. Mottet, Phys. Rev. B: Condens. Matter Mater. Phys., 2010, 81, 155443 CrossRef.
- D. M. Wells, G. Rossi, R. Ferrando and R. E. Palmer, Nanoscale, 2015, 7, 6498–6503 RSC.
- Y. Xia, D. Nelli, R. Ferrando, J. Yuan and Z. Y. Li, Nat. Commun., 2021, 12, 1–8 CrossRef PubMed.
- A. Stukowski, Model. Simul. Mater. Sci. Eng., 2009, 18, 015012 CrossRef.
- A. Stukowski, Model. Simul. Mater. Sci. Eng., 2012, 20, 045021 CrossRef.
- P.-A. Buffat, M. Flüeli, R. Spycher, P. Stadelmann and J.-P. Borel, Faraday Discuss., 1991, 92, 173–187 RSC.
- M. Settem, M. Islam and A. K. Kanjarla, Comput. Mater. Sci., 2018, 148, 266–271 CrossRef CAS.
- C. Roncaglia, D. Rapetti and R. Ferrando, Phys. Chem. Chem. Phys., 2021, 23, 23325–23335 RSC.
- C. Langlois, Z. L. Li, J. Yuan, D. Alloyeau, J. Nelayah, D. Bochicchio, R. Ferrando and C. Ricolleau, Nanoscale, 2012, 4, 3381–3388 RSC.
- M. Moreira, L. C. Felix, E. Cottancin, M. Pellarin, D. Ugarte, M. Hillenkamp, D. S. Galvao and V. Rodrigues, J. Phys. Chem. C, 2023, 127, 1944–1954 CrossRef CAS.
Footnote |
| † Electronic supplementary information (ESI) available. See DOI: https://doi.org/10.1039/d3nr04471h |
| This journal is © The Royal Society of Chemistry 2024 |