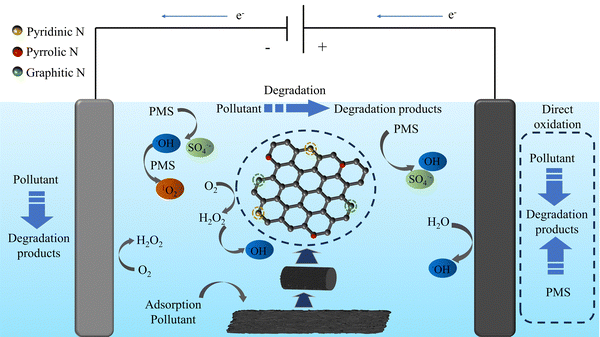
Three-dimensional N-doped carbon electrodes activate peroxymonosulfate for tetracycline degradation†
Jieyu
Zhao
ab and
Yonggang
Zhang
 *ab
*ab
aState Key Laboratory of Separation Membranes and Membrane Processes, Tiangong University, Tianjin 300387, China. E-mail: zhangyonggang1895@163.com
bSchool of Environmental Science and Engineering, Tiangong University, Tianjin 300387, China
First published on 22nd November 2023
Abstract
Transition metal-based materials have been widely used as catalysts in both electrochemical oxidation (E) and peroxomonosulfate (PMS) processes to degrade pollutants in water. However, agglomeration of catalyst particles and leaching of metal ions hinder their practical application in pollutant decomposition. In this study, a novel N-doped carbon material (CPANI/CF) was prepared as a three-dimensional electrode by using low-cost synthesised polyaniline-loaded carbon felt as a precursor to improve the electrochemical oxidation capability and capacity to activate PMS in the electrochemical oxidation process. The constructed three-dimensional electrocatalytic system (E–PMS–CPANI/CF) achieved 90.59% TC degradation within 40 min, and the system still removed more than 80% of TC after repeating the experiment for five cycles. We investigated how different experimental conditions (such as the carbonation temperature of CPANI/CF electrode, voltage, PMS dosage and initial pH) affect the degradation of TC. Through quenching experiments, chemical probe experiments and electron spin resonance (ESR) analyses, we discovered that the 3D electrocatalytic system produced single-linear oxygen (1O2), hydroxyl radical (˙OH) and sulphate radical (SO4˙−), which could effectively degrade the pollutants. The results of this study provide a useful strategy for efficient and cost-effective wastewater treatment.
1 Introduction
Over the past few years, antibiotics have been extensively utilized in both human and veterinary medicine to prevent and treat diseases through their ability to interfere with or eliminate microorganisms.1,2 Tetracycline (TC) is the most commonly used antibiotic in animal husbandry. High concentrations of TC are frequently detected in aquatic environments due to its low uptake by animals.3 However, TC is toxic and persistent, and if not handled properly, it can seriously damage the ecological environment and endanger human health. Therefore, developing a highly efficient, inexpensive, simple and environmentally friendly method to remove TC from water is necessary.4Conventional wastewater treatment methods (e.g., biological, physical, chemical, etc.) are inefficient in removing tetracycline from water. Researchers prefer advanced oxidation technologies (AOPs) because they are practical, energy-efficient, environmentally friendly and cost-effective. Electrochemical oxidation technology is a new type of oxidation technology that uses reactive oxygen species (ROS) during chemical reactions to oxidise and degrade pollutants. Although two-dimensional electrochemical oxidation technology (2D-E) for wastewater degradation is operationally simple and low-cost, its shortcomings, such as low mass transfer rate, high electrode consumption, and high energy consumption, limit the wide range of applications of 2D-E technology in industry.5 Three-dimensional electrochemical oxidation technology (3D-E) is revised on the basis of 2D-E technology by filling particle electrodes between the cathode and the anode, so that the particle electrodes form many microelectrodes under the action of an electric field. Under the influence of an electric field, the particle electrodes form many microelectrodes. This increases the reaction area and improves the mass transfer efficiency of the E system. 3D-E technology demonstrates superior electrochemical and electrocatalytic performances compared to traditional 2D-E technology.6
Peroxymonosulfate (PMS) oxidation is an advanced oxidation technology, which decomposes difficult-to-degrade organic pollutants into CO2, H2O and other low-toxicity intermediates by generating ROS (˙OH, SO4˙−, 1O2, etc.).7 In general, PMS can be activated by electrocatalysis, photocatalysis and metal catalysis.8–11 Using metal-based materials to activate PMS offers a low-cost and highly effective catalytic performance, but metal ions are inevitably precipitated during the activation of persulfate with metal-based materials, resulting in secondary fouling.12 In contrast, carbon-based catalysts are advantageous due to their high chemical stability, low cost and absence of secondary pollution during PMS activation.9,12–15 According to the report, doping nitrogen atoms into the carbon matrix during the preparation process significantly improves the catalytic performance of electrode materials.16–18 The most commonly used method for the synthesis of N-doped carbon electrodes is to introduce an external N source (melamine, ammonium nitrate and urea, etc.) followed by high-temperature annealing, which can be an effective way to synthesize N-doped carbon electrode materials, but it is a cumbersome process, with a small amount of added N that is not sufficiently stable.19 Another method is to prepare N-doped carbon electrodes by carbonising the N-rich precursor. N-doped carbon electrode materials derived from polyaniline have been widely used in practice. Still, most of them are discretely distributed in the form of powder, which may result in catalyst build-up that is not easy to recycle if applied to electrocatalytic systems.20–22 Accordingly, it's imperative to create a novel form of N-doped carbon electrode. Currently, N-doped carbon electrodes are usually prepared by coating the catalyst powder with an added binder on the carrier.23,24 This method not only decreases the electrode's catalytic properties but can also cause environmental pollution if the material falls off in the process of use.25 Polyaniline (PANI), which can be synthesised in situ on a carrier, can solve the above problems.
In summary, we propose the synergistic system of E–PMS–CPANI/CF. In this paper, the carrier material is carbon felt (CF). PANI was polymerized in situ on the CF surface without using a binder, and high-temperature carbonisation was carried out in an N2 atmosphere to prepare CPANI/CF as a 3D electrode to improve the electrochemical oxidation capability and capacity to activate PMS in the 3D-E process. The proposed E–PMS–CPANI/CF synergistic system is an efficient, low-cost and sustainable wastewater treatment technology. The specific research procedure is as follows: (i) we used scanning electron microscopy (SEM), X-ray photoelectron spectroscopy (XPS), Brunauer–Emmett–Teller (BET), an X-ray Diffractometer (XRD) and Fourier transform infrared spectrometry (FTIR) to characterise the 3D electrodes. (ii) We researched the effects of voltage, carbonation temperature, pH and PMS addition on the electrode's electrocatalytic performance. The results of this study can provide insights into optimizing these parameters to enhance electrocatalytic performance. (iii) We used electron spin resonance (ESR) to test for the possible presence of ROS in different systems, and investigated the role of ROS in the system through radical quenching experiments and chemical probe experiments, and to investigate the mechanism of tetracycline degradation using the E–PMS–CPANI/CF process.
2 Materials and methods
2.1 Reagents and materials
CF was purchased from Tianjin Carbon Factory (Tianjin, China), ammonium persulfate (APS), aniline (ANI), concentrated hydrochloric acid (36–38% HCl), tetracycline (C22H24N2O8), potassium iodide (KI), peroxymonosulfate (PMS), anhydrous ethanol (EtOH), sodium sulphate (Na2SO4), sodium hydroxide (NaOH), sulfuric acid (H2SO4), 1,10-phenanthroline5,5dimethyl-1-pyrroline N-oxide (DMPO), sodium bicarbonate (NaHCO3), ethanol (EtOH), phenol, coumarin, benzoic acid (BA), p-hydroxybenzoic acid (p-HBA), 1,3-diphenylisobenzofuran (DPBF), potassium titanium oxide oxalate dihydrate (C4K2O9Ti·H2O), furfuryl alcohol (C5H6O2) and tert-butanol (TBA) were bought from Sinopharm Chemical Reagent Co. Ltd (S, China).2.2 Synthesis of CPANI/CF
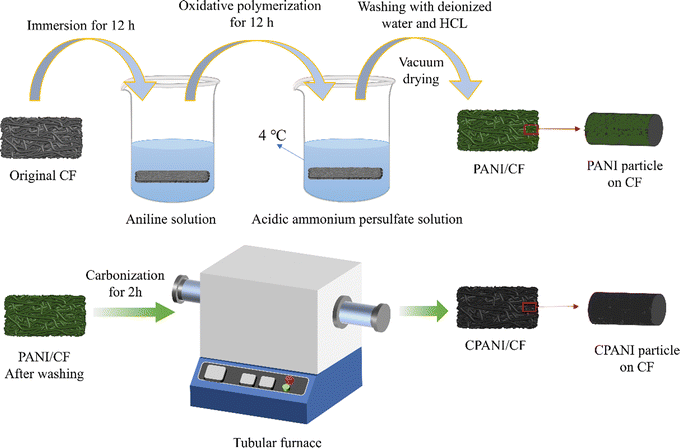
Firstly, start by cleaning a 2 cm × 4 cm × 0.2 cm CF block with 1 M HCl, ethanol, and deionized (DI) water to eliminate impurities and organic matter from its surface, then place the sample into a vacuum at 65 °C for 12 hours to dry.The synthesis steps of CPANI/CF electrode materials are shown in Fig. 1. Solution A was prepared by dissolving 0.9 mL of aniline monomer in 30 mL of 1 M HCL and stirring the mixture. Similarly, Solution B was prepared by dissolving 0.4 g of APS in 30 mL of 1 M HCL and stirring it well. CF was impregnated through ultrasonic mixing in solution A for 0.5 h and then impregnated for 12 h. Then it was taken out of solution A and added to solution B. The mixture was mixed for 30 seconds, then it was polymerised at 4 °C for 9 h. After the sample was washed with 1 M HCl and DI water sequentially, it was dried in a vacuum oven at 65 °C for 24 hours to obtain PANI/CF. The N-doped carbon electrode (CPANI/CF) was made by carbonising the above obtained PANI/CF in a tube furnace kept at a temperature of 700 °C for 2 hours under a N2 atmosphere.
2.3 Experimental procedure
During the experiment, various devices were used, including a cathode plate, an anode plate, a magnetic stirrer, an electrolysis tank and a direct current (DC) power supply (Fig. S1, ESI†). The electrolysis tank had a volume of 200 mL and was made of glass, the anode plate was constructed from graphite while the cathode plate was constructed from titanium. The cathode and anode had an effective working area of 12.5 cm2 and were positioned parallel to each other within the reactor. Additionally, a three-dimensional electrode, CPANI/CF, was placed between the cathode and anode. Set the contaminant concentration in the system to 50 mg L−1. The process was performed using an electrolyte of 0.05 mol L−1 Na2SO4, pH = 3, plate spacing of 6 cm, voltage of 5 V, and magnetic stirrer speed of 2000 rpm for 40 min. The samples were taken at specific times, and the solution that needed testing was filtered through a membrane with a pore size of 0.45 μm. The UV spectrophotometer was used to measure the concentration of pollutants at 360 nm. All experiments used three parallel samples.2.4 Characterisation
Scanning electron microscopy (SEM, Hitachi S4800) was used to observe the surface morphology of the electrodes. The composition of the electrodes was analyzed using X-ray photoelectron spectroscopy (XPS, NEXSA). The electrodes were tested for their purity and crystalline form using X-ray diffraction (XRD, D8 Discover). Functional groups on the 3D electrode surface were analysed using Fourier Transform Infrared Spectroscopy (FTIR, Nicolet iS50). 3D electrodes were subjected to analysis of their specific surface area and pore size by the fully automated physicochemical adsorption tester (BET, Autosorb-iQ-C). The active substances were identified using electron spin resonance (ESR, FA20). Pollutant concentrations were determined using a UV spectrophotometer.2.5 Analytical methods
Eqn (1) was used to calculate the energy consumption required for removing pollutant. | (1) |
The first order rate constant for TC degradation is determined according to equation eqn (2).26
 | (2) |
The degradation contributions of ˙OH, SO4˙− and 1O2 could be determined by eqn (3)–(5).27,28
 | (3) |
 | (4) |
 | (5) |
3. Results and discussion
3.1 Characterisation of the 3D electrode
In Fig. 2, the characterisation of the surface morphology of CF, PANI/CF and CPANI/CF electrodes using SEM is shown. The surface of CF before modification is smooth in Fig. 2(a). Whereas, in Fig. 2(b), the modified CF is relatively coarse. Fig. 2(c) shows that the polyaniline was uniformly covered on the surface of CF, and the polyaniline is a typical short rod structure. In Fig. 2(d)–(f), CPANI/CF was obtained after carbonisation, and the surface morphology changed from the original short and thick rod-like structure to a thin and long fibre-like one, forming an interconnected and cross-linked fibre porous network, and the macroscopic voids of CPANI/CF were widened. The calcination process likely caused the formation of micropores on the CPANI/CF due to the escape of large amounts of N2 and O2, which improved the electrode's surface area, adsorption capacity, and active sites for the reaction. When the carbonization temperature increased to 800°, the material structure collapsed, resulting in a partial buildup of material (Fig. 2(f)).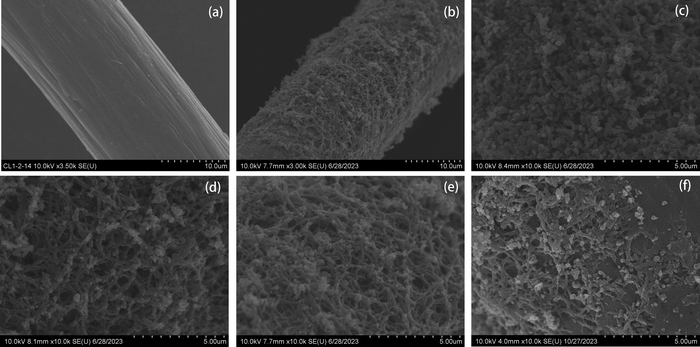 | ||
| Fig. 2 SEM images of the 3D electrode: (a) CF, (b) CPANI/CF-700, (c) PANI/CF, (d) CPANI/CF-600, (e) CPANI/CF-700, and (f) CPANI/CF-800. | ||
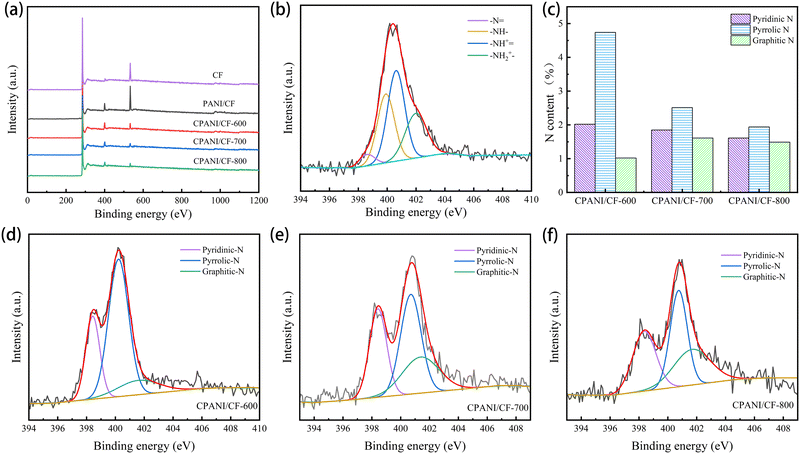
The elemental composition and chemical properties of CF, PANI/CF and CPANI/CF-t electrodes were analysed by XPS. As shown in Fig. 3(a), CF is primarily composed of O and C elements, PANI/CF and CPANI/CF-t consist mainly of C, N and O elements. This shows that the obvious N 1s signal of PANI/CF originated from polyaniline polymerised on the CF surface in Fig. 3(b), and the four typical peaks were located at 398.6 eV, 399.8 eV, 400.6 eV and 401.9 eV representing quinoid imine (–N![[double bond, length as m-dash]](https://www.rsc.org/images/entities/char_e001.gif) ), benzoid amine (–NH–), doped amine (–NH+
), benzoid amine (–NH–), doped amine (–NH+![[double bond, length as m-dash]](https://www.rsc.org/images/entities/char_e001.gif) ) and doped imine species (–NH2+–),29,30 confirming the successful polymerisation of polyaniline on CF.19 An obvious N 1s signal appeared in CPANI/CF-t (Fig. 3(d)–(f)), and the three characteristic peaks were located at 398.6 eV, 400.4 eV, and 401.6 eV, corresponding to pyridinic N, pyrrolic N and graphitic N, respectively, indicating the successful doping of carbon fiber surfaces with N.31,32 The relative atomic contents of N and O in the CPANI/CF electrodes gradually decreased with increasing carbonisation temperature, and the N content decreased from 7.79% (CPANI/CF-600) to 5.03% (CPANI/CF-800) (Table 1), which might be due to the C–N bond breaking when the carbonisation temperature is too high. The graphitic N content increased from 0.49% (CPANI/CF-600) to 1.41% (CPANI/CF-700) (Fig. 3(c)), and these changes could be attributed to the transformation of pyridine N into more heat-resistant graphitic N and nitric oxide during calcination.15,33 Studies have demonstrated that the high energy levels of graphitic N and pyridine N have a significant impact on boosting the catalytic activity of electrode materials.34
) and doped imine species (–NH2+–),29,30 confirming the successful polymerisation of polyaniline on CF.19 An obvious N 1s signal appeared in CPANI/CF-t (Fig. 3(d)–(f)), and the three characteristic peaks were located at 398.6 eV, 400.4 eV, and 401.6 eV, corresponding to pyridinic N, pyrrolic N and graphitic N, respectively, indicating the successful doping of carbon fiber surfaces with N.31,32 The relative atomic contents of N and O in the CPANI/CF electrodes gradually decreased with increasing carbonisation temperature, and the N content decreased from 7.79% (CPANI/CF-600) to 5.03% (CPANI/CF-800) (Table 1), which might be due to the C–N bond breaking when the carbonisation temperature is too high. The graphitic N content increased from 0.49% (CPANI/CF-600) to 1.41% (CPANI/CF-700) (Fig. 3(c)), and these changes could be attributed to the transformation of pyridine N into more heat-resistant graphitic N and nitric oxide during calcination.15,33 Studies have demonstrated that the high energy levels of graphitic N and pyridine N have a significant impact on boosting the catalytic activity of electrode materials.34
| Samples | C% | N% | O% |
N
nitrogen![[thin space (1/6-em)]](https://www.rsc.org/images/entities/char_2009.gif) species/Atomtotal (%) species/Atomtotal (%) |
||
|---|---|---|---|---|---|---|
| Pyridinic N | Pyrrolic N | Graphitic N | ||||
| CF | 84.34 | — | 15.65 | — | — | — |
| PANI/CF | 69.27 | 9.44 | 21.31 | — | — | — |
| CPANI/CF-600 | 82.29 | 7.79 | 4.92 | 2.02 | 4.74 | 1.02 |
| CPANI/CF-700 | 89.38 | 5.97 | 4.66 | 1.85 | 2.51 | 1.61 |
| CPANI/CF-800 | 91.96 | 5.03 | 3.01 | 1.61 | 1.94 | 1.49 |
The N2 adsorption–desorption isothermal curves were obtained through BET analysis, and the BJH method was employed to examine the distribution patterns of pore size. The pore size distribution curves demonstrated that CPANI/CF electrodes have a mesoporous structure, and the average pore size ranges from 3.408 to 3.412 nm in Fig. 4(a). The specific surface area increased from 35.194 m2 g−1 (CPANI/CF-600) to 39.753 m2 g−1 (CPANI/CF-700) with the increase of carbonation temperature. The specific surface area of the CPANI/CF electrode gradually decreased when the carbonisation temperature continued to increase, and the specific surface area of CPANI/CF-800 was only 27.506 m2 g−1 (Fig. 4(b)). The reason for this may be that the material architecture collapses when the carbonisation temperature is too high, leading to partial build-up of the material, and the specific surface area no longer increases. Similarly, the pore volume of CPANI/CF-600, CPANI/CF-700 and CPANI/CF-800 electrodes were 0.027 cm3 g−1, 0.032 cm3 g−1 and 0.017 cm3 g−1 (Table 2). The larger specific surface area and pore volume of the CPANI/CF-700 electrode provided more active sites for the degradation of TC,35 which improved the electrocatalytic performance of the 3D electrode.
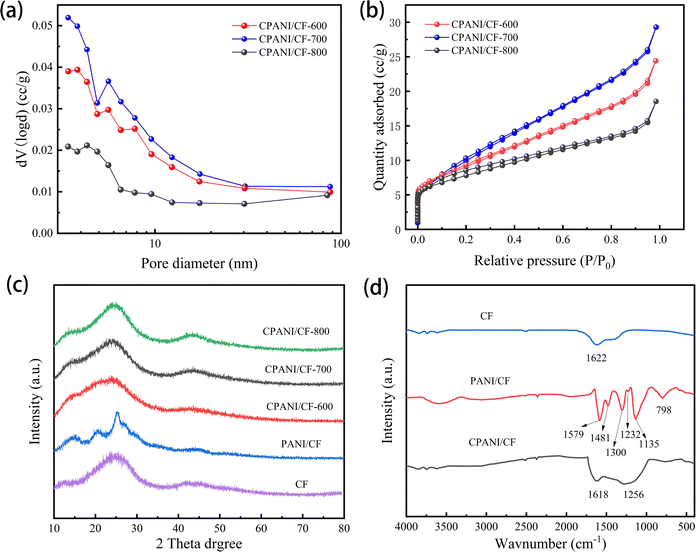 | ||
| Fig. 4 (a) Pore size distributions of CPANI/CF-t, (b) N2 adsorption–desorption isotherms, (c) XRD patterns and (d) FTIR spectra of CF, PANI/CF and CPANI/CF. | ||
| Samples | Surface area (m2 g−1) | Pore volume (cm3 g−1) | Pore diameter (nm) |
|---|---|---|---|
| CPANI/CF-600 | 35.194 | 0.027 | 3.412 |
| CPANI/CF-700 | 39.753 | 0.032 | 3.409 |
| CPANI/CF-800 | 27.506 | 0.017 | 3.408 |
The CF, PANI/CF and CPANI/CF electrode materials were characterised using XRD. In Fig. 4(c), PANI/CF has three sharp crystalline planes at 15°, 20.5° and 25.1°, which are attributed to the (011), (020) and (200) crystalline planes of polyaniline, indicating the successful synthesis of polyaniline. CF and CPANI/CF have three sharp crystalline planes at 25° and 44.1° only, which can be attributed to the reflections of graphite planes (002) and (100). In the CPANI/CF samples, the crystal planes (011), (020) and (200) of PANI disappeared. These results indicate the successful synthesis of CPANI/CF by in situ polymerisation and high temperature carbonation, and the results of XRD and XPS analyses show that CPANI/CF electrode materials have great purity and crystallinity.
The functional groups on the electrode surface were analysed using FTIR with IR spectra ranging from 400 cm−1 to 4000 cm−1 in Fig. 4(d). The characteristic peaks of PANI/CF appeared at 1579 cm−1 (quinonoid (Q) ring stretching), 1481 cm−1 (benzenoid (B) ring stretching), 1300 cm−1 (CN– stretching), and 1232 cm−1 (CN+– stretching), and the peaks at 1135 cm−1 and 798 cm−1 may be related to the aromatic ring C–H.36 It is noteworthy that the characteristic peaks of polyaniline disappeared after carbonation of PANI/CF, which suggests that carbonation can break the chemical bond of polyaniline and form a new structure, and only two characteristic peaks are present in CPANI/CF, which appeared at 1537 cm−1 (ring-stretching in conjugated heterocyclic aromatic) and 1256 cm−1 (C–N stretching vibration in conjugated heterocyclic aromatic), which indicates the successful preparation of N-doped carbon in the CPANI/CF electrode.37
3.2 Performance of different processes
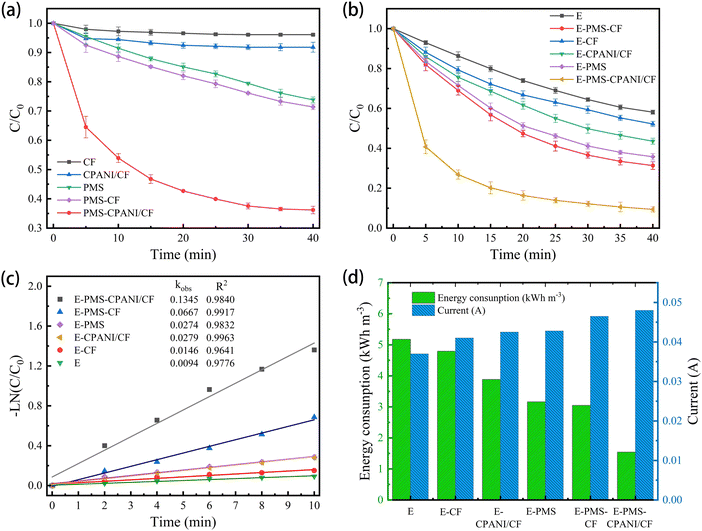
In Fig. 5(b), the removal rate (C/C0) of TC in various systems is illustrated. The removal of TC by E, E–CF and E–CPANI/CF systems was 41.91%, 47.97% and 45.45%, respectively, at pH = 3, voltage of 5 V, plate spacing of 6 cm, 0.05 M Na2SO4, and 3 mM PMS. This indicates that TC can be removed through direct and indirect oxidation in the E system. The introduction of CF and CPANI/CF as three-dimensional electrodes can shorten the cathode–anode distance, increase the current density, and improve the mass transfer effect. The removal rates of TC by the E–PMS, E–PMS–CF and E–PMS–CPANI/CF systems are 64.24%, 69.33% and 90.59% respectively, indicating that PMS can be electrically activated. Furthermore, the degradation rate of E–PMS–CPANI/CF for TC was increased by 48.64% and 26.35% respectively, compared with that of the traditional E and E–PMS. As shown in Fig. 5(c), the removal rates of TC by E, c, E–PMS, E–CPANI/CF, E–PMS–CF and E–PMS–CPANI/CF processes within the first 10 min conformed to first-order kinetics with kobs of 0.0094 min−1, 0.0146 min−1, 0.0274 min−1, 0.0279 min−1, 0.0667 min−1 and 0.1345 min−1. The kobs of the E–PMS–CPANI/CF system are 10.21 and 6.05 times higher than that of E and E–PMS respectively, indicating that the E–PMS–CPANI/CF system has significant advantages in pollutant degradation.
Combined with Fig. 5(d), it is evident that adding CF, CPANI/CF and PMS to the E system increased the current in the system to different degrees. This indicates that PMS not only plays the role of oxidising pollutants, but also acts as an electrolyte. The participation of CF and CPANI/CF electrodes shortened the cathode–anode distance and improved the electrocatalytic performance of the system.39 The energy consumptions of the catalytic systems of E, E–CF, E–CPANI/CF, E–PMS, E–PMS–CF and E–PMS–CPANI/CF were 5.17, 4.79, 3.88, 3.16, 3.04 and 1.54 kW h m−3, respectively. By introducing the CPANI/CF electrode, the energy consumption of the system decreased and the catalytic effect improved, demonstrating the superiority of the E–PMS–CPANI/CF system for removing TC.
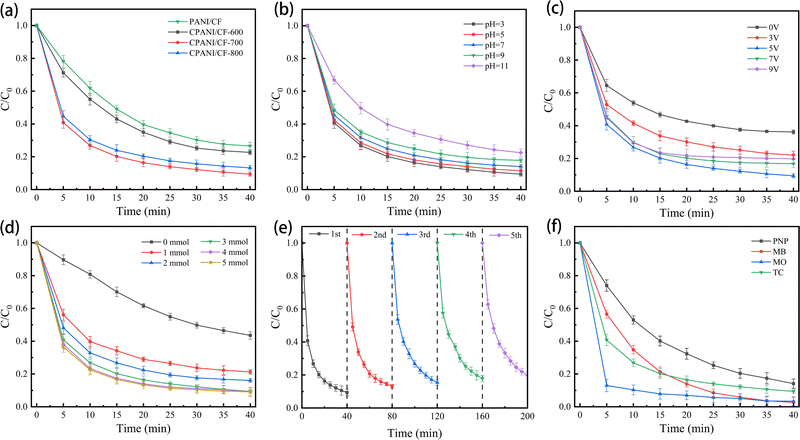
Typically, real wastewater is alkaline or acidic, therefore, it is important to develop an electrode material that is resistant to acidity or alkalinity.39 As shown in Fig. 6(b), we investigated the effect of the E–PMS–CPANI/CF process on TC degradation at initial pH values of 3.0, 5.0, 7.0, 9.0, and 11.0, respectively. Satisfactorily, the removal rate of TC in the E–PMS–CPANI/CF system was 90.59%, 88.02% and 85.52% within 40 min of the system when the pH in the system was 3.0, 5.0 and 7.0, respectively. The results indicated that the E–PMS–CPANI/CF system was effective in removing TC from water under both acidic and neutral conditions. As the pH levels increased to 11.0, the removal rate of TC by the E–PMS–CPANI/CF system gradually decreased to 77.46%. Hydroxyl groups in alkaline solutions can break down PMS into SO42−, reducing ROS levels in the solution.41 An initial pH of 3.0 was selected for the subsequent batch experiments based on the results above.
When undergoing electrochemical oxidation, the strength of the applied voltage plays a significant role. In Fig. 6(c), it is demonstrated that after 40 minutes without a DC power supply, the E–PMS–CPANI/CF system achieved a 63.82% removal of TC. This result indicates that the CPANI/CF electrodes can activate PMS independently. Whereas when the voltage was 3 V, 5 V, 7 V and 9 V, the removal rates of TC were 77.93%, 90.59%, 83.22% and 80.22%. When the intensity of the applied voltage in the system is lower than 5 V, the bonding energy generated by the TC chemical bond breaking may not be reached.42 The removal rate of TC decreases significantly when the applied voltage is greater than 5 V. Higher current densities may lead to increased short-circuit and bypass currents, and side reactions such as the evolution reaction of the anode and hydrogen evolution reaction of the cathode may be intensified, inhibiting the removal of TC.43 Given the above results, the applied voltage of 5 V was selected for the subsequent batch experiments.
The concentration of PMS is also significant in the electrochemical oxidation system. In Fig. 6(d), when the system did not have PMS added, the 3D-E system only removed 56.45% of TC. When 1 mmol L−1, 2 mmol L−1, 3 mmol L−1, 4 mmol L−1 and 5 mmol L−1 of PMS were added to the E–PMS–CPANI system, the removal rates of TC by the process were 78.75%, 83.83%, 90.59%, 90.81% and 90.91%, respectively. The degradation rate of TC gradually increased with higher PMS concentrations, however, there was no significant change in the degradation effect of TC when the PMS concentration increased to 5 mmol L−1. There are two reasons for this phenomenon: (1) with a moderate increase in PMS concentration, more ROS will be present in the 3D electrocatalytic system, which is beneficial to pollutant degradation.44 (2) When the concentration of PMS is too high, it will consume ˙OH and SO4˙−, resulting in a decrease in active substances.45,46 For comprehensive consideration, the PMS dosage was selected to be 3 mmol L−1.
3.3 Reaction mechanism
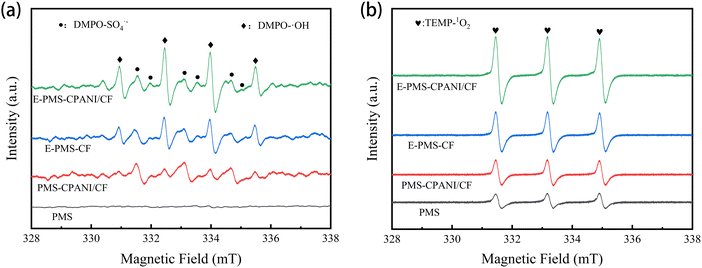
Possible ROS in the E–PMS–CPANI/CF system were identified using an electron spin resonance (ESR) test. Using DMPO as ˙OH and SO4˙− radical trapping agents, in Fig. 7(a), the ESR spectrum of the E–PMS–CPANI/CF system showed a DMPO–˙OH four-peak signals (1![[thin space (1/6-em)]](https://www.rsc.org/images/entities/char_2009.gif) :
:![[thin space (1/6-em)]](https://www.rsc.org/images/entities/char_2009.gif) 2
2![[thin space (1/6-em)]](https://www.rsc.org/images/entities/char_2009.gif) :2
:2![[thin space (1/6-em)]](https://www.rsc.org/images/entities/char_2009.gif) :
:![[thin space (1/6-em)]](https://www.rsc.org/images/entities/char_2009.gif) 1) and A DMPO–SO4˙− six-peak signals (1
1) and A DMPO–SO4˙− six-peak signals (1![[thin space (1/6-em)]](https://www.rsc.org/images/entities/char_2009.gif) :
:![[thin space (1/6-em)]](https://www.rsc.org/images/entities/char_2009.gif) 1
1![[thin space (1/6-em)]](https://www.rsc.org/images/entities/char_2009.gif) :
:![[thin space (1/6-em)]](https://www.rsc.org/images/entities/char_2009.gif) 1
1![[thin space (1/6-em)]](https://www.rsc.org/images/entities/char_2009.gif) :
:![[thin space (1/6-em)]](https://www.rsc.org/images/entities/char_2009.gif) 1
1![[thin space (1/6-em)]](https://www.rsc.org/images/entities/char_2009.gif) :
:![[thin space (1/6-em)]](https://www.rsc.org/images/entities/char_2009.gif) 1
1![[thin space (1/6-em)]](https://www.rsc.org/images/entities/char_2009.gif) :
:![[thin space (1/6-em)]](https://www.rsc.org/images/entities/char_2009.gif) 1
1![[thin space (1/6-em)]](https://www.rsc.org/images/entities/char_2009.gif) :
:![[thin space (1/6-em)]](https://www.rsc.org/images/entities/char_2009.gif) 1
1![[thin space (1/6-em)]](https://www.rsc.org/images/entities/char_2009.gif) :
:![[thin space (1/6-em)]](https://www.rsc.org/images/entities/char_2009.gif) 1),47 and the corresponding signals also appeared in the pairs of E–PMS–CF system and PMS–CPANI/CF system, but the intensities of the characteristic peaks were significantly lower than the E–PMS–CPANI/CF system. In contrast, no significant signal was observed in the PMS system. The results confirm the presence of ˙OH and SO4˙− in E–PMS–CPANI/CF, E–PMS and PMS–CPANI/CF systems, and the near absence of ˙OH and SO4˙− in the PMS system. Using TEMP as the 1O2 radical trapping agent, in Fig. 7(b), the characteristic three-peak signal (1
1),47 and the corresponding signals also appeared in the pairs of E–PMS–CF system and PMS–CPANI/CF system, but the intensities of the characteristic peaks were significantly lower than the E–PMS–CPANI/CF system. In contrast, no significant signal was observed in the PMS system. The results confirm the presence of ˙OH and SO4˙− in E–PMS–CPANI/CF, E–PMS and PMS–CPANI/CF systems, and the near absence of ˙OH and SO4˙− in the PMS system. Using TEMP as the 1O2 radical trapping agent, in Fig. 7(b), the characteristic three-peak signal (1![[thin space (1/6-em)]](https://www.rsc.org/images/entities/char_2009.gif) :
:![[thin space (1/6-em)]](https://www.rsc.org/images/entities/char_2009.gif) 1
1![[thin space (1/6-em)]](https://www.rsc.org/images/entities/char_2009.gif) :
:![[thin space (1/6-em)]](https://www.rsc.org/images/entities/char_2009.gif) 1) of TEMP–1O2 appeared in the ESR spectrum of the E–PMS–CPANI/CF system,48 and the characteristic peak intensity signal was significantly higher in the system compared to the other systems, which indicated that a large amount of 1O2 existed in the E–PMS–CPANI/CF process.
1) of TEMP–1O2 appeared in the ESR spectrum of the E–PMS–CPANI/CF system,48 and the characteristic peak intensity signal was significantly higher in the system compared to the other systems, which indicated that a large amount of 1O2 existed in the E–PMS–CPANI/CF process.
In Fig. 8(a), the impact of ROS on the E–PMS–CPANI/CF system was further investigated through free radical quenching experiments. tert-Butanol (TBA,  , k˙OH = 6.0 × 10⁸ M−1 s−1), ethanol (EtOH,
  , k˙OH = (1.6–7.7) × 107 M−1 s−1) and furfuryl alcohol (FFA, k1O2 = 1.2 × 10⁸ M−1 s−1, k˙OH = 1.5 × 10¹⁰ M−1 s−1) were added to the E–PMS–CPANI/CF system to determine the impact of the ROS (˙OH, SO4˙− and 1O2) in the E–PMS–CPANI/CF system on the TC removal rate, and phenol was added to determine the production of active substances on the electrode surface. In Fig. 8(a), the E–PMS–CPANI/CF process removed 90.59% of TC within 40 min without adding any quencher, which decreased to 76.99%, 71.95% and 25.75% with the addition of TBA, EtOH and FFA quenchers. The detected free radicals were further analysed by probe experiments. As in Fig. 8(b), the ˙OH in the system was indirectly detected using the production of hydroxycoumarin, the reaction product of coumarin with ˙OH, and SO4˙− in the system was indirectly detected using the production of p-benzoquinone (p-BQ), the main by-product of the reaction of p-hydroxybenzoic acid (p-HBA) with SO4˙−. As shown in Fig. 8(c), the concentration of 1O2 was calculated from the degradation rate of DPBF using 1,3-diphenylisobenzofuran (DPBF) as a chemical probe. The contributions of ˙OH, SO4˙− and 1O2 to the degradation of TC by the E–PMS–CPANI/CF system were 33.14%, 12.90% and 46.04%, respectively, with 1O2 playing a dominant role in the degradation process. After adding phenol to the system, the removal of TC by the system decreased to 46.35%, indicating that most of the reaction occurred on the electrode surface.
4. Conclusion
In summarize, a nitrogen-doped three-dimensional electrode was synthesised using low-cost polyaniline-loaded carbon mats as precursors. The SEM showed that the polyaniline was successfully loaded on the surface of the carbon felt without the addition of binder, and the consistent results of XPS, XRD and FTIR proved the successful preparation of the nitrogen-doped carbon electrode, and the BET analysis showed that CPANI/CF-700 had a large specific surface area and pore volume. Compared with other systems, the E–PMS–CPANI/CF system has excellent removal efficiency and lower energy consumption for the pollutants, and the degradation mechanism was investigated and found that the ROS (˙OH, SO4˙− and 1O2) generated during the electrocatalytic process is a crucial factor in the removal of the pollutants, in which 1O2 plays a dominant role. The E–PMS–CPANI/CF system also showed excellent degradation of typical industrial wastewaters, such as NOR (norfloxacin), PNP (p-nitrophenol), MO (methyl orange) and MB (methylene blue), with certain stability and recyclability, which is of practical significance in wastewater treatment.Conflicts of interest
There are no conflicts to declare.References
- S. Leong, D. Li, K. Hapgood, X. W. Zhang and H. T. Wang, Appl. Catal., B, 2016, 198, 224–233 CrossRef CAS.
- J. L. Xie, L. Chen, X. Luo, L. Huang, S. Y. Li and X. B. Gong, Sep. Purif. Technol., 2022, 281, 12 CrossRef.
- R. Xu, J. J. Xiong, D. Liu, Y. R. Wang and Y. A. Ming, J. Colloid Interface Sci., 2022, 625, 397–404 CrossRef CAS PubMed.
- D. Y. Chen, Q. Bai, T. T. Ma, X. F. Jing, Y. Y. Tian, R. Zhao and G. S. Zhu, Chem. Eng. J., 2022, 435, 11 Search PubMed.
- B. Shen, X. H. Wen and X. Huang, Chem. Eng. J., 2017, 327, 597–607 CrossRef CAS.
- K. Zhao and Y. G. Zhang, Sep. Purif. Technol., 2023, 308, 11 Search PubMed.
- H. V. Lutze, S. Bircher, I. Rapp, N. Kerlin, R. Bakkour, M. Geisler, C. von Sonntag and T. C. Schmidt, Environ. Sci. Technol., 2015, 49, 1673–1680 CrossRef CAS.
- S. S. Zhu, X. C. Huang, F. Ma, L. Wang, X. G. Duan and S. B. Wang, Environ. Sci. Technol., 2018, 52, 8649–8658 CrossRef CAS.
- J. L. Wang and S. Z. Wang, Chem. Eng. J., 2018, 334, 1502–1517 CrossRef CAS.
- C. D. Qi, X. T. Liu, J. Ma, C. Y. Lin, X. W. Li and H. J. Zhang, Chemosphere, 2016, 151, 280–288 CrossRef CAS.
- X. Cheng, H. G. Guo, Y. L. Zhang, G. V. Korshin and B. Yang, Water Res., 2019, 157, 406–414 CrossRef CAS PubMed.
- M. X. Cheng, Y. C. Zhang, B. Lai, L. Z. Wang, S. J. Yang, K. L. Li, D. Q. Wang, Y. G. Wu, G. H. Chen and J. Qian, Chem. Eng. J., 2023, 455, 17 CrossRef.
- D. K. Yoo, H. J. An, N. A. Khan, G. T. Hwang and S. H. Jhung, Chem. Eng. J., 2018, 352, 71–78 CrossRef CAS.
- R. Silva, D. Voiry, M. Chhowalla and T. Asefa, J. Am. Chem. Soc., 2013, 135, 7823–7826 CrossRef CAS.
- P. D. Hu, H. R. Su, Z. Y. Chen, C. Y. Yu, Q. L. Li, B. X. Zhou, P. J. J. Alvarez and M. C. Long, Environ. Sci. Technol., 2017, 51, 11288–11296 CrossRef CAS PubMed.
- X. G. Duan, Z. M. Ao, D. G. Li, H. Q. Sun, L. Zhou, A. Suvorova, M. Saunders, G. X. Wang and S. B. Wang, Carbon, 2016, 103, 404–411 CrossRef CAS.
- Y. W. Gao, T. Li, Y. Zhu, Z. H. Chen, J. Y. Liang, Q. Y. Zeng, L. Lyu and C. Hu, J. Hazard. Mater., 2020, 393, 10 Search PubMed.
- W. C. Peng, S. Z. Liu, H. Q. Sun, Y. J. Yao, L. J. Zhi and S. B. Wang, J. Mater. Chem. A, 2013, 1, 5854–5859 RSC.
- T. G. Ma, M. J. Liu, T. T. Li, H. J. Ren and R. Zhou, Sep. Purif. Technol., 2022, 293, 11 Search PubMed.
- W. Zhou, L. Rajic, Y. W. Zhao, J. H. Gao, Y. K. Qin and A. N. Alshawabkeh, Electrochim. Acta, 2018, 277, 185–196 CrossRef CAS.
- D. T. Yue, X. F. Qian, M. Kan, M. Y. Fang, J. P. Jia, X. D. Yang and Y. X. Zhao, Appl. Catal., B, 2018, 229, 211–217 CrossRef CAS.
- N. Barhoumi, H. Olvera-Vargas, N. Oturan, D. Huguenot, A. Gadri, S. Ammar, E. Brillas and M. A. Oturan, Appl. Catal., B, 2017, 209, 637–647 CrossRef CAS.
- J. Y. Feng and Y. G. Zhang, New J. Chem., 2020, 44, 16584–16593 RSC.
- Y. M. Zhang, Z. Chen, P. P. Wu, Y. X. Duan, L. C. Zhou, Y. X. Lai, F. Wang and S. Li, J. Hazard. Mater., 2020, 393, 10 Search PubMed.
- X. F. Huang and Y. G. Zhang, J. Iran. Chem. Soc., 2021, 18, 1913–1925 CrossRef CAS.
- H. Z. Wu, Z. Z. Hu, R. H. Liang, O. V. Nkwachukwu, O. A. Arotiba and M. H. Zhou, Appl. Catal., B, 2023, 321, 13 Search PubMed.
- J. J. Cai, M. H. Zhou, X. D. Du and X. Xu, Sep. Purif. Technol., 2021, 254, 11 CrossRef.
- M. X. Yang, Z. X. Hou, X. Zhang, B. Y. Gao, Y. W. Li, Y. A. Shang, Q. Y. Yue, X. G. Duan and X. Xu, Environ. Sci. Technol., 2022, 11, DOI:10.1021/acs.est.2c01261.
- Z. Tong, Y. Yang, J. Wang, J. Zhao, B. L. Su and Y. Li, J. Mater. Chem. A, 2014, 2, 4642–4651 RSC.
- H. M. Zhang, Q. Zhao, S. P. Zhou, N. J. Liu, X. H. Wang, J. Li and F. S. Wang, J. Power Sources, 2011, 196, 10484–10489 CrossRef CAS.
- X. G. Duan, H. Q. Sun, Y. X. Wang, J. Kang and S. B. Wang, ACS Catal., 2015, 5, 553–559 CrossRef CAS.
- G. L. Sun, L. Y. Ma, J. B. Ran, B. Li, X. Y. Shen and H. Tong, Electrochim. Acta, 2016, 194, 168–178 CrossRef CAS.
- X. L. Li, H. L. Wang, J. T. Robinson, H. Sanchez, G. Diankov and H. J. Dai, J. Am. Chem. Soc., 2009, 131, 15939–15944 CrossRef CAS.
- Y. Wang, Y. Lin, C. P. Yang, S. H. Wu, X. T. Fu and X. Li, Chem. Eng. J., 2023, 451 DOI:10.1016/j.cej.2022.138468.
- S. Dutta, A. Bhaumik and K. C. W. Wu, Energy Environ. Sci., 2014, 7, 3574–3592 RSC.
- J. B. Yin, X. A. Xia, L. Q. Xiang and X. P. Zhao, Carbon, 2011, 49, 739 CrossRef CAS.
- C. Z. Kuang, G. S. Zeng, Y. J. Zhou, Y. Y. Wu, D. X. Li, Y. F. Wang and C. H. Li, Water Res., 2023, 229, 11 CrossRef.
- Z. H. Chen, L. B. Yang, X. W. Luo, D. L. Xie, C. Zhao, R. L. Qiu and Z. J. Huang, Sep. Purif. Technol., 2022, 296, 11 Search PubMed.
- K. Zhao and Y. G. Zhang, Sep. Purif. Technol., 2023, 308 DOI:10.1016/j.seppur.2022.122962.
- W. Ren, L. L. Xiong, G. Nie, H. Zhang, X. G. Duan and S. B. Wang, Environ. Sci. Technol., 2020, 54, 1267–1275 CrossRef CAS.
- D. H. Ding, S. J. Yang, L. W. Chen and T. M. Cai, Chem. Eng. J., 2020, 392, 11 CrossRef.
- C. Zhang, F. Li, R. B. Wen, H. K. Zhang, P. Elumalai, Q. Zheng, H. Y. Chen, Y. J. Yang, M. Z. Huang and G. G. Ying, Water Res., 2020, 182, 12 CrossRef PubMed.
- K. Zhao and Y. G. Zhang, J. Chem. Technol. Biotechnol., 2023, 98, 940–948 CrossRef CAS.
- Y. H. Cui, X. D. Lv, J. X. Lei and Z. Q. Liu, Electrochim. Acta, 2017, 245, 193–202 CrossRef.
- Y. J. Wang and G. Yu, J. Hazard. Mater., 2022, 436, 18 Search PubMed.
- L. Xu, B. R. Fu, Y. Sun, P. K. Jin, X. Bai, X. Jin, X. Shi, Y. Wang and S. T. Nie, Chem. Eng. J., 2020, 400, 12 Search PubMed.
- F. R. Guo, K. J. Wang, J. H. Lu, J. C. Chen, X. W. Dong, D. S. Xia, A. Q. Zhang and Q. Wang, Chemosphere, 2019, 218, 1071–1081 CrossRef CAS PubMed.
- Y. Wang, Y. H. Liu, K. Wang, S. Q. Song, P. Tsiakaras and H. Liu, Appl. Catal., B, 2015, 165, 360–368 CrossRef CAS.
- S. J. Jiang, Z. Li, H. Y. Wang, Y. Wang, L. N. Meng and S. Q. Song, Nanoscale, 2014, 6, 14262–14269 RSC.
- P. Su, M. H. Zhou, X. Y. Lu, W. L. Yang, G. B. Ren and J. J. Cai, Appl. Catal., B, 2019, 245, 583–595 CrossRef CAS.
- P. Liang, C. Zhang, X. G. Duan, H. Q. Sun, S. M. Liu, M. O. Tade and S. B. Wang, Environ. Sci.: Nano, 2017, 4, 315–324 RSC.
- W. J. Ma, N. Wang, Y. A. Fan, T. Z. Tong, X. J. Han and Y. C. Du, Chem. Eng. J., 2018, 336, 721–731 CrossRef CAS.
- S. H. Wu, C. P. Yang, Y. Lin and J. J. Cheng, J. Environ. Sci., 2022, 115, 330–340 CrossRef CAS PubMed.
- X. Chen, W. D. Oh, Z. T. Hu, Y. M. Sun, R. D. Webster, S. Z. Li and T. T. Lim, Appl. Catal., B, 2018, 225, 243–257 CrossRef CAS.
Footnote |
| † Electronic supplementary information (ESI) available. See DOI: https://doi.org/10.1039/d3nj04311h |
| This journal is © The Royal Society of Chemistry and the Centre National de la Recherche Scientifique 2024 |

