A self-assembled nanoprobe based on Schiff base for the rapid and selective detection of serum albumin with cell imaging applications†
Dolan
Moni
a,
Mihir
Sasmal
 a,
Abu Saleh Musha
Islam
 b,
Ananya
Dutta
a,
Debjani
Maiti
a,
Rousunara
Khatun
ac,
Atul
Katarkar
d and
Mahammad
Ali
 *a
*a
aDepartment of Chemistry Jadavpur University, Kolkata 700 032, India. E-mail: m_ali2062@yahoo.com; mali@chemistry.jdvu.ac.in; Fax: 91-33-2414-6223
bSchool of Chemical Sciences, Indian Association for the Cultivation of Science, 2A & 2B Raja S. C. Mullick Road, Kolkata 700032, India
cAliah University, ll-A/27, Action Area II, Newtown, Action Area II, Kolkata, West Bengal 700160, India
dDepartment of Biochemistry, University of Lausanne, Ch. des Boveresses 155, Epalinges 1066, Switzerland
First published on 24th November 2023
Abstract
Here, we report the design and synthesis of a Schiff base probe, DBNHC ((E)-2-(2,4-dihydroxybenzylidene)-N-(naphthalen-1-yl)hydrazine-1-carbothioamide), and its interaction with bovine serum albumin (BSA). In ∼100% PBS buffer, the probe DBNHC can self-assemble into nonfluorescent nanoaggregates due to the aggregation caused quenching (ACQ) effect. However, it becomes highly fluorescent (∼14 fold) in the presence of BSA which facilitates the disassembly of nanoaggregates into its monomer. The site-selective fluorescence displacement assay and molecular docking simulations reveal that mainly hydrogen bonding, π⋯sulphur and π⋯alkyl interactions are responsible for the disassembly of nanoaggregates leading to encapsulation of DBNHC monomer at site II in BSA, resulting in a cyan green emission. The detection limit determined by the 3σ/slope method was found to be 58 nM, and the lower dissociation constant [Kd = (1.506 ± 0.196) μM] value suggests strong binding between the probe and BSA. Further, DBNHC was used for cell incubation and in vitro fluorescence imaging of BSA.
Introduction
Serum albumin is the most abundant protein in blood plasma, maintaining the oncotic pressure of plasma and fluid transport in the body, and also possesses some antioxidant properties.1,2 Besides this, serum albumin displays an extraordinary ligand-binding capacity, providing a depot and carrier for many endogenous and exogenous compounds.3–5 The extent of serum albumin in blood is an indicator of the nutritional status of an organism.6–10 Both abundance and deficiency of serum albumin in blood compared to the normal range (35–50 g L−1) lead to harmful diseases in the human body.11,12 The increasing level of serum albumin may result from heart and kidney diseases,13–15 and the decreasing level of serum albumin may be due to edema or shock.16–18 Thus, developing an efficient method for the quantitative detection of serum albumin is a serious issue.Different methods like the biuret method, Kjeldahl method, BCA (bicinchoninic acid) method, Lowry method, light scattering technique, electrochemical impedance spectroscopy, capillary electrophoresis, fluorescence spectroscopy, etc. have been used for the recognition of bovine serum albumin.19–23 Most of them suffer from one or more disadvantages like complicated and time-consuming processes and poor reproducibility.23–26 However, the fluorescence technique has drawn much attention for protein sensing27–35 due to its high sensitivity, high spatiotemporal resolution, non-invasiveness, and potential applications in living cells.36,37 Recently, it has been shown that self-assembly based nanoprobes have displayed some distinct advantages for protein sensing because of their high photostability, biocompatibility, flexibility in chemical design and fine-tuning of optical properties.38–40 For instance, a self-assembled probe exhibits no or very weak fluorescence due to the aggregation caused quenching (ACQ) effect, but when the probe responds to the target analytes by undergoing disassembly, it will emit strong fluorescence.41 However, a very few number of fluorescent probes have been reported for detection of proteins in virtue of different strategies including polymer nanoparticles38,42 or affinity ligand-based aggregate disassembly40,43–45 and metal nanoparticle displacement.46,47
Thus, keeping these things in mind, we have devoted our attention towards the synthesis of probe ((E)-2-(2,4-dihydroxybenzylidene)-N-(naphthalen-1-yl)hydrazine-1-carbothio-amide) (hereafter designated as DBNHC) that can easily self-assemble into nonfluorescent nanoaggregates in aqueous solution which can selectively bind with bovine serum albumin (BSA), facilitating the disassembly of nanoaggregates into monomers, exhibiting an observable turn-on cyan green fluorescent response towards BSA in biological environments. Some particular advantages of DBNHC may include the following: (i) the selective binding towards BSA favoured by the combination of disassembly induced emission and site-specific interaction; (ii) a very fast (∼11 s) fluorescence response toward BSA; (iii) a lower detection limit (58 nM), indicating high sensitivity; and (iv) finally, by considering the biological, pharmacological, antifungal and antitumor activities of thiosemicarbazone (TSC) and Schiff base derivatives,48–55 the probe may also find potential applications for live-cell imaging of BSA. In addition to the detailed morphological characterization, BSA site marker displacement studies, molecular docking, steady-state fluorescence and TCSPC were also conducted to visualise the operative sensing mechanism.
Results and discussion
The synthetic route of DBNHC is shown in Scheme 1, and the detailed synthetic procedures are described in the Experimental section. The characterization of the synthesized intermediate NHC and the final product DBNHC is presented in the ESI.†Photophysical behaviour of DBNHC in DMSO/PBS binary mixtures
Small organic molecules may undergo self-assembly via noncovalent interactions, leading to the formation of nanoaggregates, which can easily change their optical (absorbance and fluorescence) behavior.56 To prove the aggregation behaviour of DBNHC, the changes in the photophysical properties (absorbance and emission) of DBNHC were explored in DMSO/PBS binary mixtures (Fig. S9A and B, ESI†). In pure DMSO, DBNHC (5 μM) displayed an inherent absorption maximum at 349 nm and two humps in fluorescence emission spectra at 407 and 429 nm. With the gradual change in solvent composition from pure DMSO to PBS buffer (pH 7.4), the absorption maximum of DBNHC is blue-shifted from 349 to 337 nm (Fig. S9A, ESI†) along with a decrease in the absorbance value. Again, a significant decrease in emission intensity along with a broadening of the spectral pattern with an emission maximum at 457 nm in pure buffer was observed (Fig. S9B, ESI†). All the above spectral changes indicate the formation of nanoaggregates of DBNHC in PBS buffer through hydrophobic interactions among DBNHC molecules.57To further ascertain the self-assembly behaviour of DBNHC, a DLS experiment was performed with 5 μM DBNHC in ∼100% PBS buffer solution, which clearly exhibits the formation of nanoaggregates with an average diameter of ∼110 nm (Fig. 1A). In addition, TEM investigation of 5 μM DBNHC in ∼100% PBS also demonstrates the development of spherical nanoaggregates of DBNHC with an average diameter of ∼127 nm (Fig. 1B and C). The probe DBNHC (5 μM) is weakly fluorescent at 457 nm in ∼100% PBS buffer (pH 7.4) upon excitation at 355 nm (Fig. S9B, ESI†) due to the aggregation caused quenching (ACQ) effect.35,58,59
 | ||
| Fig. 1 (A) DLS analysis of DBNHC (5 μM) in ∼100% PBS buffer. (B) TEM image of DBNHC nanoparticles in ∼100% PBS buffer (scale bar: 200 nm). (C) The corresponding particle size distribution plot. | ||
Optical response of DBNHC towards BSA
To explore the optical response of DBNHC towards BSA, at first, we analyzed the absorption response of DBNHC both in the presence and in the absence of BSA. The UV-vis spectra of DBNHC (5 μM) displayed a well-defined absorption maximum at 337 nm, but upon gradual addition of BSA to DBNHC, there is a decrease in the absorbance value at 337 nm with a simultaneous increase in absorbance at 279 nm (Fig. 2). The decreased absorbance at 337 nm, even at low concentrations of BSA, indicates complexation between the probe DBNHC and BSA.60–62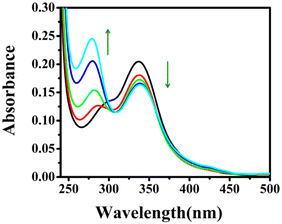 | ||
| Fig. 2 Absorption titration of DBNHC (5 μM) with gradual addition of BSA (0–39.38 μM) in ∼100% PBS buffer solution of pH 7.4. | ||
Besides this, the fluorescence experiment revealed that DBNHC (5 μM) is weakly fluorescent in PBS buffer (Φ = 0.00149) with the λem maximum at 457 nm. But, upon addition of BSA, DBNHC displayed a turn-on cyan green fluorescence (Φ = 0.01937) (Fig. 3). Then, to comprehend the fluorescence turn-on response of DBNHC in the presence of BSA, a quantitative assessment of the interaction is essential. Therefore, a fluorescence titration was carried out keeping [DBNHC] = 5 μM and incrementally adding BSA ranging from 0 to 39.38 μM in PBS buffer solution. The outcomes of the titration experiment revealed that the emission intensity of DBNHC was enhanced significantly (∼14-fold) upon addition of 39.38 μM BSA along with a simultaneous blue shift (∼7 nm) of the emission maximum from 457 to 450 nm (Fig. 3).
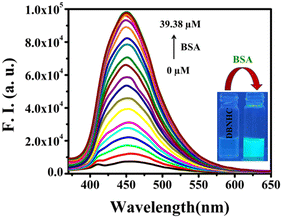 | ||
| Fig. 3 Fluorescence spectral changes of DBNHC (5 μM) in ∼100% PBS buffer of pH 7.4 upon successive addition of BSA. Inset: visual fluorescence changes of DBNHC with the addition of BSA. λex = 355 nm. | ||
From this fluorescence titration study, we have calculated the dissociation constant (Kd) between DBNHC and BSA by utilising the following equation:40
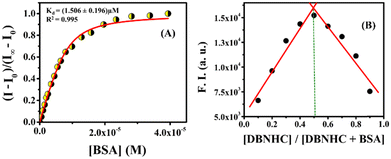
A plot of (I − I0)/(I∞ − I0) vs. [BSA] yields a nonlinear curve (Fig. 4A), which was solved by a nonlinear curve fitting approach to get the value of the dissociation constant, Kd = (1.506 ± 0.196) μM, indicating a strong binding affinity of the probe towards BSA. Moreover, the emission intensity of DBNHC at 450 nm displayed a good linear relationship with [BSA] within the range of 0–6.46 μM (Fig. S13, ESI†). The corresponding detection limit (LOD) was calculated to be 58 nM (3.85 mg L−1) using the 3σ/slope method63 (see the ESI†). Besides this, the stoichiometry of the interaction between BSA and DBNHC was determined by Job's method, which clearly indicates a 1![[thin space (1/6-em)]](https://www.rsc.org/images/entities/char_2009.gif) :
:![[thin space (1/6-em)]](https://www.rsc.org/images/entities/char_2009.gif) 1 complexation (Fig. 4B).
1 complexation (Fig. 4B).
The time-dependent fluorescence assay of DBNHC was conducted in the absence and presence of BSA to determine the response time. As shown in Fig. S14 (ESI†), the emission intensity was immediately enhanced after the addition of BSA and maintained constant over an extended period. The response time is about 11 s.
The selective interaction of DBNHC towards BSA was further checked by investigating the fluorescence responses of DBNHC towards 8 equivalents of various proteins and other different bioanalytes including β-lactoglobulin, lysozyme, CT-DNA, hemoglobin, cytochrome C, proteinase K, collagen, pepsin, trypsin, creatinine, urea, uric acid, GSH and HSA. Fig. 5 clearly establishes the fact that only BSA and HSA induce a ∼14-fold and 6-fold fluorescence enhancement of DBNHC at 450 nm, respectively. Additionally, the selectivity of DBNHC (5 μM) towards 8 equivalents of different amino acids and 12 equivalents of different anions and cations was also investigated, showing negligible changes in fluorescence intensity, revealing the fact that DBNHC can selectively recognize BSA in aqueous buffer solution (Fig. S10–S12, ESI†).
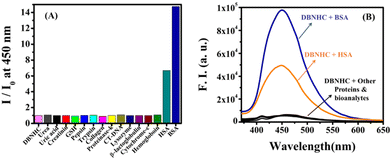 | ||
| Fig. 5 Fluorescence responses of DBNHC (5 μM) at 450 nm (λex = 355 nm) towards various proteins and other different bioanalytes (8 equivalent) in ∼100% PBS buffer pH 7.4 at room temperature. | ||
To check the biocompatibility of the probe under physiological conditions, the dependence of fluorescence intensity on the pH of the PBS buffer medium was investigated by monitoring the fluorescence spectra of DBNHC (5 μM) in the pH range 3–11 both in the absence and in the presence of BSA (5 μM). It was noticed that the fluorescence intensity of DBNHC increases only slightly in the pH range 6–11; however, this enhancement is huge in the presence of BSA (Fig. S15, ESI†), implying the suitability of the probe for detection of BSA under biological conditions.
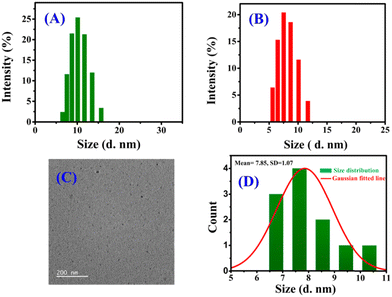
Then the BSA detection was further explored to know more about the underlying sensing mechanism. As the most common cause of the fluorescence light-up of AIEgens is molecular aggregation, DLS analysis was performed to determine if bigger nanoaggregates are developed in the presence of BSA protein. Interestingly, after adding 2 equiv. of BSA, the peak at ∼110 nm related to DBNHC nanoaggregates completely vanished with the emergence of a new peak at ∼12 nm (Fig. 6A) corresponding to the size of the BSA protein (Fig. 6B). Additionally, TEM image analysis shows that, after the addition of 2 equiv. BSA, nanoaggregates of DBNHC with an average diameter of ∼127 nm (Fig. 1B and C) converted into considerably smaller particles with an average diameter of ∼8 nm (Fig. 6C and D). All these observations clearly point towards the fact that the interaction between BSA and self-assembled DBNHC led to the disassembly of the probe, for which the hydrogen bonding, π⋯sulphur and π⋯alkyl interactions of the probe with BSA at subdomain IIIA of Sudlow site II may be the driving forces (vide supra).
Useful information regarding the rigidity of the microenvironment in the immediate vicinity of a fluorescent probe can be gathered by steady-state fluorescence anisotropy measurement experiments.64,65 Initially, upon gradual addition of the protein to the DBNHC probe in PBS buffer, there is a rapid increase in anisotropy (r) values, but after the addition of 39.38 μM BSA, it reaches the maximum at r = 0.131 (Fig. 7A). As a consequence, the increasing value of anisotropy confirmed the considerable motional restriction imposed on DBNHC within BSA.
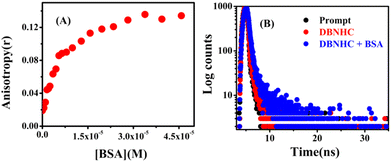 | ||
| Fig. 7 (A) Steady-state anisotropy variation of DBNHC (5 μM) with increasing concentration of BSA. (B) Time-resolved fluorescence decay spectra of DBNHC (5 μM) with the addition of 39.38 μM BSA. | ||
In addition, to find the augmentation of fluorescence emission, we have carried out the fluorescence lifetime experiment of the probe DBNHC in the absence and presence of BSA. Table 1 summarizes the decay related parameters. In the absence of BSA, in ∼100% PBS buffer solution, DBNHC shows a biexponential decay with lifetimes of 0.069 ns (96.01%) and 2.16 ns (3.99%), but after addition of 39.38 μM of BSA, DBNHC shows a biexponential decay with lifetime values of 0.313 ns (93.30%) and 3.03 ns (6.70%) (Fig. 7B). Such a longer lifetime value of DBNHC in the presence of BSA suggested a complex formation between DBNHC and BSA.66
| [BSA] (μM) | τ 1 (ns) | τ 2 (ns) | α 1 (%) | α 2 (%) | τ avg (ns) | χ 2 |
|---|---|---|---|---|---|---|
| 0 | 0.069 | 2.16 | 96.01 | 3.99 | 0.153 | 0.993 |
| 39.38 | 0.313 | 3.03 | 93.30 | 6.70 | 0.495 | 1.00 |
Site marker displacement studies
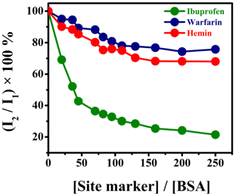
The competitive fluorescence binding studies were carried out to find out the plausible binding site of DBNHC on BSA by using three well-known site-specific markers (warfarin, ibuprofen and hemin). The crystal structure of BSA reveals that it contains three α-helical domains, I, II and III, each of which consists of two sub-domains.67,68 The warfarin site-specific marker particularly binds at subdomain IIA of site I with hydrophobic interaction as the main operating force; the site-marker ibuprofen exclusively binds at subdomain IIIA of site II with hydrogen bonding, electrostatic and van der Waals forces as the prevailing interactions along with hydrophobic forces,69 whereas hemin binds to a hydrophobic, D-shaped cavity in subdomain IB.70Here, in the displacement experiments, the site-specific drugs were incrementally added to a solution of BSA and DBNHC in a molar ratio of 1![[thin space (1/6-em)]](https://www.rsc.org/images/entities/char_2009.gif) :
:![[thin space (1/6-em)]](https://www.rsc.org/images/entities/char_2009.gif) 4 to minimize the nonspecific binding of the site-specific drugs.71 The change in the emission intensity of this ternary mixture was monitored by using the approach reported by Sudlow et al.72
4 to minimize the nonspecific binding of the site-specific drugs.71 The change in the emission intensity of this ternary mixture was monitored by using the approach reported by Sudlow et al.72
Here, I2 and I1 are the emission intensities of the BSA–DBNHC mixture in the presence and absence of site-specific drugs, respectively. In the presence of 111 μM ibuprofen, the emission intensity of the BSA–DBNHC composite was noticeably reduced by about 80%, implying the substantial displacement of BSA bound DBNHC by ibuprofen (Fig. 8). In contrast, hemin and warfarin exhibited only about 32% and 25% reduction in emission intensity, respectively, implying DBNHC mostly binds at subdomain IIIA of Sudlow site II of BSA.
Molecular docking
Taking into consideration the observation from the displacement assay, we have performed the molecular docking simulations to better understand the interaction of DBNHC–BSA, which pointed towards the encapsulation of DBNHC in subdomain IIIA of site II in BSA as shown in Fig. 9A. It is to be noted that two phenolic –OH of DBNHC form strong hydrogen bonds with SER 488 and ASN 390 residues, respectively (Fig. 9B and C). Again, the sulphur group of DBNHC and the LEU 429 residue also displayed hydrogen bonding interactions with the sulphur group of the probe (Fig. 9B and C). Here, all these hydrogen bonding interactions give better stability towards the interaction of DBNHC and BSA. Besides this, amino acid residues like CYS 391 and CYS 437 show π⋯sulphur interactions with the aromatic ring of DBNHC (Fig. 9B). Moreover, Fig. 9B shows π⋯alkyl interactions with ILE 387 and VAL 432 residues. Based on the docking simulation, the binding energy for the interaction of DBNHC with BSA is −7.43 kcal mol−1, suggesting that the interaction process is energetically favourable. Thus, the outcome of the docking experiment clearly indicates that hydrogen-bonding; π⋯sulphur and π⋯alkyl interactions are responsible for the disassembly of the DBNHC nanoaggregates, thereby facilitating the movement of DBNHC monomer inside the hydrophobic cavity of BSA in subdomain IIIA of site II. | ||
| Fig. 9 (A) Molecular docking posture of DBNHC with BSA protein (PDB ID: 4F5S) shown by the red circle. (B) Neighbouring amino acid residues and responsible forces directly interact for the accommodation of DBNHC in site II of BSA. (C) Magnified view of hydrogen bonding interactions made by DBNHC in site II of BSA. | ||
Cell tracking of BSA protein using DBNHC
The previous experiment shows that the probe DBNHC is non-fluorescent in PBS buffer due to the formation of nanoaggregation and in the presence of BSA it undergoes disaggregation leading to fluorescence enhancement. All these observations point out that DBNHC could be certainly used for tracking of BSA protein in live cells. To perform the intracellular cell imaging studies, the bio-compatibility of DBNHC (10 μM) was checked using a cytotoxicity (MTT) assay on A549 cells, which displays more than 96% cell viability at 10 μM DBNHC for 24 h (Fig. 10A), suggesting the good toleration and non-toxic nature of DBNHC towards A549 cells. The imaging of endogenous BSA in A549 cells was performed by treating DBNHC (5 μM) and washing for 30 min, followed by visualization which showed very weak fluorescence (Fig. 10B and C). Interestingly, when cells were pre-incubated with BSA (20 and 40 μM) for two hours prior to addition of DBNHC, it shows intracellular bright cyan fluorescence (Fig. 10B and C). This clearly suggests that DBNHC has excellent cell permeability and selective binding with BSA.Experimental section
Materials
1-Naphthyl isothiocyanate and 4-hydroxy salicylaldehyde were obtained from Sigma-Aldrich. All the proteins, amino acids, perchlorate salts of different cations and sodium salts of different anions were purchased either from Sigma-Aldrich or from commercial suppliers. For the synthetic purposes, reagent grade (Merck, India) solvents were used. Deionized water from Milli-Q source and HPLC-grade solvents were used for the spectroscopic studies.Synthesis and characterisation of the intermediate N-(naphthalen-1-yl)hydrazinecarbothioamide (NHC)
1-Naphthyl isothiocyanate (0.185 g, 1 mmol) and hydrazine hydrate (0.035 g, 1.1 mmol) were mixed in 10 mL of dry ethanol and stirred for 6 h at room temperature. The crude product was then filtered and washed four times with 20 mL of cold ethanol, and dried in a vacuum desiccator overnight to obtain a pure white solid product (∼76% yield). (Scheme 1). 1H NMR (300 MHz, CDCl3): δ in ppm = 9.43 (s, –NH), 8.32 (s, –NH), 7.95–7.87 (m, 3H), 7.83–7.81 (d, 1H), 7.53–7.26 (m, 3H) (Fig. S1, ESI†). 13C NMR (75 MHz, DMSO-d6): δ in ppm = 181.7, 135.7, 134.3, 130.2, 128.6, 126.4, 125.8, 125.3, 123.1 (Fig. S2, ESI†). HRMS (ESI) m/z: calcd for [M + H+], 218.0754; found, 218.0748 (Fig. S3, ESI†). IR spectrum: ν in cm−1 = 3258, 1269 (Fig. S4, ESI†).Synthesis of (Z)-2-(4,6-dihydroxycyclohexa-2,4-dien-1-ylidene)-N-(napthalen-1-yl)hydrazine-1-carbothiamide (DBNHC)
To obtain the targeted probe DBNHC, compound NHC (0.217 g, 1 mmol) and 4-hydroxy salicylaldehyde (0.138 g, 1 mmol) were dissolved in 10 mL dry ethanol. The reaction mixture was then stirred for 6 h at room temperature and thus the solid product was formed. The residue was collected by filtration, then washed four times with 20 mL cold ethanol and dried overnight in a vacuum desiccator to obtain the pure product (∼82% yield) (Scheme 1). 1H NMR (300 MHz, DMSO-d6): δ in ppm = 11.68 (s, –NH), 10.21 (s, –NH), 9.83 (s, –OH), 9.78 (s, –OH) 8.43 (s, 1H), 7.96–7.99 (m, 1H), 7.86–7.89 (m, 3H), 7.53–7.57 (m, 4H), 6.33–6.34 (d, 1H), 6.26–6.29 (d, 1H) (Fig. S5, ESI†). 13C NMR (75 MHz, DMSO-d6): δ in ppm = 177.5, 161.1, 158.6, 141.5, 136.3, 134.2, 132, 131.1, 129.3, 128.5, 127.2, 126.8, 126.3, 125.9, 123.9, 112.3, 108.2, 102.6 (Fig. S6, ESI†). HRMS (ESI) m/z: calcd for [M + H+], 338.0963; found, 338.0966 (Fig. S7, ESI†). IR spectrum: ν in cm−1 = 3126, 1632, 1255 (Fig. S8, ESI†).Preparation of stock solution
Phosphate-buffered saline (PBS) solution (10 mM, pH 7.4) was prepared in deionized water (Milli-Q source). BSA (25 mg mL−1) stock solution was prepared in deionized water. Exact concentrations of the stock solutions of the other proteins were estimated by using the spectrophotometric method considering the absorbance and molar extinction coefficient values at particular wavelengths as relevant. Stock solutions of several anions (5 mM for each) and cations (5 mM for each) were prepared by adding the needed salts in deionized water. A 10 mL stock solution of DBNHC (1 mM) was prepared in spectrophotometric grade DMSO and stored in a refrigerator before use.Instrumentation and experimental methods
Instrumentation details and the experimental methods adopted for carrying out this work are provided in the ESI.†Conclusions
In brief, the probe DBNHC can undergo self-assembly giving weakly fluorescent nanoaggregates in ∼100% PBS buffer resulting in the aggregation caused quenching (ACQ) effect. On further treatment with BSA, it becomes highly fluorescent due to BSA mediated disassembly of nanoaggregates to form monomer and subsequent trapping of the probe in the hydrophobic pocket of the protein in subdomain IIIA of site II. The sensing of BSA is highly specific, as the probe showed ∼14-fold and ∼6-fold enhancements towards BSA and HSA, respectively, and a negligible responses towards other various proteins, bioanalytes, amino acids, anions and cations. The change in the fluorescence behaviour of DBNHC in PBS buffer on interaction with BSA is associated with self-assembly–disassembly and subsequent encapsulation processes that have been well supported by DLS and TEM studies. Analysis of the binding mechanism between DBNHC and BSA implies that a combination of various hydrogen bonding, π⋯sulphur and π⋯alkyl interactions act as the primary forces to facilitate the disassembly process and trapping of DBNHC in the subdomain IIIA of Sudlow site II of BSA. Additionally, DBNHC was found to be cell permeable with negligible cytotoxicity (less than 5% at 5 μM), providing an opportunity for monitoring BSA in living cells.Conflicts of interest
There are no conflicts to declare.Acknowledgements
Financial support from the CSIR (ref. 01(2896)/17/EMR-II), New Delhi, is gratefully acknowledged. D. Moni gratefully acknowledges the CSIR, New Delhi, for the fellowship (CSIR-NET, SRF).References
- G. Fanali, A. di Masi, V. Trezza, M. Marino, M. Fasano and P. Ascenzi, Mol. Aspects Med., 2012, 33, 209–290 CrossRef CAS PubMed.
- X. M. He and D. C. Carter, Nature, 1992, 358, 209–215 CrossRef CAS.
- M. Fasano, S. Curry, E. Terreno, M. Galliano, G. Fanali, P. Narciso, S. Notari and P. Ascenzi, IUBMB Life, 2005, 57, 769–787 CrossRef.
- S. Curry, H. Mandelkow, P. Brick and N. Franks, Nat. Struct. Biol., 1998, 5, 827–835 CrossRef CAS.
- C. E. Ha and N. V. Bhagavan, Biochim. Biophys. Acta, 2013, 1830, 5486–5493 CrossRef CAS PubMed.
- B. R. Don and G. Kaysen, Semin. Dial., 2004, 17, 432–437 CrossRef PubMed.
- H. Bai, J. Qian, H. Tian, W. Pan, L. Zhang and W. Zhang, Dyes Pigm., 2014, 103, 1–8 CrossRef CAS.
- R. A. Forse and H. M. Shizgal, Serum albumin and nutritional status, J. Parenter. Enteral Nutr., 1980, 4, 450–454 CrossRef CAS PubMed.
- S. E. Gariballa, S. G. Parker, N. Taub and C. M. Castleden, Am. J. Clin. Nutr., 1998, 68, 275–281 CrossRef CAS PubMed.
- A. Shenkin, Clin. Chem., 2006, 52, 2177–2179 CrossRef CAS PubMed.
- D. A. Belinskaia, P. A. Voronina, A. A. Batalova and N. V. Goncharov, Encyclopedia, 2021, 1, 65–75 CrossRef.
- J. Fan, W. Sun, Z. Wang, X. Peng, Y. Li and J. Cao, Chem. Commun., 2014, 50, 9573–9576 RSC.
- A. Shenkin, Clin. Chem., 2006, 52, 2177–2179 CrossRef CAS.
- S. Curry, Vox Sang, 2002, 83, 315–319 CrossRef CAS.
- J. Gibbs, W. Cull, W. Henderson, J. Daley, K. Hur and S. F. Khuri, Arch. Surg., 1999, 134, 36–42 CrossRef CAS.
- T. Dziedzic, A. Slowik and A. Szczudlik, Stroke, 2004, 35, e156–e158 CrossRef CAS PubMed.
- Y.-J. Hu, Y. Liu, X.-S. Shen, X.-Y. Fang and S.-S. Qu, J. Mol. Struct., 2005, 738, 143–147 CrossRef CAS.
- F. R. Herrmann, C. Safran, S. E. Levkoff and K. L. Minaker, Arch. Intern. Med., 1992, 152, 125–130 CrossRef CAS.
- W. D. Comper and T. M. Osicka, Adv. Chronic Kidney Dis., 2005, 12, 170–176 CrossRef.
- Z. Wang, W. E. Hoy, J. L. Nicol, Z. Wang, Q. Su, R. C. Atkins and K. R. Polkinghorne, Am. J. Kidney Dis., 2008, 52, 672–682 CrossRef CAS PubMed.
- W. G. Miller, D. E. Bruns, G. L. Hortin, S. Sandberg, K. M. Aakre, M. J. McQueen, Y. Itoh, J. C. Lieske, D. W. Seccombe, G. Jones, D. M. Bunk, G. C. Curhan and A. S. Narva, Clin. Chem., 2009, 55, 24–38 CrossRef CAS PubMed.
- A. Jahanban-Esfahlan, A. Ostadrahimi, R. Jahanban-Esfahlan, L. Roufegarinejad, M. Tabibiazar and R. Amarowicz, Int. J. Biol. Macromol., 2019, 138, 602–617 CrossRef CAS.
- Y. Chen, K. Li, S. Zhang, P. Xu and B. Song, Dyes Pigm., 2022, 202, 110267 CrossRef CAS.
- H. S. Jung, X. Chen, J. S. Kim and J. Yoon, Chem. Soc. Rev., 2013, 42, 6019–6031 RSC.
- J. Yin, Y. Kwon, D. Kim, D. Lee, G. Kim, Y. Hu, J.-H. Ryu and J. Yoon, Nat. Protoc., 2015, 10, 1742–1754 CrossRef CAS PubMed.
- Z. Guo, S. Park, J. Yoon and I. Shin, Chem. Soc. Rev., 2014, 43, 16–29 RSC.
- B. Jityuti, A. Makarasen and A. Buranaprapuk, J. Photochem. Photobiol., A, 2023, 436, 114424 CrossRef CAS.
- V. K. Gawade, R. W. Jadhav, P. K. Singh and S. V. Bhosale, ChemistrySelect, 2023, 8, e202302474 CrossRef CAS.
- W. Xiao, Y. Li, Y. Xiong, Z. Chen and H. Li, Anal. Bioanal. Chem., 2023, 415, 3363–3374 CrossRef CAS PubMed.
- L. Liu, J. Zhang, Z. Yuan and G. Zhao, Sens. Actuators, B, 2023, 380, 133320 CrossRef CAS.
- M. Ahmad, N. Singla, S. S. Bhadwal, S. Kaur, P. Singh and S. Kumar, ACS Omega, 2023, 8, 2639–2647 CrossRef CAS PubMed.
- Y. Fan, F. Wang, F. Hou, L. Wei, G. Zhu, D. Zhao, Q. Hu, T. Lei, L. Yang, P. Wang and G. Ge, Chin. Chem. Lett., 2023, 34, 107557 CrossRef CAS.
- S. Dhanshri, S. Vardhan and S. K. Sahoo, Methods, 2022, 206, 69–76 CrossRef CAS.
- Z. Zheng, H. Li, S. Sun and Y. Xu, ACS Appl. Mater. Interfaces, 2018, 10, 44336–44343 CrossRef CAS PubMed.
- R. Kubota and I. Hamachi, Chem. Soc. Rev., 2015, 44, 4454–4471 RSC.
- X.-P. He, Y. Zang, T. D. James, J. Li and G.-R. Chen, Chem. Soc. Rev., 2015, 44, 4239–4248 RSC.
- M. R. Molla, P. Prasad and S. Thayumanavan, J. Am. Chem. Soc., 2015, 137, 7286–7289 CrossRef CAS.
- M. A. Azagarsamy, V. Yesilyurt and S. Thayumanavan, J. Am. Chem. Soc., 2010, 132, 4550–4551 CrossRef CAS.
- H. Wang, J. Zhuang, K. R. Raghupathi and S. Thayumanavan, Chem. Commun., 2015, 51, 17265–17268 RSC.
- M. Sasmal, A. S. Musha Islam, D. Moni, D. Maiti, A. Dutta and M. Ali, ACS Appl. Bio Mater., 2022, 5, 5854–5864 CrossRef CAS PubMed.
- C. Ren, J. Zhang, M. Chen and Z. Yang, Chem. Soc. Rev., 2014, 43, 7257–7266 RSC.
- J. Guo, J. Zhuang, F. Wang, K. R. Raghupathi and S. Thayumanavan, J. Am. Chem. Soc., 2014, 136, 2220–2223 CrossRef CAS PubMed.
- S. Samanta, S. Halder and G. Das, Anal. Chem., 2018, 90, 7561–7568 CrossRef CAS.
- P. Singh, L. S. Mittal, S. Kaur, S. Kaur, G. Bhargava and S. Kumar, Sens. Actuators, B, 2018, 255, 478–489 CrossRef CAS.
- Y. Yu, Y. Huang, F. Hu, Y. Jin, G. Zhang, D. Zhang and R. Zhao, Anal. Chem., 2016, 88, 6374–6381 CrossRef CAS.
- O. R. Miranda, C. C. You, R. Phillips, I. B. Kim, P. S. Ghosh, U. H. F. Bunz and V. M. Rotello, J. Am. Chem. Soc., 2007, 129, 9856–9857 CrossRef CAS PubMed.
- M. De, S. Rana, H. Akpinar, O. R. Miranda, R. R. Arvizo, U. H. F. Bunz and V. M. Rotello, Nat. Chem., 2009, 1, 461–465 CrossRef CAS.
- E. Hadjoudis and I. M. Mavridis, Chem. Soc. Rev., 2004, 33, 579e–588e Search PubMed.
- K. Singh, M. S. Barwa and P. Tyagi, Eur. J. Med. Chem., 2006, 41, 147e–153e CrossRef.
- P. Panneerselvam, R. B. Nair, G. Vijayalakshmi, E. H. Subramanian and S. K. Sridhar, Eur. J. Med. Chem., 2005, 40, 225e–229e CrossRef.
- S. K. Sridhar, M. Saravanan and A. Ramesh, Eur. J. Med. Chem., 2001, 36, 615e–625e CrossRef.
- S. N. Pandeya, D. Sriram, G. Nath and E. DeClercq, Eur. J. Pharm. Sci., 1999, 9, 25e–31e CrossRef.
- H. Beraldo and D. Gambino, Mini Rev. Med. Chem., 2004, 4, 31e–39e CrossRef PubMed.
- N. Parul, N. Subhangkar and M. Arun, Int. Res. J. Pharm., 2012, 3, 350–363 Search PubMed.
- A. Basu, D. Thiyagarajan, C. Kar, A. Ramesh and G. Das, RSC Adv., 2013, 3, 14088–14098 RSC.
- Y. Guo, Y. Chen, X. Zhu, Z. Pan, X. Zhang, J. Wang and N. Fu, Sens. Actuators, B, 2018, 255, 977–985 CrossRef CAS.
- Z. G. Wang, X. J. Yan, H. B. Liu, D. L. Zhang, W. Liu, C. Z. Xie, Q. Z. Li and J. Y. Xu, J. Mater. Chem. B, 2020, 8, 8346–8355 RSC.
- P. Anees, S. Sreejith and A. Ajayaghosh, J. Am. Chem. Soc., 2014, 136, 13233–13239 CrossRef CAS.
- Y. Yu, Y. Huang, F. Hu, Y. Jin, G. Zhang, D. Zhang and R. Zhao, Anal. Chem., 2016, 88, 6374–6381 CrossRef CAS PubMed.
- C. Browning, J. M. Hudson, E. W. Reinheimer, F. L. Kuo, R. N. McDougald, H. Rabaâ, H. Pan, J. Bacsa, X. Wang, K. R. Dunbar, N. D. Shepherd and M. A. Omary, J. Am. Chem. Soc., 2014, 136, 16185–16200 CrossRef CAS.
- X. Q. Xu, Y. D. Qian, P. Wu, H. Zhang and C. X. J. Cai, Colloid Interface Sci., 2015, 445, 102–111 CrossRef CAS PubMed.
- B. Ojha and G. Das, ChemComm, 2010, 46, 2079–2081 RSC.
- T. Zhu, J. Du, W. Cao, J. Fan and X. Peng, Ind. Eng. Chem. Res., 2016, 55, 527–533 CrossRef CAS.
- J. R. Lakowicz, Fluorescence Anisotropy, Principles of Fluorescence Spectroscopy, Springer, New York, 3rd edn, 2006, pp. 353–381 Search PubMed.
- M. Sasmal, R. Bhowmick, A. S. Musha Islam, S. Bhuiya, S. Das and M. Ali, ACS Omega, 2018, 3, 6293–6304 CrossRef CAS PubMed.
- C. Kar, B. Ojha and G. Das, Luminescence, 2013, 28, 339–344 CrossRef CAS.
- S. Naveenrajan and S. Anandan, J. Photochem. Photobiol.,C, 2013, 14, 53–71 CrossRef.
- M. Sasmal, A. S. M. Islam, R. Bhowmick, D. Maiti, A. Dutta and M. Ali, ACS Appl. Bio Mater., 2019, 2, 3551–3561 CrossRef CAS PubMed.
- A. Jahanban-Esfahlan, L. Roufegarinejad, R. Jahanban-Esfahlan, M. Tabibiazar and R. Amarowicz, Talanta, 2020, 207, 120317 CrossRef CAS.
- P. A. Zunszain, J. Ghuman, T. Komatsu, E. Tsuchida and S. Curry, BMC Struct. Biol., 2003, 3, 1–9 CrossRef.
- N. Ibrahim, H. Ibrahim, S. Kim, J. P. Nallet and F. Nepveu, Biomacromolecules, 2010, 11, 3341–3351 CrossRef CAS PubMed.
- G. Sudlow, D. J. Birkett and D. N. Wade, Mol. Pharmacol., 1976, 12, 1052–1061 CAS.
Footnote |
| † Electronic supplementary information (ESI) available. See DOI: https://doi.org/10.1039/d3nj04071b |
| This journal is © The Royal Society of Chemistry and the Centre National de la Recherche Scientifique 2024 |


