CdS QDs decorated on 3D flower-like Sn3O4: a hierarchical photocatalyst with boosted charge separation for hydrogen production†
Pengfei
Tan
a,
Lu
Yang
*b,
Hele
Liu
b,
Yi
Zhang
ab,
Binhua
Zhou
a and
Jun
Pan
 *a
*a
aState Key Laboratory for Powder Metallurgy, Central South University, Changsha 410083, P. R. China. E-mail: jun.pan@csu.edu.cn
bHunan Key Laboratory of Applied Environmental Photocatalysis, Changsha University, Changsha 410022, P. R. China. E-mail: z20180829@ccsu.edu.cn
First published on 20th November 2023
Abstract
Developing novel catalysts with excellent photocatalytic hydrogen evolution activity is crucial for expediting current research on solar-chemical energy conversion. In the present study, unique Sn3O4/CdS composites were carefully designed and prepared using a facile hydrothermal method to achieve outstanding photocatalytic H2 production activity. Various techniques were employed to determine the crystalline structure, chemical composition, microstructure, and optical and electrochemical characteristics of the prepared samples. The experimental results indicate that zero-dimensional (0D) CdS quantum dots were tightly attached to the surface of three-dimensional (3D) Sn3O4 nanoflowers. Furthermore, enhanced light-absorbing capacity and accelerated electron–hole separation and transfer were achieved after incorporating CdS quantum dots into Sn3O4 nanoflowers. The generation rate of hydrogen using the optimal sample (Sn3O4/CdS QDs-2) was about 20.74 μmol g−1 h−1, which was 2.86 and 3.16 times those of pure Sn3O4 and CdS, respectively. In addition, the possible photocatalytic H2 production mechanism of Sn3O4/CdS nanocomposites was also revealed. This work is highly desirable to provide valuable inspiration for rational design and preparation of efficient photocatalysts for H2 evolution.
1. Introduction
The progressive exhaustion of conventional fossil fuels and the escalating environmental pollution issues have sparked worldwide concerns.1,2 In this regard, the use of semiconductors for photocatalytic hydrogen production through water splitting is eagerly awaited, as it can directly convert limitless solar energy into renewable and eco-friendly hydrogen energy.3 To achieve effective hydrogen generation, novel and efficient photocatalysts are crucial. To date, a large number of semiconductor-based photocatalysts (e.g., oxides, sulfides, and polymers) have been synthesized and investigated for the hydrogen evolution reaction (HER).4–6 Unfortunately, the majority of single-component photocatalysts suffer from low light energy utilization and high carrier combination rates, resulting in poor photocatalytic performance.3 Therefore, expanding the light absorption response range and improving the separation and transportation efficiency of photo-induced electron–holes to construct efficient photocatalysts for the photocatalytic HER are still the key points to be solved.In recent years, Sn3O4, a non-stoichiometric tin-based oxide consisting of Sn2+ and Sn4+, has attracted much attention and been recognized as a potentially excellent photocatalyst due to its natural abundance, nontoxicity, thermodynamic stability, responsiveness to visible light, and favorable band-edge position for hydrogen production.7,8 However, the pristine Sn3O4 material also encounters the disadvantages of fast electron–hole combination, limited visible light absorption range, and poor stability, which exist in most single-component photocatalysts, leading to unsatisfactory performance and seriously affecting its practical applications.9–11 The construction of heterojunctions provides an idea for the solution of the above issues. To this end, researchers have been successful in constructing a wide variety of photocatalytic hydrogen generation catalysts based on Sn3O4. For instance, Zn0.5Cd0.5S/Sn3O4 (ZCS/SO) composites prepared by Jiang and colleagues using a one-step hydrothermal method exhibited an enhanced hydrogen production rate, which is due to the improved light absorption range and electron–hole separation efficiency.10 Additionally, Wang's group prepared Sn3O4/TiO2 NT composites through a hydrothermal method and achieved a higher photocatalytic H2-production rate compared to that of the single component.9 Cui et al. synthesized two dimensional (2D)-2D g-C3N4/Sn3O4 heterojunctions using a calcination strategy. In comparison to g-C3N4 and Sn3O4, the H2 evolution rates of the heterojunctions were 5.4 and 3.2 times higher, respectively.12 From the above successful cases, it is clear that it is possible to develop excellent Sn3O4-based photocatalysts by constructing composite structures with wide light absorption and unique photogenerated charge transfer pathways. It should be noted, however, that the construction of composite structures frequently necessitates the selection of semiconductor materials with suitable energy band structures and that a reasonably close contact between the components in the composites is required for the full effect.3,13–15 Therefore, the task of selecting suitable semiconductor materials that can effectively enhance the photocatalytic H2-production activity when combined with Sn3O4 to create composite materials remains a challenge, and further research in this area is still ongoing.
As an n-type semiconductor, CdS has garnered considerable interest due to its abundant earth resources, visible light response, suitable electronic structure, and exceptional catalytic performance.4 In recent years, it has been reported that CdS can couple with many semiconductors (ZnO,16 Co9S8,17etc.) to produce composites with enhanced H2-production performance.4 Given the extremely matched energy band edge positions of CdS and Sn3O4, it is promising to accelerate charge separation and migration by carefully designing and constructing Sn3O4/CdS composites with a unique energy band arrangement, thus realizing efficient hydrogen production. In addition, a lot of research has also been done on the morphology of heterojunctions because of the remarkable structure–activity relationship in photocatalysis. It is noted that zero-dimensional (0D)/three-dimensional (3D) composites constructed by modifying 3D nanostructures with 0D quantum dots (QDs) not only have good interfacial contacts for accelerated carrier separation, but also optimize multiple light reflection/scattering with the help of the hierarchical structure to improve the light energy utilization.17–19 However, the attempt of constructing 3D/0D Sn3O4/CdS composites for enhanced HER has not been reported so far.
Inspired by the aforementioned analysis, in this study, by confining 0D CdS QDs on 3D Sn3O4 nanoflowers using a simple hydrothermal method, novel 3D/0D Sn3O4/CdS composites were carefully designed and constructed for the first time. The as-prepared catalysts’ activity under visible light was revealed by photocatalytic HER experiments. It is interesting to find that the coupling of Sn3O4 and CdS can dramatically improve the HER activity. By analyzing the optical and electrochemical properties of the composites, the enhanced efficiency of Sn3O4/CdS composites is elucidated, and a potential photocatalytic mechanism is suggested. This work opens up ideas for further research on efficient Sn3O4-based visible-light-driven photocatalysts with enhanced H2-evolution activity.
2. Experimental section
2.1. Preparation of CdS quantum dots (CdS QDs)
In a 100 mL beaker, 50 mL of 10 mM cadmium chloride aqueous solution was poured, and then 0.25 mL of thioglycolic acid was added. The pH was adjusted to 11 by adding NaOH aqueous solution (1 M). Afterwards, a solution containing 5 mL (0.1 M) of dehydrated sodium sulfide was added to the previous mixture and agitated for a duration of 4 hours. As a result, CdS QDs were obtained. The reaction was consistently conducted in an atmosphere of nitrogen.2.2. Preparation of Sn3O4 and Sn3O4/CdS QD composites
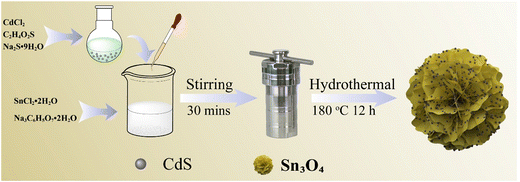
A homogeneous solution was formed by dissolving 5 mmol of SnCl2·2H2O and 12.5 mmol of Na3C6H5O7·2H2O in 12.5 mL of deionized water, which was then stirred and sonicated for 20 minutes. Subsequently, different amounts of CdS QD solutions were added to the above solution, and the resulting mixture was named solution A. In order to prepare solution B, 0.3 g of NaOH was dissolved in 12.5 mL of distilled water. Solutions A and B were combined and agitated for 30 minutes. Subsequently, the resulting mixture was transferred to a 50 mL autoclave and underwent a 12 hour hydrothermal reaction at 180 °C in an oven. Once the reactor dropped to ambient temperature, the resultant yellow solid was rinsed multiple times with deionized water and ethanol. Finally, the Sn3O4/CdS QD composites were obtained by vacuum-drying the above precipitates at 60 °C for 12 hours. The preparation process of Sn3O4/CdS QDs is depicted in Fig. 1. Sn3O4/CdS QDs-1, Sn3O4/CdS QDs-2, Sn3O4/CdS QDs-3 and Sn3O4/CdS QDs-4 were the final corresponding samples, which are labeled based on the addition of CdS QD solutions of 0.5, 1.0, 1.5 and 2.0 mL, respectively.The preparation process of pure Sn3O4 flower-like structures was the same as that of the Sn3O4/CdS QD composites described above, except that the CdS QD solution was not added.
3. Results and discussion
3.1. Phase characteristics
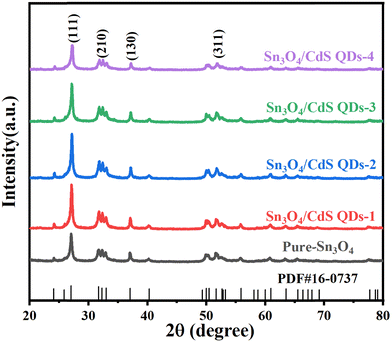
The phase composition of Sn3O4, CdS QDs and Sn3O4/CdS composite samples was determined using X-ray diffraction (XRD). The results are compared in Fig. 2. As can be seen, the diffraction peaks at 24.2°, 27.11°, 31.81°, 32.41°, 33.01°, 37.11°, 40.31°, and 51.71° belong to the (101), (111), (210), (121), (210), (130), (102), and (132) crystal planes of Sn3O4 (JCPDS no. 160737), respectively, indicating the successful synthesis of high-purity Sn3O4.10 The XRD pattern of the prepared CdS QDs is consistent with JCPDS no. 750581 (Fig. S1, ESI†).19,20 The XRD patterns of the Sn3O4/CdS composite samples are similar to those of Sn3O4, indicating that the introduction of CdS did not affect the lattice of the original component. No obvious characteristic diffraction peaks belonging to CdS are found in the Sn3O4/CdS composite samples, possibly because of the low concentration and effective dispersion of CdS QDs within the composites.19 The average crystallite sizes of pure Sn3O4 and Sn3O4/CdS QD samples are shown in Table S1 (ESI†), which were calculated by Scherer's formula.213.2. Micromorphological analysis
The samples’ morphological characteristics and microstructure were examined using scanning electron microscopy (SEM) and transmission electron microscopy (TEM). Fig. S2a (ESI†) depicts the SEM image of pure Sn3O4. As illustrated in the figure, the prepared pure Sn3O4 sample has a three-dimensional flower-like structure composed of various nanosheets. Fig. 3 shows the SEM images of different Sn3O4/CdS QD catalysts. When compared, it is possible to conclude that the flower-like structure of pure Sn3O4 is inherited by the composite samples. Therefore, it can be inferred that the Sn3O4 sample did not undergo a significant change in morphology upon coupling with CdS QDs, but rather maintained the original structural property.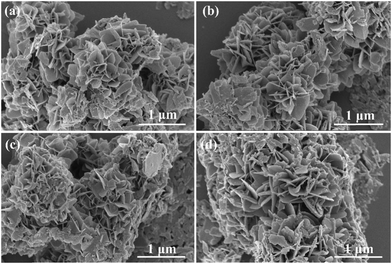 | ||
| Fig. 3 SEM images of Sn3O4/CdS QDs-1 (a), Sn3O4/CdS QDs-2 (b), Sn3O4/CdS QDs-3 (c), and Sn3O4/CdS QDs-4 (d). | ||
TEM images of pure Sn3O4 are shown in Fig. S2b and c (ESI†). These images reveal that a flower-like structure is uniform throughout the material, and demonstrate that the flower-like structure is formed of stacked thin nanosheets. From the TEM image of CdS (Fig. S2d, ESI†), it is clear that the prepared pure CdS QDs are quantum dots with small sizes. Fig. 4a and b depict the TEM images of the Sn3O4/CdS QDs-2 composite sample, in which the structural features of the thin nanosheets are clearly visible and are not disrupted after coupling with CdS QDs, confirming the SEM results. Moreover, the high-resolution transmission electron microscopy (HRTEM) image reveals that CdS QDs in the composite sample appeared on the nanosheets of Sn3O4 and were uniformly dispersed (Fig. 4c and Fig. S3, ESI†). A favorable contact interface is formed between the two components. The interface promotes the establishment of a pathway for carrier transportation and facilitates the efficient carrier movement. The composite sample exhibits distinct lattice stripes (Fig. 4d). And, a lattice spacing of 0.369 nm corresponds to the (101) crystal plane of Sn3O4, confirming the presence of Sn3O4 in the prepared catalysts. CdS can be identified in the composite sample because the characteristic lattice spacing of 0.205 nm is consistent with its (220) crystal plane. Furthermore, the nanostructure of Sn3O4/CdS QDs can be corroborated by the high-angle annular dark-field (HAADF) image (Fig. 4e) and energy dispersive spectroscopy (EDS) elemental mapping images (Fig. 4f–i and Fig. S4, ESI†), from which it is clear that Sn, O, Cd, and S are all present in the composite structure and are distributed evenly throughout the nanostructure.
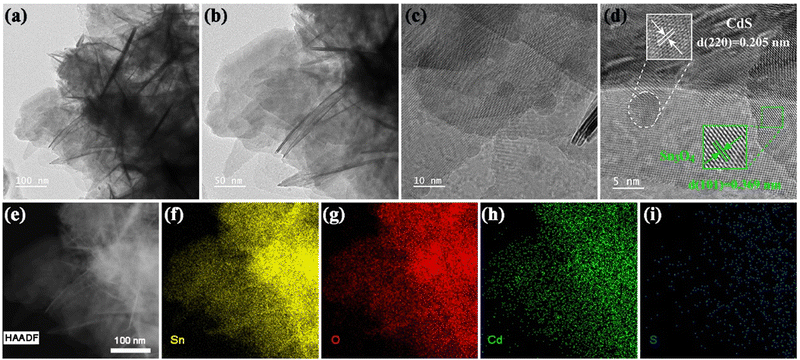 | ||
| Fig. 4 TEM (a) and (b) and HRTEM (c) and (d) images of Sn3O4/CdS QDs-2. (e)–(i) HAADF and EDS mapping images of Sn, O, Cd, and S in Sn3O4/CdS QDs-2. | ||
3.3. Surface composition analysis
Using X-ray photoelectron spectroscopy (XPS), the chemical composition and state of pure Sn3O4, CdS QD, and Sn3O4/CdS QDs-2 composites were determined. Fig. 5 depicts the results. The high-resolution spectrum of Sn 3d (shown in Fig. 5a) consists of two distinct asymmetric splitting signals, which are respectively 3d3/2 and 3d5/2, suggesting that Sn possesses multiple chemical states in pure Sn3O4. Among them, Sn 3d3/2 can be deconvolved into two peaks, the first of which is Sn4+ at 495.0 eV, and the second of which is Sn2+ at 496.4 eV.7,8 Meanwhile, the signal of Sn 3d5/2 can fit into two peaks. The peak centered at 486.6 eV can be attributed to Sn4+, while the binding energy of 486.1 eV is ascribed to Sn2+.14,22 The peak of O1s of Sn3O4 in Fig. 5b can be dissolved into two peaks, one at 531.4 eV (corresponding to O–Sn4+) and the other at 530.3 eV (belonging to O–Sn2+).10Fig. 5c and d reveals the high-resolution XPS of Cd 3d and S 2p for Sn3O4 and Sn3O4/CdS QDs-2. As shown in Fig. 5c, two characteristic peaks located at 411.9 and 405.2 eV belong to Cd 3d3/2 and Cd 3d5/2, respectively.10,17 Additionally, the S 2p spectrum shown in Fig. 5d can be dissolved into two peaks, located at 162.6 and 161.4 eV, which is assigned to S 2p1/2 and S 2p3/2, respectively.17 It is noteworthy that the positions of the characteristic peaks corresponding to Sn 3d and O 1s in the Sn3O4/CdS QDs-2 composite are slightly shifted toward higher binding energies compared to that of pure Sn3O4. And the characteristic peaks corresponding to Cd 3d and S 2p in the composite can be observed to be shifted toward lower binding energy with respect to pure CdS. These phenomena indicate that the coupling of Sn3O4 and CdS forms an effective interfacial contact between the two component materials, and strong interactions and charge redistributions occur, which contribute to the separation of charge carriers.10,19,23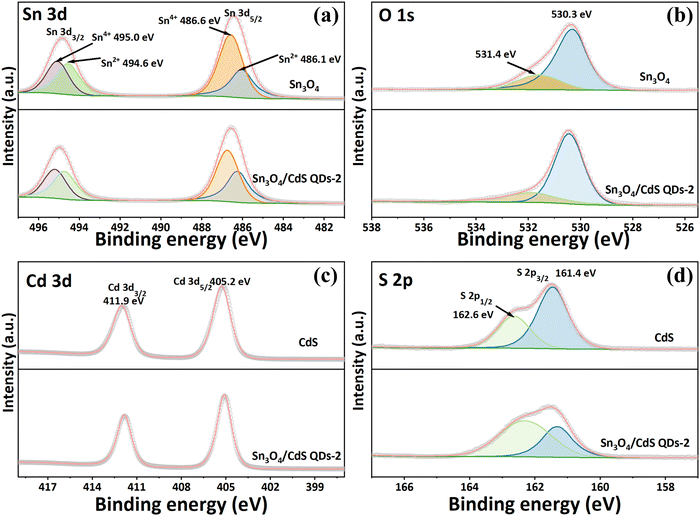 | ||
| Fig. 5 High-resolution XPS spectra of (a) Sn 3d, (b) O 1s, (c) Cd 3d, and (d) S 2p in Sn3O4 and Sn3O4/CdS QDs-2. | ||
3.4. Optical absorption properties and energy band structures
In order to reveal the light absorption ability and energy band gap of the resulting samples, the optical properties of Sn3O4, CdS QD, and Sn3O4/CdS QDs-2 composites were revealed by UV-vis diffuse reflectance spectroscopy (DRS). It can be found that the prepared catalysts can all respond within the wavelength range of 300–800 nm (Fig. 6a), implying that the samples can undergo photocatalytic reactions by absorbing UV light and visible light, respectively. Among them, the strong absorption edges of Sn3O4 and CdS QDs are at about 510 nm and 530 nm, respectively. After decorating the surface of Sn3O4 with CdS QDs, a slight redshift at the band edge of the Sn3O4/CdS QDs-2 composite could be achieved and the light absorption intensity also increased. This suggests that the formation of Sn3O4/CdS QD heterostructures can significantly improve the material's utilization efficiency for sunlight, thereby promoting the involvement of more photogenerated carriers in the redox process and boosting the photocatalytic performance. Furthermore, the intrinsic energy gaps (Eg) of Sn3O4 and CdS QDs can be derived from the Kubelka–Munk function.24,25 The Tauc-plots of Sn3O4 and CdS QDs are shown in Fig. 6b, and by extrapolating the linear portion of the Sn3O4 and CdS QDs curves until their intercepts with the x-axis, the band gaps of Sn3O4 and CdS QDs can be determined as 2.6 and 2.4 eV, correspondingly. These values align well with the reported values.26,27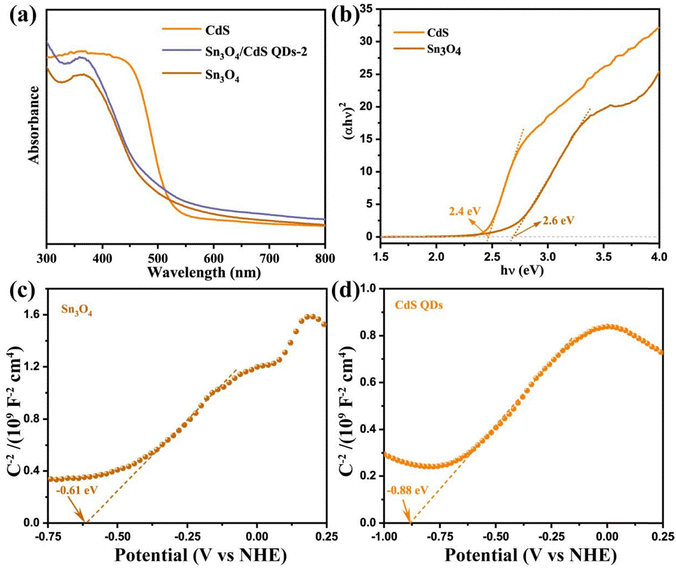 | ||
| Fig. 6 (a) DRS of Sn3O4, CdS QD, and Sn3O4/CdS QDs-2 samples. (b) Tauc and (c) and (d) Mott–Schottky plots of Sn3O4 and CdS QDs. | ||
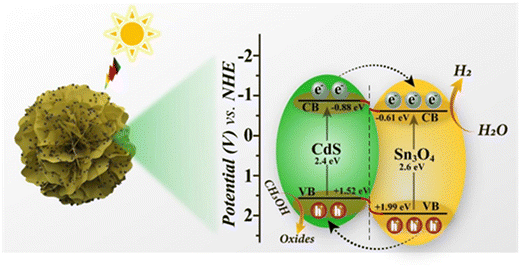
In addition, the Mott–Schottky (M–S) curves provide insight into the catalysts’ semiconductor type and energy band structure. Fig. 6c and d show the M–S curves of Sn3O4 and CdS QDs. It can be seen that both exhibit a linear region with a positive slope, indicating that both of them are n-type semiconductors. The flat band potentials of Sn3O4 and CdS QDs are −0.61 and −0.88 eV (vs. NHE, pH = 7), respectively, obtained from the tangent intercepts of the M–S curves. In general, the conduction band potential (ECB) of n-type semiconductors can be considered to be approximately equal to their flat band potentials.12,13,22 Thus, the ECB values of Sn3O4 and CdS QDs are estimated to be around −0.61 and −0.88 eV (vs. NHE, pH = 7), respectively. Meanwhile, according to the following equation: Eg = EVB − ECB, and in combination with the Eg of Sn3O4 and CdS QDs in Fig. 6b, the valence band edge positions (EVB) of Sn3O4 and CdS can be calculated as 1.99 and 1.52 eV (vs. NHE, pH = 7), respectively.28
3.5. Photocatalytic performance and interfacial charge transfer
The efficiency of H2-evolution from water splitting (λ ≥ 420 nm) is a criterion for evaluating the photocatalytic performance of catalysts. In this experiment, to reflect the photocatalytic performance of Sn3O4, CdS and Sn3O4/CdS composites, the amount of H2 production of the samples was measured over a period of 4 h and its average hydrogen production rate was calculated. To consume the photogenerated holes, the CH3OH aqueous solution was used as the sacrificial agent.Fig. 7a shows the fluctuation curves of hydrogen production over time for different photocatalysts. It can be seen that the photocatalytic activities of both pure Sn3O4 and bare CdS QDs are poor under the above conditions, which is due to the rapid recombination of photogenerated carriers. Surprisingly, the coupling of Sn3O4 with CdS QDs enhances the hydrogen production performance of all Sn3O4/CdS QD composite samples. In order to explain more directly the change in performance after the addition of CdS QDs, the H2-evolution rates of the corresponding products are shown in Fig. 7b. The comparison of the hydrogen production rates of other Sn3O4-based photocatalysts is shown in Table S2 (ESI†). Pure Sn3O4 and bare CdS QDs exhibit average hydrogen production rates of 7.25 and 6.55 μmol g−1 h−1, respectively. Among a series of composites, Sn3O4/CdS QDs-2 shows the highest H2 production rate of 20.74 μmol g−1 h−1, surpassing those of pure Sn3O4 and CdS by 2.86 and 3.16 times. The hydrogen production rates of the composite samples show the following trend: Sn3O4/CdS QDs-2 (20.74 μmol g−1 h−1) > Sn3O4/CdS QDs-3 (17.85 μmol g−1 h−1) > Sn3O4/CdS QDs-1 (15.87 μmol g−1 h−1) > Sn3O4/CdS QDs-4 (14.25 μmol g−1 h−1). It can be seen that more CdS do not always mean higher photocatalytic performance since it might have a negative impact on the catalyst's dispersion, interfacial contact ability, and light absorption capacity at high concentrations. The cyclic stability test (Fig. S5, ESI†) shows that the H2 production rate of the prepared catalyst does not decrease considerably after four reactions, indicating that the material has good stability. The photocatalytic H2 evolution curve of Sn3O4/CdS QDs-2 with an error bar is shown in Fig. S6 (ESI†), which further proves the reliability and stability of Sn3O4/CdS QDs-2. In addition, the XRD and TEM results of Sn3O4/CdS QDs-2 after the photocatalytic reaction are shown in Fig. S7 and S8 (ESI†). The results show that the morphology and crystal structure of the sample did not change significantly after the photocatalytic hydrogen production reaction.
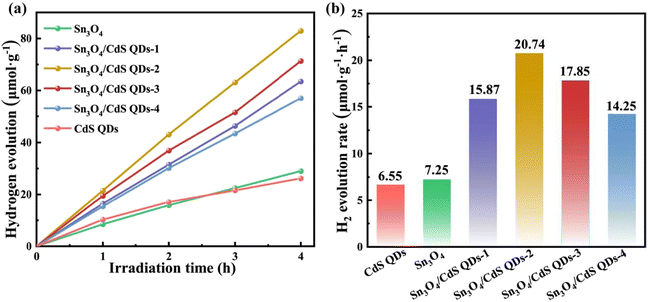 | ||
| Fig. 7 (a) Photocatalytic H2-production versus time and (b) the rates of H2 production for different samples. | ||
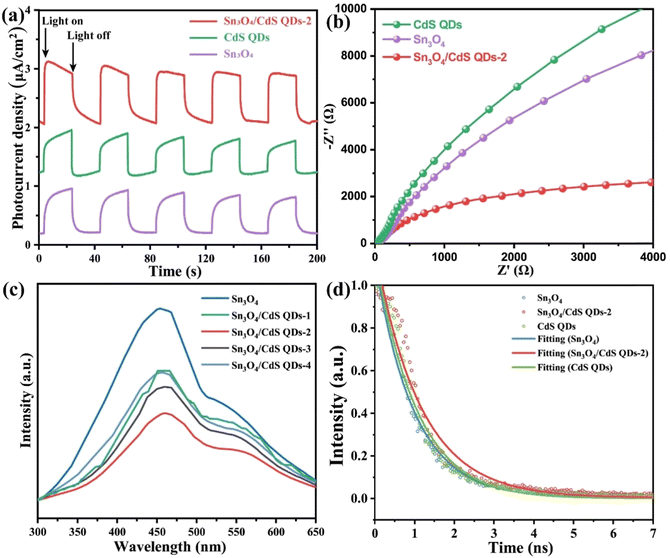
To investigate the separation and transfer efficiency of photogenerated carriers in the catalysts, various experiments were performed, including transient photocurrent analysis (I–t curves), electrochemical impedance spectroscopy (EIS), steady-state photoluminescence (PL) spectroscopy, and time-resolved photoluminescence (TR-PL) spectroscopy. In general, the higher the transient photocurrent density, the higher the interfacial carrier separation efficiency of the catalyst, and the better the photocatalytic performance.29,30Fig. 8a shows the transient photocurrent response plots of CdS QD, Sn3O4, and Sn3O4/CdS QDs-2 nanocomposites under visible light irradiation for several on–off cycles. The results show that the transient photocurrent response of the Sn3O4/CdS QDs-2 composite photocatalyst is significantly enhanced when used as working electrodes compared to pristine Sn3O4 or CdS, suggesting that the photogenerated charge separation and transfer of Sn3O4/CdS QD nanocomposites is more capable under light irradiation. This conclusion can also be confirmed by the Nyquist plots of the corresponding samples shown in Fig. 8b. For the optimal sample of Sn3O4/CdS QDs-2, the radius of a semicircle arc is the smallest compared with that of pristine CdS QDs and Sn3O4, respectively. This implies that Sn3O4/CdS QDs-2 has the smallest electron-transfer resistance, signifying that it has the fastest electron transfer, which is favorable for the efficient separation and transfer of carriers.31 The recombination rate of charge carriers in the catalysts was further assessed by PL. Fig. 8c reveals the fluorescence intensity of Sn3O4 and a series of Sn3O4/CdS QD nanocomposites. Generally, the low signal of fluorescence peak indicates a low recombination probability of photo-induced electron–hole pairs, thus showing high photocatalytic activity.32,33 It is not difficult to find that the PL intensity of pure Sn3O4 is the highest, and the PL intensity of Sn3O4/CdS QDs-2 is the lowest. The results indicate the recombination of photogenerated carriers in the composite material is sufficiently suppressed, which also corroborates with the experimental outcomes of I–t and EIS. Additionally, the lifetime of photoinduced carriers in the photocatalysts was analyzed using TR-PL spectra.34 The average lifetime (τav) can be obtained by fitting the decay process with a bi-exponential function: τav = (A1τ12 + A2τ22)/(A1τ1 + A2τ2).27 The specific fitting data are summarized and shown in Table S3 (ESI†). From the TR-PL spectra (Fig. 8d), the τav values of Sn3O4, CdS QD, and Sn3O4/CdS QDs-2 composites are 1.78, 1.37 and 2.25 ns, respectively. Apparently, the fluorescence lifetime of the Sn3O4/CdS QDs-2 nanocomposite is increased compared with those of Sn3O4 and CdS QDs. The increase in the carrier lifetime implies an increase in the utilization of electron–hole pairs during the photocatalytic process and a boost in the activity of photocatalysis.35 This is also consistent with the above findings on photocurrent, EIS, and hydrogen production properties.
3.6. Photocatalytic mechanism
Based on the above results and analyses, we propose a possible mechanism for the efficient separation of photogenerated carriers and high H2 evolution performance in the Sn3O4/CdS QD composite system (as shown in Fig. 9). When compared to Sn3O4, CdS QDs have more negative conduction band (CB) and valence band (VB) locations. Then, a matched and staggered energy band structure is formed between them. Under visible light irradiation, both CdS and Sn3O4 are capable of creating photogenerated carriers when they get excited. Due to the potential difference between CdS and Sn3O4, the photogenerated electrons on the CB of CdS migrate quickly to the CB of Sn3O4, where they react with the water molecules adsorbed on the catalyst's surface to reduce H2O to H2. Conversely, the holes generated on the VB of Sn3O4 tend to migrate to the VB of CdS. Subsequently, these holes are consumed by CH3OH as the sacrificial agent. Such an electron transfer pathway effectively suppresses the combination of photogenerated charges with different electrical properties in the Sn3O4/CdS QD heterostructures, thereby extending the lifetime of photoinduced electron–hole pairs and enhancing photocatalytic activity.4. Conclusions
In conclusion, unique 3D/0D Sn3O4/CdS QD composite photocatalysts were successfully synthesized by employing a simple hydrothermal method. TEM observations indicated that 0D CdS QDs were closely confined on the 3D Sn3O4 nanoflowers forming a close contact interface. The effective formation of the composite contributes to the improvement of the light absorption capacity of the composite sample as well as the charge carrier separation between the components, as evidenced by the DRS analysis and the electrochemical test. As a result, enhanced hydrogen production performance was achieved in Sn3O4/CdS QD composites. The optimal hydrogen generation rate of Sn3O4/CdS QDs-2 was about 20.74 μmol g−1 h−1, which was 2.86 and 3.16 times those of pure Sn3O4 and CdS, respectively. Moreover, the Sn3O4/CdS QDs-2 nanocomposite exhibited stable cycling performance. This study provides a feasible new strategy for the design and preparation of efficient Sn3O4-based composite photocatalysts for solar-driven hydrogen production from water splitting.Author contributions
Pengfei Tan: synthesis, data analysis, and writing; Lu Yang: methodology, writing, supervision, and reviewing; Hele Liu, Yi Zhang, and Binhua Zhou: methodology and investigation; Jun Pan: supervision and reviewing.Conflicts of interest
The authors declare that there are no conflicts of interest.Acknowledgements
The Natural Science Foundation of Hunan Province (2022JJ40613), the Open Project of Yunnan Precious Metals Laboratory Co., Ltd (no. YPML-2023050264), the National Natural Science Foundation of China (52001335 and 12074435), and the Natural Science Foundation of Yunnan Province (202201AT070259) provided financial support for this work.References
- S. Nishioka, F. E. Osterloh, X. Wang, T. E. Mallouk and K. Maeda, Nat. Rev. Methods Primers, 2023, 3, 1–15 CrossRef.
- C. Bie, L. Wang and J. Yu, Chem, 2022, 8, 1567–1574 CAS.
- B. Samanta, Á. Morales-García, F. Illas, N. Goga, J. A. Anta, S. Calero, A. Bieberle-Hütter, F. Libisch, A. B. Muñoz-García, M. Pavone and M. C. Toroker, Chem. Soc. Rev., 2022, 51, 3794–3818 RSC.
- L. Cheng, Q. Xiang, Y. Liao and H. Zhang, Energy Environ. Sci., 2018, 11, 1362–1391 RSC.
- L. Hu, H. Yang, S. Wang, J. Gao, H. Hou and W. Yang, J. Mater. Chem. C, 2021, 9, 5343–5348 RSC.
- W. Zhang, Z. Deng, J. Deng, C.-T. Au, Y. Liao, H. Yang and Q. Liu, J. Mater. Chem. A, 2022, 10, 22419–22427 RSC.
- H. Liu, P. Tan, H. Zhai, M. Zhang, J. Chen, R. Ren, Z. Wang and J. Pan, New J. Chem., 2022, 46, 14043–14051 RSC.
- H. Liu, P. Tan, L. Yang, M. Zhang, J. Chen, R. Ren, H. Zhai, T. Qi and J. Pan, Mol. Catal., 2023, 547, 113309 CrossRef CAS.
- Q. Wang, Y. Zhao, Z. Zhang, S. Liao, Y. Deng, X. Wang, Q. Ye and K. Wang, Ceram. Int., 2023, 49, 5977–5985 CrossRef CAS.
- X. Zhou, J. Wu, Y. Xiao, Y. Jiang, W. Zhang, Y. Liu, Z. Liu and J. Zhang, Sep. Purif. Technol., 2023, 311, 123243 CrossRef CAS.
- C. Aruljothi, P. Balaji, E. Vaishnavi, T. Pazhanivel and T. Vasuki, J. Chem. Technol. Biotechnol., 2023, 98, 1908–1917 CrossRef CAS.
- Y. Zhu, Y. Cui, B. Xiao, J. Ou-yang, H. Li and Z. Chen, Mater. Sci. Semicond. Process., 2021, 129, 105767 CrossRef CAS.
- Y. Wen, D. Wang, H. Li, W. Jiang, T. Zhou, X. Deng, B. Hu, C. Liu and G. Che, Appl. Surf. Sci., 2021, 567, 150903 CrossRef CAS.
- L. Chen, C. Hou, Z. Liu, Y. Qu, M. Xie and W. Han, Chem. Commun., 2020, 56, 13884–13887 RSC.
- B. Parasuraman, B. Kandasamy, V. Vasudevan and P. Thangavelu, Environ. Sci. Pollut. Res., 2023, 1–11 Search PubMed.
- Y. Liu, R. Dong, Y. Ma, W. Liu, A. Zhu, P. Tan, Y. Bian, X. Xiong, E. Li and J. Pan, Int. J. Hydrogen Energy, 2019, 44, 25599–25606 CrossRef CAS.
- P. Tan, Y. Liu, A. Zhu, W. Zeng, H. Cui and J. Pan, ACS Sustainable Chem. Eng., 2018, 6, 10385–10394 CrossRef CAS.
- X. Hao, D. Xiang and Z. Jin, Dalton Trans., 2021, 50, 10501–10514 RSC.
- Z. Zhu, X. Li, Y. Qu, F. Zhou, Z. Wang, W. Wang, C. Zhao, H. Wang, L. Li, Y. Yao, Q. Zhang and Y. Wu, Nano Res., 2021, 14, 81–90 CrossRef CAS.
- X. Xiang, B. Zhu, B. Cheng, J. Yu and H. Lv, Small, 2020, 16, 2001024 CrossRef CAS.
- B. Parasuraman, B. Kandasamy, I. Murugan, M. S. Alsalhi, N. Asemi, P. Thangavelu and S. Perumal, Chemosphere, 2023, 334, 138979 CrossRef CAS.
- R. Yang, Y. Ji, L. Wang, G. Song, A. Wang, L. Ding, N. Ren, Y. Lv, J. Zhang and X. Yu, ACS Appl. Nano Mater., 2020, 3, 9268–9275 CrossRef CAS.
- Y. Qiu, Z. Xing, M. Guo, T. Zhao, Y. Wang, P. Chen, Z. Li, K. Pan and W. Zhou, J. Colloid Interface Sci., 2021, 582, 752–763 CrossRef CAS PubMed.
- Z. Dai, J. Lian, Y. Sun, L. Li, H. Zhang, N. Hu and D. Ding, Chem. Eng. J., 2022, 433, 133766 CrossRef CAS.
- Y. Su, X. Xu, R. Li, X. Luo, H. Yao, S. Fang, K. Peter Homewood, Z. Huang, Y. Gao and X. Chen, Chem. Eng. J., 2022, 429, 132241 CrossRef CAS.
- L. Li, K. Zhang, W. Jin, W. Xia, J. He and X. Zeng, Int. J. Hydrogen Energy, 2022, 47, 10594–10602 CrossRef CAS.
- T. Zhao, Z. Xing, Z. Xiu, Z. Li, S. Yang and W. Zhou, ACS Appl. Mater. Interfaces, 2019, 11, 7104–7111 CrossRef CAS PubMed.
- L. Xu, W.-q Chen, S.-q Ke, S.-m Zhang, M. Zhu, Y. Zhang, W.-y Shi, S. Horike and L. Tang, Chem. Eng. J., 2020, 382, 122810 CrossRef CAS.
- H. Hou, L. Wang, F. Gao, X. Yang and W. Yang, J. Mater. Chem. C, 2019, 7, 7858–7864 RSC.
- Q. Liang, C. Zhang, S. Xu, M. Zhou, Y. Zhou and Z. Li, J. Colloid Interface Sci., 2020, 577, 1–11 CrossRef CAS PubMed.
- H. Miao, H. Zong, X. Zhu, J. Chen, Z. Mo, W. Zhang, Z. Chen and H. Xu, New J. Chem., 2022, 46, 17704–17712 RSC.
- F. Dong, H. Liu, L. Qin, T. Zhang, X. Li and S.-Z. Kang, New J. Chem., 2023, 47, 13177–13185 RSC.
- C. Li, S. Yu, H. Dong, C. Liu, H. Wu, H. Che and G. Chen, Appl. Catal., B, 2018, 238, 284–293 CrossRef CAS.
- Z. Ren, X. Zhang, X. Shi, D. Yang, M.-H. Yu, W. Zheng and J. Zhang, New J. Chem., 2023, 47, 10506–10513 RSC.
- X. Yu, Z. Zhao, D. Sun, N. Ren, J. Yu, R. Yang and H. Liu, Appl. Catal., B, 2018, 227, 470–476 CrossRef CAS.
Footnote |
| † Electronic supplementary information (ESI) available. See DOI: https://doi.org/10.1039/d3nj03611a |
| This journal is © The Royal Society of Chemistry and the Centre National de la Recherche Scientifique 2024 |

