Diglycolamic acid for the mutual separation of lanthanides and actinides from dilute nitric acid solution: solvent extraction, dynamic light scattering, and spectroscopic investigations†
Anjan
Dhawa
ab,
Jammu
Ravi
 c,
R.
Puspalata
 bd,
N. R.
Jawahar
a and
K. A.
Venkatesan
 *bc
*bc
aIntegrated Nuclear Recycle Plant, Bhabha Atomic Research Centre Facilities, Kalpakkam 603102, India
bHomi Bhabha National Institute, Anushakthi Nagar, Mumbai 400094, India. E-mail: kavenkat@igcar.gov.in; Fax: +91 44 27480126; Tel: +91 44 27480500, Ext. 26857
cReprocessing Group, Indira Gandhi Centre for Atomic Research, Kalpakkam 603102, India
dWater and Steam Chemistry Division, Bhabha Atomic Research Centre Facilities, Kalpakkam 603102, India
First published on 22nd November 2023
Abstract
N,N-Dialkyl diglycolamic acid (HDRDGA) derivatives with alkyl groups varying from n-hexyl to n-dodecyl were synthesized, and the promising ligands such as N,N-dioctyl diglycolamic acid (HDODGA) and N,N-didecyl diglycolamic acid (HD2DGA) were investigated for the mutual separation of trivalent lanthanides and actinides from dilute nitric acid solution. Since diglycolamic acid is strongly polar, it was dissolved in a traditional diluent, n-dodecane, with the help of an isodecyl alcohol (IDA) phase modifier. Nevertheless, the hexyl and didodecyl derivatives were sparingly soluble even in the presence of 30% (v/v) IDA in n-dodecane, and therefore, the extraction behavior of the lanthanide and actinide representatives, Eu(III) and Am(III), respectively, was studied only in a solution of HDODGA or HD2DGA present in 30% (v/v) IDA/n-dodecane. The cation-exchange mechanism of extraction and the stoichiometry of trivalent metal to HDRDGA were elucidated from the slope analysis of the extraction data. Since the stoichiometry of the metal to ligand complex in the organic phase was unusually varied from 1![[thin space (1/6-em)]](https://www.rsc.org/images/entities/char_2009.gif) :
:![[thin space (1/6-em)]](https://www.rsc.org/images/entities/char_2009.gif) 3 to 1
3 to 1![[thin space (1/6-em)]](https://www.rsc.org/images/entities/char_2009.gif) :
:![[thin space (1/6-em)]](https://www.rsc.org/images/entities/char_2009.gif) 6 depending upon the Nd(III) loading into the organic phase, the reverse micellar aggregation behavior and the coordination chemistry of Nd(III) in the organic phase were probed by dynamic light scattering and visible spectroscopy, respectively. The results revealed that three molecules of anionic DRDGA were coordinated to Nd(III) in the inner-sphere at lower metal concentrations, and also three more molecules of HDRDGA in the outer-sphere at higher metal concentrations. The good separation factor achieved with the use of these ligands showed their potential ability to separate lanthanides from actinides in nitric acid medium.
6 depending upon the Nd(III) loading into the organic phase, the reverse micellar aggregation behavior and the coordination chemistry of Nd(III) in the organic phase were probed by dynamic light scattering and visible spectroscopy, respectively. The results revealed that three molecules of anionic DRDGA were coordinated to Nd(III) in the inner-sphere at lower metal concentrations, and also three more molecules of HDRDGA in the outer-sphere at higher metal concentrations. The good separation factor achieved with the use of these ligands showed their potential ability to separate lanthanides from actinides in nitric acid medium.
1 Introduction
The High-Level Liquid Waste (HLLW) generated during reprocessing of spent nuclear fuel is composed of trivalent actinides, lanthanides along with other radioactive and stable fission products, and corrosion products, in 3–4 M nitric acid medium.1 The separation of long-lived trivalent actinides (Am and Cm isotopes) from HLLW followed by their transmutation is essential for reducing the long-term radiotoxicity of HLLW and for the safe management of HLLW.2,3 However, the separation of actinides alone from HLLW is quite difficult due to the concentration level of nitric acid (3–4 M) prevailing in HLLW. In addition, the chemical similarity of lanthanides with actinides also pose challenges during the separation as described elsewhere.4 Therefore, the present approach for the separation of trivalent actinides from HLLW involves the group extraction of lanthanides and actinides together from HLLW in the first step using diglycolamide extractant in n-dodecane,5–7 followed by the mutual separation of lanthanides and actinides in the second step using acidic-type extractants.8,9 In this context, the pioneering work of trivalent group separation from nitric acid and HLLW was reported by Sasaki et al.10–13 and others.14 The extracted metals from the diglycolamide phase were then recovered using dilute nitric acid (0.01 to 0.1 M), which serves as the feed for the mutual separation of lanthanides and actinides using acidic-type extractants. It is realized that the complete removal of lanthanides from actinides is essential for the effective transmutation of actinides in fast reactors and accelerator driven sub-critical systems, due to reasons described elsewhere.15 The literature indicates that it is desirable to formulate the actinide target devoid of lanthanides or restrict the lanthanide content to less than 0.2% in the actinide target employed for transmutation.Although both trivalent lanthanides and actinides are classified as hard acids according to the Pearson's Hard-Soft Acid Base (HSAB) concept, the actinides being relatively bigger in size, they are regarded as soft metal ions as compared to their lanthanide counterparts. Therefore, the hard lanthanide ions prefer to form complexes with relatively hard oxygen donor ligands as compared to the soft nitrogen or sulphur ones for actinides.16–19 The marginal difference in selectivity of oxygen donors towards lanthanides, and nitrogen donors towards actinides, was first exploited for the mutual separation of trivalent lanthanides and actinides in a TALSPEAK (Trivalent Actinide-Lanthanide Separation by Phosphorous reagent Extraction from Aqueous Komplexes) and reverse TALSPEAK process.8,20 The other processes developed later used organophosphorus ligands, which also exploited the TALSPEAK strategy for mutual separation.21–25 However, these organophosphorus ligands pose several technical problems during the disposal of spent organic waste, as they are not completely incinerable. Therefore, there was a need to develop advanced ligands, which are made up of CHON-atoms, for easy disposal of spent organic waste.
Alkyl diglycolamic acid (HDRDGA) derivatives are an advanced class of acidic CHON-based ligands, extensively studied in the recent past for the mutual separation of lanthanides and actinides from dilute nitric acid solution.26–29 Unlike the organophosphorus ligand employed in a TALSPEAK process, the alkyl diglycolamic acid ligands contain amidic carbonyl, etheric, and carboxylic acid coordinating sites for the extraction of trivalent f-ions from aqueous solutions. In view of the tridentate coordination and incinerable nature of HDRDGA, there is an increased interest in studies related to the extraction of trivalent f-ions from nitric acid solutions. Moreover, these ligands have also been explored for the single-cycle separation of trivalent actinides directly from HLLW using a binary solvent system comprising HDRDGA and diglycolamide.30
Since these diglycolamic acid ligands contain strongly polar amidic and carboxylic acid groups, they tend to undergo reverse micellar aggregation in a conventional non-polar diluent, n-dodecane, employed for spent fuel reprocessing applications. Therefore, these ligands require phase modifiers, such as long-chain alcohol, in significant concentrations for dissolving the diglycolamic acid in n-dodecane medium, or an aromatic diluent instead of n-dodecane, as employed in a TALSPEAK process. Nevertheless, the tendency of reverse micellar aggregation in any organic phase usually increases with the increase in the extraction of nitric acid and metal ions in the organic phase, as discussed elsewhere.31–36 Extensive aggregation of reverse micelles leads to either third phase formation or precipitation, which is an undesirable event in a solvent extraction process. Therefore, there is a need to understand the behavior of reverse micellar aggregation in the organic phase when diglycolamic acid is employed for the extraction of trivalent f-ions.
However, studies on the aggregation behavior of HDRDGA in the organic phase are not available in the literature, and moreover, studies related to the mutual separation of lanthanides and actinides by alkyl diglycolamic acid from nitric acid medium are very limited. To unravel the unknown, N,N-dialkyl diglycolamic acid derivatives with alkyl groups varying from n-hexyl to n-dodecyl were synthesized and studied for the extraction of Eu(III) and Am(III) from nitric acid solution using N,N-dioctyl diglycolamic acid (HDODGA) or N,N-didecyl diglycolamic acid (HD2DGA) ligands present in 30% (v/v) isodecyl alcohol/n-dodecane. The hexyl and dodecyl derivatives of HDRDGA could not be employed for solvent extraction studies as they were sparingly soluble in 30% (v/v) IDA/n-dodecane. The results obtained from the studies are reported in this paper.
2 Experimental
2.1 Materials and methods
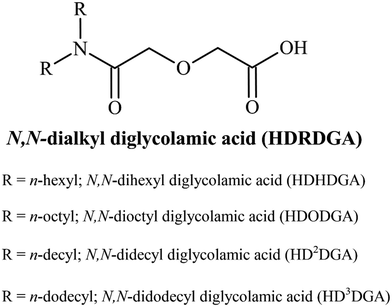
All the chemicals and reagents employed in the present study were of analytical grade. The precursors employed for the synthesis of HDRDGA, such as N,N-dialkyl amines and diglycolic anhydride, were purchased from Sigma Aldrich, India. N,N-Didodecyl amine was purchased from TCI Chemicals, India. The extractants were synthesized and purified by a procedure described elsewhere.37 The yield of the product was 95 to 100%, depending upon the nature of N,N-dialkyl amines employed for the reaction. The general structure of HDRDGA is shown in Fig. 1.The 241Am(III) radiotracer was separated from the aged plutonium (mixed isotopes) nitrate stock solution using an anion-exchange technique with a Dowex® 1 × 8 resin (100–200 mesh size), which was purchased from Alfa Aesar, India. The 152Eu(III) radiotracer was procured from Laboratoire d'Etalons d'Activité, France. The radiochemical purity of 152Eu(III) was ascertained by recording the gamma spectrum of 152Eu with a High Purity Germanium (HPGe) detector (Canberra, USA) coupled with a multi-channel analyzer. The purity of 241Am(III) radiotracer was verified by the alpha spectrum (241Am alpha energy: 5.486 MeV) recorded in a Passivated Implanted Planar Silicon (PIPS) detector (ORTEC®, USA). The absence of any alpha energy peaks of plutonium isotopes confirmed the purity of 241Am(III) separated from the plutonium nitrate solution. Neodymium(III) nitrate hexahydrate (Nd(NO3)3·6H2O, 99.9%) and n-dodecane were purchased from Sigma Aldrich, India. Isodecyl alcohol (IDA, 98%) was procured from M/s Orion Chemicals, India. The concentrated stock solution of Nd(III) was prepared by dissolving the required quantity of Nd(NO3)3·6H2O in 1.0 M nitric acid. The concentration of Nd(III) in the stock solution was determined by a standard complexometric titration method using 0.01 M EDTA and methyl thymol blue indicator in a buffer solution of pH ∼ 6 (pH adjusted using a saturated solution of hexamethylenetetramine). The Nd(III) stock solution was further diluted to prepare the Nd(III) solution of the desired concentration in nitric acid. The free acidity of nitric acid present in Nd(III) solution was estimated by acid–base titration in the presence of 10% potassium oxalate for masking Nd(III).
2.2 Solubility optimization
The alkyl derivatives of N,N-dialkyl diglycolamic acid (HDRDGA) extractants are strongly polar due to the presence of a carboxylic acid functional group, and therefore they are not completely soluble in a non-polar diluent, n-dodecane, at room temperature. Therefore, a long-chain alcohol, such as isodecyl alcohol (IDA), was added to the n-dodecane phase to enhance the solubility of the extractant in the n-dodecane medium. The solubility of HDRDGA in n-dodecane was studied as a function of the volume percentage of IDA in organic phase at 298 K. A solution of HDRDGA in IDA/n-dodecane was prepared by accurately weighing the extractants into the volumetric flask, followed by the addition of the required volume of IDA. The mixture was diluted with n-dodecane and the homogeneity of the resultant solution was ascertained by visual observation.2.3 Solvent extraction studies
All the extraction studies were conducted in duplicate at 298 K. The experiments involved equilibrating equal volumes of organic and aqueous phases in a 10-mL capacity stoppered equilibration tube. The organic phase composed of either HDODGA or HD2DGA (0.05 to 0.2 M) in 30% IDA/n-dodecane, was pre-equilibrated with an equal volume of nitric acid solution (0.001 to 3 M) prior to the extraction studies. The pre-equilibrated organic phase was then equilibrated with nitric acid solutions spiked with either 152Eu(III) or 241Am(III) radiotracer for studying the extraction behavior of Eu(III) and Am(III) in the organic phase. After extraction, the organic and aqueous phases were allowed to settle for about 5 minutes, and an aliquot of known volume was taken from both phases to determine the gross gamma radioactivity. The gamma radioactivity was measured using a well-type NaI(Tl) scintillation detector coupled with a single-channel analyzer. The distribution ratio (DM) of metal ions (M = Eu(III) or Am(III)) was determined using eqn (1). | (1) |
The rate of extraction of Eu(III) and Am(III) was studied by equilibrating the organic phase and aqueous phase as discussed above. At different intervals of time, the samples were drawn from organic and aqueous phases. From the measurement of radioactivity of 152Eu(III) and 241Am(III) present in these phases, it was found that the equilibrium was achieved in ten minutes. However, all the equilibration experiments reported in the present study were carried out for sixty minutes to ensure the establishment of equilibrium.
The effect of nitrate ion concentration on the extraction of Am(III) was studied in both HDODGA and HD2DGA solvent systems as a function of nitrate ion concentration in the aqueous phase. The organic phase (0.05 M HDODGA in 30% IDA/n-dodecane or 0.05 M HD2DGA in 30% IDA/n-dodecane) was pre-equilibrated with 0.02 M nitric acid. The pre-equilibrated organic phase was equilibrated with an aqueous solution containing sodium nitrate (0.01 M to 0.1 M) and 0.02 M nitric acid spiked with 241Am(III) tracer. The distribution ratio of Am(III) was determined as discussed above.
2.4 Nd(III) loading studies
For studying the loading behavior of Nd(III) in the organic phase composed of either HDODGA or HD2DGA (0.05 to 0.2 M) in 30% IDA/n-dodecane, the organic phase was pre-equilibrated with an equal volume of nitric acid solution (0.001 to 3 M) in the absence of Nd(III) to fix the equilibrium acidity to the organic phase. This pre-equilibrated organic phase was then equilibrated with an equal volume of nitric acid solution containing the desired concentration of Nd(III). The concentration of Nd(III) in nitric acid solution was varied from 10 to 200 mM. The Nd(III) concentration in both aqueous and organic phases was determined by the EDTA complexometric titration method, as discussed in Section 2.1. During the determination of Nd(III) concentration in the organic phase, a water-ethanol (1![[thin space (1/6-em)]](https://www.rsc.org/images/entities/char_2009.gif) :
:![[thin space (1/6-em)]](https://www.rsc.org/images/entities/char_2009.gif) 1) mixture was employed for phase homogenization and to make the titration medium compatible with EDTA.
1) mixture was employed for phase homogenization and to make the titration medium compatible with EDTA.
2.5 Dynamic light scattering studies
The dynamic light scattering (DLS) technique is widely adopted for the determination of the average size of the reverse micellar aggregates and their distribution in a homogeneous organic solution.31–35 The aggregates dispersed in an organic phase remain under constant Brownian motion causing fluctuations in the intensity of their scattered light. The average aggregate size and size distribution of these aggregates in the organic phase can be determined using the data on fluctuations of the intensity at a particular angle and using the Stokes–Einstein expression given in eqn (2).38 | (2) |
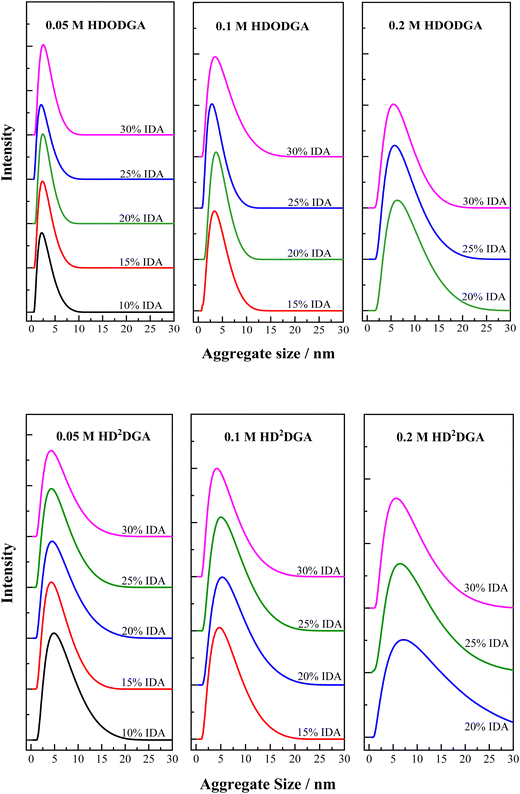
All the DLS experiments in the present study were performed with a Nano-ZS Zeta-sizer instrument (Malvern Panalytical, UK) equipped with a 4 mW monochromatic He–Ne laser beam of wavelength 633 nm. Typically, 1–2 mL of the organic sample was taken in a well-cleaned quartz cuvette (10 mm path length) and subjected to DLS studies to obtain information about the average size and size distribution of the aggregates. The self-aggregation behavior of the organic phase was studied as a function of the concentration of extractant and volume percentage of IDA in the organic phase. In a similar way, the nitric acid-equilibrated and Nd(III)-loaded organic phases were also subjected to DLS measurements, and the aggregate size distribution was studied as a function of aqueous phase acidity and the amount of Nd(III) extracted into the organic phase. All the samples were filtered through a MillexGV 0.22 μm disposable PVDF membrane syringe filter (Aldrich make) prior to DLS measurement to remove the dust particles, if any. The viscosity (1.37 mPa.s) and refractive index (1.42) of n-dodecane were considered as a feed data for DLS measurements. The scattered light intensity was measured using an avalanche photodiode (APD) detector at a back-scattering angle of 173° (non-invasive back-scatter technique) with time. All experiments were performed in manual mode at a constant temperature of 298 K and repeated at least six times to ensure reproducibility, with each measurement composed of 20 runs (10 s run duration without any delay between the measurements). A general-purpose analysis model was used for processing the data. The results were verified using the NIST standard polystyrene latex particles (60 nm particle size) dispersed in aqueous solution before and after each experiment, and the observed data was found to be in good agreement with the standard deviation of ±5%.
2.6 Visible spectroscopic studies
The visible absorption spectrum of Nd(III) present in nitric acid and the organic phase was recorded using a double-beam UV-visible spectrophotometer (Hitachi, Japan), with a resolution of 0.1 nm. The samples were taken in a glass cuvette of 10 mm path length. A blank spectrum was recorded in the absence of Nd(III) under similar experimental conditions prior to each experiment to obtain the blank corrected spectrum in all cases. The spectra of 100 mM Nd(III) present in nitric acid solutions (0.001 to 10 M) were recorded before making contact with the organic phase. The organic phase (0.2 M HDODGA or HD2DGA in 30% IDA/n-dodecane) was equilibrated with nitric acid (0.001 to 3 M) containing 100 mM Nd(III), and the equilibrated organic phase was employed for recording Nd(III) spectra. The visible absorption spectrum of 40 mM Nd(III) in 0.001 M and 10 M nitric acid solutions was also recorded to compare with the spectral characteristics of Nd(III) in the organic phase at 0.001 M nitric acid for understanding the role of nitric acid and HDRDGA ligands in affecting the coordination environment of Nd(III) ions.3 Results and discussion
3.1 Solubility optimization
The organic phase employed for solvent extraction applications is composed of a homogeneous solution of the extractant present in an aqueous immiscible diluent, usually n-dodecane. Considering the low solubility of N,N-dialkyl diglycolamic acid (HDRDGA) extractants in n-dodecane under ambient conditions, the organic phase modifier such as isodecyl alcohol (IDA) was added to improve the solubility. Table 1 shows the solubility of HDRDGA at different volume percentages of IDA in n-dodecane at 298 K. The results show that the solubility of HDRDGA in n-dodecane increases with an increase in the volume percentage of IDA in the organic phase. However, it is important to note that the extractant, N,N-dihexyl diglycolamic acid (HDHDGA), is not soluble even in the presence of 30% (v/v) IDA in n-dodecane. This could be attributed to the poor solvation of the HDHDGA molecule by IDA-n-dodecane. The solubility of N,N-dioctyl diglycolamic acid (HDODGA) and N,N-didecyl diglycolamic acid (HD2DGA) in the organic phase increases with an increase in the volume percentage of IDA and decreases with an increase in the concentration of HDODGA and HD2DGA in the organic phase. Both these diglycolamic acid extractants are completely soluble in the organic phase containing 20% (v/v) of IDA in n-dodecane at all concentrations (0.05 to 0.2 M) investigated in the present study. However, it is desirable to employ 30% (v/v) IDA in n-dodecane for the solvent extraction of trivalents from nitric acid solution, as the 20% (v/v) IDA in n-dodecane could be susceptible to organic phase splitting during the course of extraction. In contrast to all the above observations, N,N-didodecyl diglycolamic acid (HD3DGA) is poorly soluble in IDA-n-dodecane solvent at all the IDA compositions investigated in the present study. Even though the addition of 30% (v/v) IDA improves the solubility of HD3DGA in n-dodecane to some extent at a lower concentration (at 0.05 M), it is not adequate for solvent extraction applications. Considering the poor solubility of both HDHDGA and HD3DGA in 30% IDA/n-dodecane, the extraction studies were conducted only with HDODGA and HD2DGA ligands present in 30% IDA/n-dodecane.| [HDRDGA] | % IDA in n-dodecane | |||||
|---|---|---|---|---|---|---|
| 5% | 10% | 15% | 20% | 25% | 30% | |
| 0.05 M HDHDGA | SS | |||||
| 0.1 M HDHDGA | ||||||
| 0.2 M HDHDGA | ||||||
| 0.05 M HDODGA | SS | S | S | S | S | S |
| 0.1 M HDODGA | SS | SS | S | S | S | S |
| 0.2 M HDODGA | SS | SS | SS | S | S | S |
| 0.05 M HD2DGA | SS | S | S | S | S | S |
| 0.1 M HD2DGA | SS | SS | S | S | S | S |
| 0.2 M HD2DGA | SS | SS | SS | S | S | S |
| 0.05 M HD3DGA | SS | SS | SS | S | S | S |
| 0.1 M HD3DGA | SS | SS | SS | SS | SS | S |
| 0.2 M HD3DGA | SS | SS | SS | SS | SS | SS |
3.2 Solvent extraction studies
The effect of nitrate ion concentration on the distribution ratio of Am(III) was studied in a solvent phase composed of 0.05 M HDODGA or HD2DGA in 30%IDA/n-dodecane from 0.02 M nitric acid, and the results are depicted in Fig. S1 (ESI†). It can be seen that the variation in the distribution ratio of Am(III) with nitrate ion concentration is insignificant. The DAm value is in the range of 1.96 to 2.14 at all nitrate ion concentrations in the case of HDODGA, whereas the distribution ratio of Am(III) remains at 0.023 in the case of HD2DGA system. The results therefore indicate that there is no significant effect of nitrate ion concentration on the extraction of Am(III) in HDODGA or HD2DGA solvent systems, confirming that nitrate ion is not participating in the extraction of trivalent f-ion.
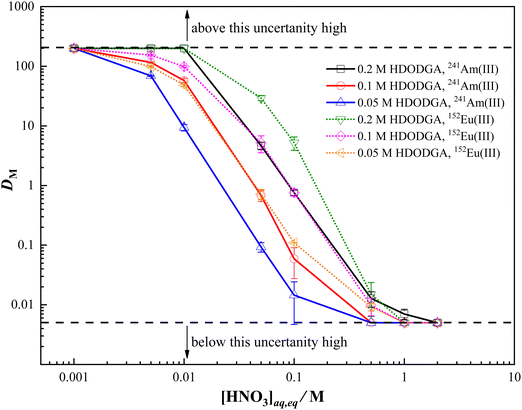
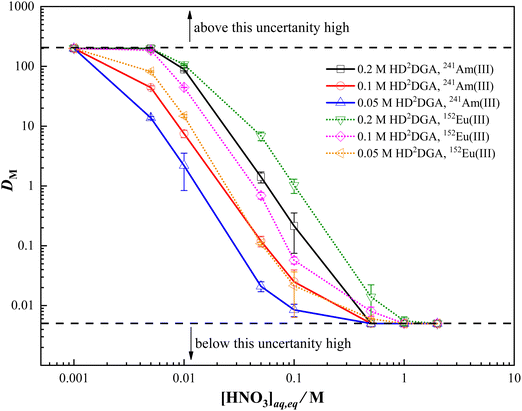
For back-extraction of Eu(III) and Am(III), the loaded organic phase was contacted with 1 M nitric acid as the stripping agent. Since the distribution ratio of Eu(III) and Am(III) is very low at a nitric acid concentration of 1 M and above (Fig. 2 and 3), 1 M nitric acid was employed for stripping. The results revealed that quantitative recovery of Eu(III) and Am(III) was achieved in two contacts of the loaded organic phase with 1 M nitric acid.
Table 2 shows the separation factor of Eu(III) over Am(III) achieved in the organic phase at different concentrations of nitric acid. Since the distribution ratio of both Eu(III) and Am(III) is low at nitric acid concentrations ≥0.5 M, the separation factor achieved at nitric acid concentrations of 0.5 M and above, is quite low. Again, quantitative extraction of both Eu(III) and Am(III) in the organic phase at nitric acid concentrations ≤0.01 M also results in a poor separation factor. However, a reasonable separation factor (5 to 12) of Eu(III) over Am(III) is achieved in the nitric acid concentration range from 0.01 to 0.5 M, as shown in Table 2. Considering the separation factors and distribution ratios achieved in both extractant systems, HDODGA appears to be a superior extractant in comparison with HD2DGA for the mutual separation of trivalent lanthanides and actinides from dilute nitric acid solution.
| [HNO3]eq/M | Separation factor of Eu(III) over Am(III) | |||||
|---|---|---|---|---|---|---|
| [HDODGA]/M | [HD2DGA]/M | |||||
| 0.05 | 0.1 | 0.2 | 0.05 | 0.1 | 0.2 | |
| 0.005 | 1.44 ± 0.03 | 1.33 ± 0.02 | 1.0 | 5.95 ± 0.35 | 4.21 ± 0.14 | 1.0 |
| 0.01 | 5.16 ± 0.2 | 1.71 ± 0.03 | 1.0 | 6.74 ± 0.25 | 5.93 ± 0.41 | 1.21 ± 0.04 |
| 0.05 | 7.74 ± 0.65 | 7.79 ± 0.73 | 6.32 ± 0.48 | 5.24 ± 0.72 | 5.75 ± 0.42 | 4.75 ± 0.36 |
| 0.10 | 7.86 ± 0.32 | 12.77 ± 0.84 | 6.95 ± 0.82 | 2.47 ± 0.26 | 2.28 ± 0.17 | 4.86 ± 0.33 |
| 0.50 | 1.84 ± 0.11 | 1.94 ± 0.08 | 1.15 ± 0.17 | 1.2 | 1.6 ± 0.14 | 2.8 ± 0.28 |
 | (3) |
 | (4) |
 | (5) |
log![[thin space (1/6-em)]](https://www.rsc.org/images/entities/char_2009.gif) DM = log DM = log![[thin space (1/6-em)]](https://www.rsc.org/images/entities/char_2009.gif) K − n K − n![[thin space (1/6-em)]](https://www.rsc.org/images/entities/char_2009.gif) log[H+]aq + n log[H+]aq + n![[thin space (1/6-em)]](https://www.rsc.org/images/entities/char_2009.gif) log[HDRDGA]org log[HDRDGA]org | (6) |
log![[thin space (1/6-em)]](https://www.rsc.org/images/entities/char_2009.gif) DM = log DM = log![[thin space (1/6-em)]](https://www.rsc.org/images/entities/char_2009.gif) K1 + n K1 + n![[thin space (1/6-em)]](https://www.rsc.org/images/entities/char_2009.gif) log[HDRDGA]org log[HDRDGA]org | (7) |
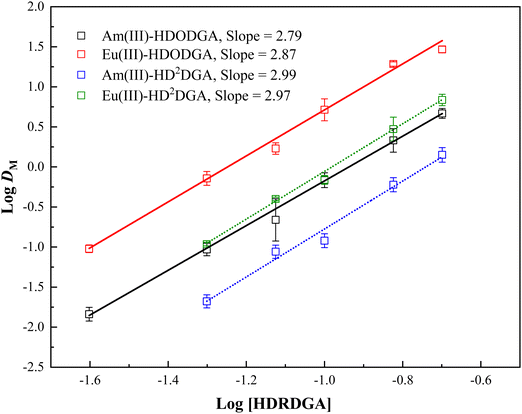
![[thin space (1/6-em)]](https://www.rsc.org/images/entities/char_2009.gif) DMvs. log[HA]org would result in a straight line with a slope of n, where n represents the metal to ligand stoichiometry. Fig. 4 shows the plot of log
DMvs. log[HA]org would result in a straight line with a slope of n, where n represents the metal to ligand stoichiometry. Fig. 4 shows the plot of log![[thin space (1/6-em)]](https://www.rsc.org/images/entities/char_2009.gif) DMvs. log[HDRDGA] at a constant equilibrium concentration of nitric acid (0.05 M) in the aqueous phase. The linear regression analysis of the extraction data resulted in a slope of ∼3. This indicates that the trivalent actinides and lanthanides form ternary complexes with both diglycolamic acid extractants. A similar result was also reported by Shimojo et al. for the extraction of trivalent lanthanides in HDODGA.26
DMvs. log[HDRDGA] at a constant equilibrium concentration of nitric acid (0.05 M) in the aqueous phase. The linear regression analysis of the extraction data resulted in a slope of ∼3. This indicates that the trivalent actinides and lanthanides form ternary complexes with both diglycolamic acid extractants. A similar result was also reported by Shimojo et al. for the extraction of trivalent lanthanides in HDODGA.26
![[thin space (1/6-em)]](https://www.rsc.org/images/entities/char_2009.gif) :
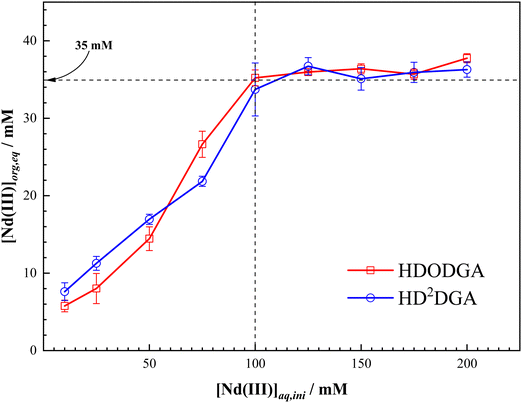
:![[thin space (1/6-em)]](https://www.rsc.org/images/entities/char_2009.gif) 3 Nd(III) to HDRDGA stoichiometry obtained in the slope analysis of the extraction data, the 0.2 M solution of HDODGA or HD2DGA can extract about ∼66 mM of Nd(III) in the organic phase. However, the results shown in Fig. 5 indicate that the maximum loading of Nd(III) is ∼35 mM in the organic phase at 0.005 M nitric acid. This value (35 mM) corresponds to the stoichiometry of 1
3 Nd(III) to HDRDGA stoichiometry obtained in the slope analysis of the extraction data, the 0.2 M solution of HDODGA or HD2DGA can extract about ∼66 mM of Nd(III) in the organic phase. However, the results shown in Fig. 5 indicate that the maximum loading of Nd(III) is ∼35 mM in the organic phase at 0.005 M nitric acid. This value (35 mM) corresponds to the stoichiometry of 1![[thin space (1/6-em)]](https://www.rsc.org/images/entities/char_2009.gif) :
:![[thin space (1/6-em)]](https://www.rsc.org/images/entities/char_2009.gif) 6 of Nd(III)-to-HDRDGA in the organic phase.
6 of Nd(III)-to-HDRDGA in the organic phase.
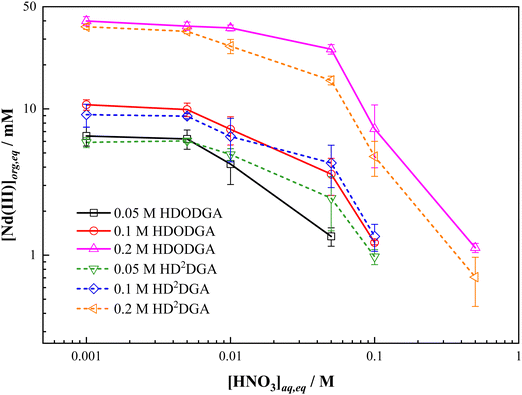
Considering the maximum loading of Nd(III) in the organic phase achieved at the initial Nd(III) concentration of 100 mM and above from 0.005 M nitric acid solution, the influence of the aqueous phase acidity on the maximum loading of Nd(III) was studied at a fixed initial concentration of Nd(III) (i.e., 100 mM) in nitric acid at 298 K, and the results are shown in Fig. 6. It can be seen that the loading of Nd(III) into the organic phase decreases with an increase in the concentration of nitric acid in the aqueous phase, which could be due to the shift of equilibrium shown in eqn (3) in the backward direction. Fig. 6 also shows the variation in the loading of Nd(III) into the organic phase as a function of the concentration of the extractant, ranging from 0.05 to 0.2 M. The Nd(III) loading into the organic phase increases with an increase in the concentration of extractant in the organic phase at any given acidity in both HDRDGA systems. It is important to note that the loading capacity of HDODGA is marginally higher than that observed for HD2DGA under similar extraction conditions. However, this difference diminishes at lower extractant concentrations, as shown in Fig. 6.
3.3 Dynamic light scattering studies
| [HDODGA]/M | % IDA | Z avg/nm | FWHM/nm |
|---|---|---|---|
| 0.05 | 10% | 2.82 ± 0.11 | 2.68 ± 0.06 |
| 15% | 2.69 ± 0.04 | 2.74 ± 0.06 | |
| 20% | 2.76 ± 0.07 | 2.56 ± 0.08 | |
| 25% | 2.46 ± 0.07 | 2.54 ± 0.08 | |
| 30% | 2.97 ± 0.11 | 2.81 ± 0.11 | |
| 0.1 | 10% | — | — |
| 15% | 4.23 ± 0.09 | 3.88 ± 0.10 | |
| 20% | 4.04 ± 0.11 | 3.70 ± 0.16 | |
| 25% | 3.25 ± 0.07 | 3.20 ± 0.10 | |
| 30% | 4.18 ± 0.04 | 4.45 ± 0.08 | |
| 0.2 | 10% | — | — |
| 15% | — | — | |
| 20% | 7.29 ± 0.06 | 7.35 ± 0.08 | |
| 25% | 6.65 ± 0.17 | 6.50 ± 0.23 | |
| 30% | 6.17 ± 0.11 | 6.07 ± 0.11 |
| [HD2DGA]/M | % IDA | Z avg/nm | FWHM/nm |
|---|---|---|---|
| 0.05 | 10% | 5.68 ± 0.18 | 5.91 ± 0.08 |
| 15% | 4.94 ± 0.08 | 5.06 ± 0.13 | |
| 20% | 5.36 ± 0.14 | 5.58 ± 0.14 | |
| 25% | 5.07 ± 0.04 | 5.32 ± 0.08 | |
| 30% | 5.06 ± 0.01 | 5.16 ± 0.18 | |
| 0.1 | 10% | — | — |
| 15% | 5.42 ± 0.12 | 5.78 ± 0.14 | |
| 20% | 6.15 ± 0.14 | 6.47 ± 0.06 | |
| 25% | 5.91 ± 0.13 | 6.14 ± 0.04 | |
| 30% | 5.06 ± 0.17 | 5.20 ± 0.07 | |
| 0.2 | 10% | — | — |
| 15% | — | — | |
| 20% | 7.84 ± 0.16 | 9.83 ± 0.23 | |
| 25% | 7.55 ± 0.20 | 8.62 ± 0.10 | |
| 30% | 6.78 ± 0.10 | 7.43 ± 0.08 |
| [HNO3]eq/M | HDODGA | HD2DGA | ||
|---|---|---|---|---|
| Z avg/nm | FWHM/nm | Z avg/nm | FWHM/nm | |
| 0.001 | 7.43 ± 0.21 | 8.08 ± 0.13 | 9.02 ± 0.27 | 9.72 ± 0.38 |
| 0.005 | 7.80 ± 0.16 | 8.12 ± 0.06 | 8.30 ± 0.25 | 9.02 ± 0.14 |
| 0.01 | 7.15 ± 0.10 | 7.44 ± 0.28 | 8.25 ± 0.14 | 8.77 ± 0.03 |
| 0.05 | 6.89 ± 0.08 | 7.39 ± 0.03 | 7.63 ± 0.31 | 7.88 ± 0.14 |
| 0.10 | 5.93 ± 0.11 | 5.96 ± 0.17 | 7.23 ± 0.13 | 7.46 ± 0.07 |
| 0.50 | 5.33 ± 0.07 | 4.68 ± 0.08 | 5.96 ± 0.20 | 5.92 ± 0.17 |
| 1.01 | 4.49 ± 0.07 | 4.48 ± 0.14 | 5.74 ± 0.07 | 5.70 ± 0.06 |
| 1.99 | 4.96 ± 0.07 | 4.83 ± 0.11 | 5.77 ± 0.03 | 5.61 ± 0.14 |
| 2.98 | 4.87 ± 0.17 | 4.79 ± 0.08 | 5.50 ± 0.20 | 5.02 ± 0.14 |
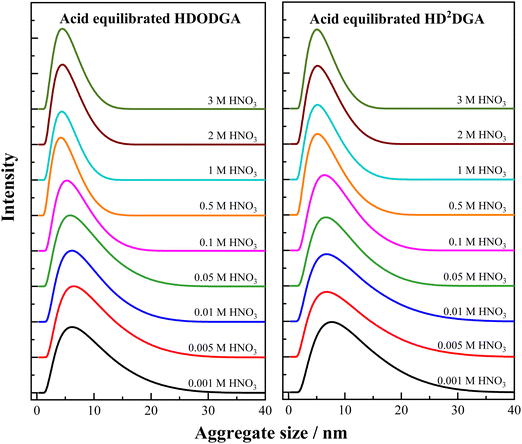
It is also interesting to note that the aggregate size observed at higher nitric acid concentrations ranging from 1 to 3 M is smaller than the self-aggregate size of the extractant present in the organic phase at the same concentration. For instance, the average self-aggregate size of 0.2 M HDODGA in 30% IDA/n-dodecane is 6.17 nm (see Table 3), which is higher than the average size of the aggregate (4.87 nm) observed at 3 M nitric acid (see Table 5). This observation indicates that the presence of nitric acid (1 to 3 M) in the aqueous phase suppresses the dissociation of protons in HDODGA and HD2DGA molecules present in the organic phase. Comparing the average aggregate size observed in Table 5 and the self-aggregate size reported in Tables 3 and 4, the study shows that the proton dissociation of HDODGA and HD2DGA is facilitated only at nitric acid concentrations ≤ 0.1 M. Under this condition, the aggregate size observed for the acid-equilibrated organic phase is higher than that observed for self-aggregates. Therefore, the study also shows that the extraction of metal ions is facilitated at nitric acid concentrations ≤ 0.1 M, as shown in Fig. 2, 3 and 6, since the cation-exchange mechanism is responsible for the extraction of metal ions, as shown in eqn (3).
![[thin space (1/6-em)]](https://www.rsc.org/images/entities/char_2009.gif) :
:![[thin space (1/6-em)]](https://www.rsc.org/images/entities/char_2009.gif) 6 for Nd(III)
6 for Nd(III)![[thin space (1/6-em)]](https://www.rsc.org/images/entities/char_2009.gif) :
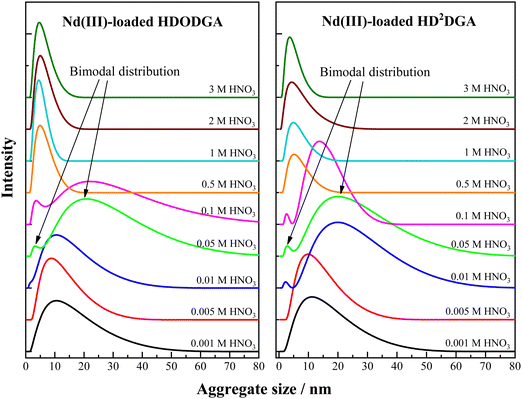
:![[thin space (1/6-em)]](https://www.rsc.org/images/entities/char_2009.gif) HDRDGA. Under this condition, the average aggregate size is ∼12 nm with a FWHM of ∼14 nm. The increase in average aggregate size and significant increase in FWHM observed in the present case as compared to those observed at higher nitric acid concentrations (see Table 5), could be due to the formation of Nd(DRDGA)3·(HDRDGA)x aggregates of widely differing compositions, but yielding an average stoichiometry of ∼1
HDRDGA. Under this condition, the average aggregate size is ∼12 nm with a FWHM of ∼14 nm. The increase in average aggregate size and significant increase in FWHM observed in the present case as compared to those observed at higher nitric acid concentrations (see Table 5), could be due to the formation of Nd(DRDGA)3·(HDRDGA)x aggregates of widely differing compositions, but yielding an average stoichiometry of ∼1![[thin space (1/6-em)]](https://www.rsc.org/images/entities/char_2009.gif) :
:![[thin space (1/6-em)]](https://www.rsc.org/images/entities/char_2009.gif) 6. Here “x” represents the number of neutral HDRDGA molecules involved in the extraction of Nd(III) in the organic phase at 0.001 to 0.005 M nitric acid. Therefore, the aggregate size and FWHM of the aggregate size distribution increased with an increase in the loading of Nd(III) into the organic phase at lower nitric acid concentrations.
6. Here “x” represents the number of neutral HDRDGA molecules involved in the extraction of Nd(III) in the organic phase at 0.001 to 0.005 M nitric acid. Therefore, the aggregate size and FWHM of the aggregate size distribution increased with an increase in the loading of Nd(III) into the organic phase at lower nitric acid concentrations.
| HDODGA | |||
|---|---|---|---|
| [HNO3]eq/M | [Nd(III)]org,eq/mM | Z avg/nm | FWHM/nm |
| a The two values in Zavg and FWHM are due to bimodal distribution. | |||
| 0.001 | 39.92 ± 2.88 | 12.25 ± 0.47 | 15.30 ± 0.16 |
| 0.005 | 36.82 ± 2.40 | 10.96 ± 0.41 | 11.40 ± 0.40 |
| 0.01 | 35.77 ± 1.68 | 15.55 ± 0.27 | 14.55 ± 0.10 |
| 0.05 | 25.60 ± 1.94 | 3.35 ± 0.08, 22.75 ± 0.33a | 1.16 ± 0.03, 27.13 ± 0.17a |
| 0.10 | 7.31 ± 3.34 | 2.83 ± 0.10, 19.34 ± 0.16a | 2.03 ± 0.17, 29.74 ± 0.34a |
| 0.50 | 1.12 ± 0.08 | 5.55 ± 0.17 | 5.61 ± 0.18 |
| 1.01 | <0.50 | 4.81 ± 0.28 | 4.35 ± 0.24 |
| 1.99 | <0.50 | 5.71 ± 0.20 | 5.44 ± 0.10 |
| 2.98 | <0.50 | 5.35 ± 0.14 | 5.16 ± 0.07 |
| HD2DGA | |||
|---|---|---|---|
| [HNO3]eq/M | [Nd(III)]org,eq/mM | Z avg/nm | FWHM/nm |
| a The two values in Zavg and FWHM are due to bimodal distribution. | |||
| 0.001 | 36.43 ± 1.45 | 12.81 ± 0.25 | 15.61 ± 0.10 |
| 0.005 | 33.88 ± 1.27 | 11.45 ± 0.10 | 12.20 ± 0.23 |
| 0.01 | 26.84 ± 3.00 | 2.30 ± 0.17, 22.11 ± 0.20a | 1.66 ± 0.03, 23.41 ± 0.14a |
| 0.05 | 15.66 ± 1.08 | 3.05 ± 0.14, 22.12 ± 0.20a | 1.84 ± 0.14, 24.74 ± 0.16a |
| 0.1 | 4.73 ± 1.27 | 2.70 ± 0.14, 14.44 ± 0.30a | 1.45 ± 0.08, 12.75 ± 0.30a |
| 0.5 | 0.71 ± 0.26 | 3.71 ± 0.17 | 6.36 ± 0.21 |
| 1.01 | < 0.50 | 5.56 ± 0.08 | 5.93 ± 0.07 |
| 1.99 | < 0.50 | 5.43 ± 0.13 | 6.40 ± 0.17 |
| 2.98 | < 0.50 | 6.11 ± 0.20 | 4.43 ± 0.03 |
When the nitric acid concentration ranges from 0.01 to 0.1 M, interestingly, a bimodal distribution of the aggregates is observed in the DLS pattern, as shown in Fig. 9. The average aggregate size of the smaller, less intense peak is closer to the self-aggregate size of ∼7 nm, whereas the bigger, more intense peak, is moved towards the higher aggregate size of ∼25 nm. These observations indicate that a couple of distinct groups of aggregates are formed in the homogeneous organic phase. Since the loading of Nd(III) into the organic phase is low at nitric acid concentrations ranging from 0.05 to 0.1 M in the case of HDODGA, and that of 0.01 to 0.1 M in the case of HD2DGA (see Tables 6 and 7), it is quite likely that a significant amount of HDODGA and HD2DGA could exist in the uncomplexed form. The presence of these uncomplexed or free ligands, HDODGA and HD2DGA, in diluent phase, seem to be responsible for the formation of self-aggregates (less intense peak) in the bimodal distribution.
The other peak in the bimodal distribution could be due to the aggregates arising from Nd(III) complexes coordinated to the ligand, Nd(DRDGA)3·(HDRDGA)y, as discussed above. Here the “y” indicates the number of neutral HDRDGA molecules involved in the extraction of Nd(III) at 0.01 to 0.1 M nitric acid. Since the loading of Nd(III) is less in the organic phase at these nitric acid concentrations (0.01 to 0.1 M) as compared to that observed at 0.001 to 0.005 M (see Tables 6 and 7), the neutral HDRDGA ligands available for coordination with Nd(III) in the organic phase are more in 0.01 to 0.1 M nitric acid. In view of this, the second peak of the bimodal distribution is broad (higher FWHM) and the aggregate size is more in the case of 0.01 to 0.1 M nitric acid as compared to those observed with monomodal distribution at 0.001 to 0.005 M.
3.4 Visible spectroscopic studies
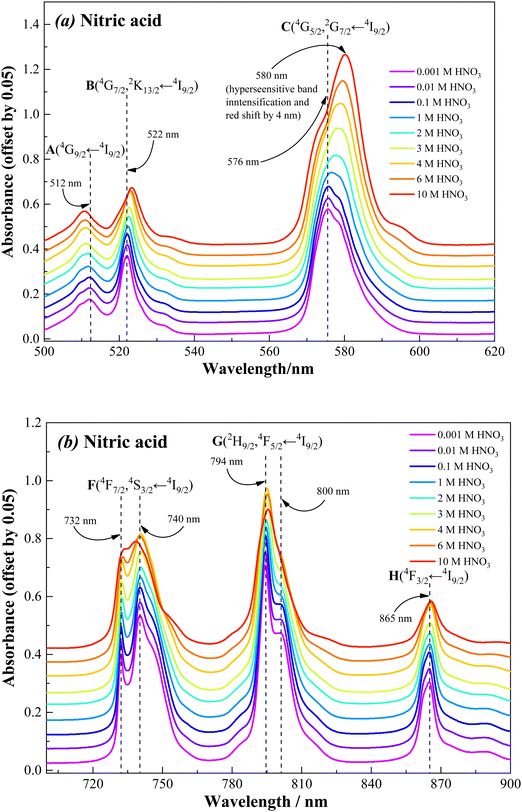
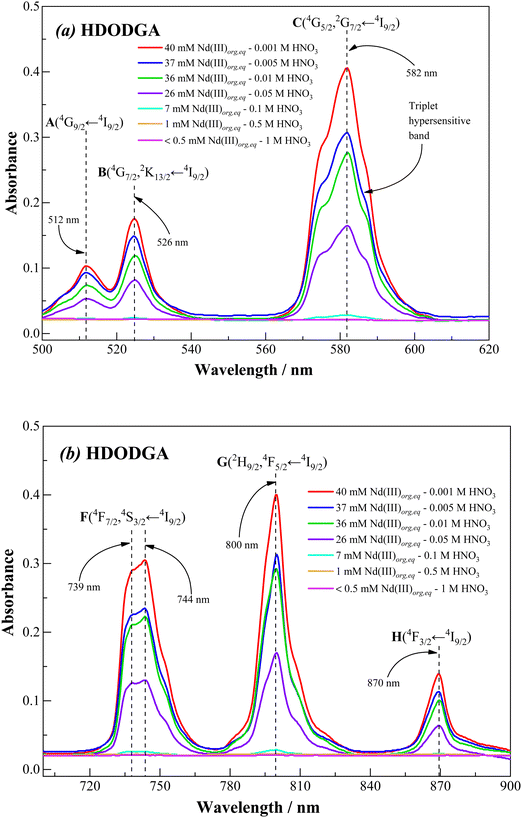
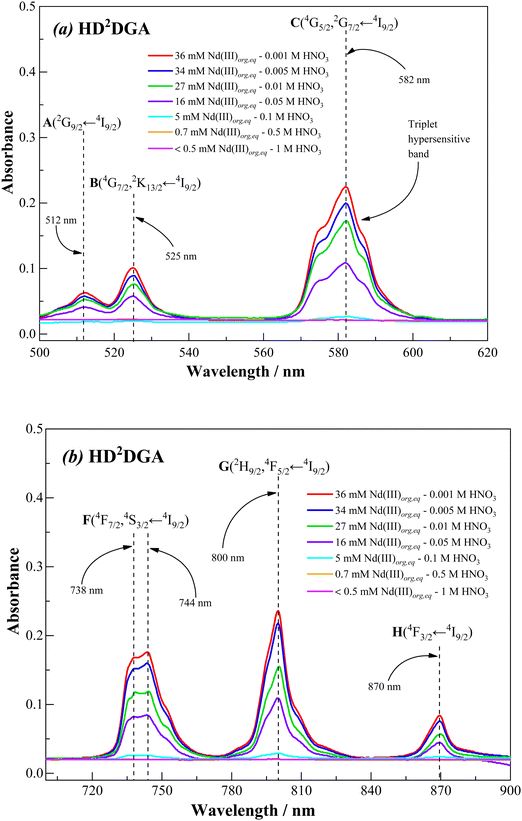
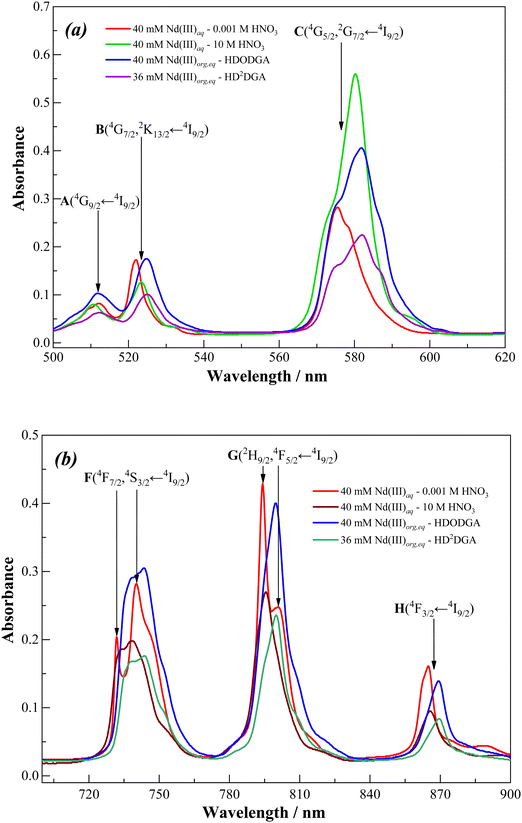
It is interesting to note from Fig. 11 and 12 that the hypersensitive (C) absorption band of the Nd(III)-loaded organic phase appears as a triplet, unlike that observed in the case of dilute and higher nitric acid solutions, shown in Fig. 10. Based on the results reported in the literature, the triplet splitting of the hypersensitive band of Nd(III) is due to the strong interaction of the ligand with Nd(III) in the inner coordination sphere.48,49 Considering the appearance of the triplet hypersensitive absorption band of Nd(III) in the organic phase containing HDRDGA ligands and the 1![[thin space (1/6-em)]](https://www.rsc.org/images/entities/char_2009.gif) :
:![[thin space (1/6-em)]](https://www.rsc.org/images/entities/char_2009.gif) 3 to 1
3 to 1![[thin space (1/6-em)]](https://www.rsc.org/images/entities/char_2009.gif) :
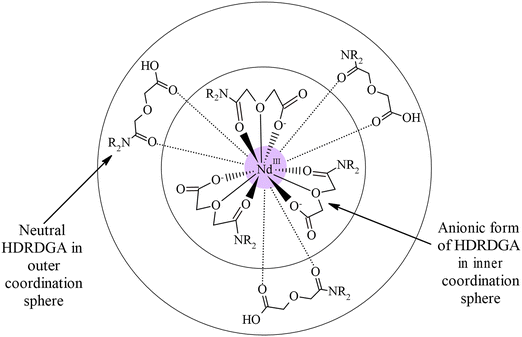
:![[thin space (1/6-em)]](https://www.rsc.org/images/entities/char_2009.gif) 6 metal to ligand stoichiometry determined from the slope analysis of extraction data and Nd(III) loading studies (see Sections 3.2.2 and 3.2.3), it can be proposed that the proton dissociated form of HDRDGA, namely DRDGA−, forms a strong complex with Nd(III) in the inner coordination sphere with two to three neutral HDRDGA molecules in the outer coordination sphere, as shown in Fig. 13. Since the neutral HDRDGA molecules present in the outer coordination sphere can vary from one to five with an average of three ligands, as shown in Fig. 13, the aggregate distribution observed in the Nd(III)-loaded organic phase is quite large (see Fig. 9). In a detailed study reported by Tian et al., they also confirmed that the diglycolamic acid molecule forms a 1
6 metal to ligand stoichiometry determined from the slope analysis of extraction data and Nd(III) loading studies (see Sections 3.2.2 and 3.2.3), it can be proposed that the proton dissociated form of HDRDGA, namely DRDGA−, forms a strong complex with Nd(III) in the inner coordination sphere with two to three neutral HDRDGA molecules in the outer coordination sphere, as shown in Fig. 13. Since the neutral HDRDGA molecules present in the outer coordination sphere can vary from one to five with an average of three ligands, as shown in Fig. 13, the aggregate distribution observed in the Nd(III)-loaded organic phase is quite large (see Fig. 9). In a detailed study reported by Tian et al., they also confirmed that the diglycolamic acid molecule forms a 1![[thin space (1/6-em)]](https://www.rsc.org/images/entities/char_2009.gif) :
:![[thin space (1/6-em)]](https://www.rsc.org/images/entities/char_2009.gif) 3 inner-sphere complex with Nd(III) through tridentate coordination similar to that observed in the case of diglycolamides.49
3 inner-sphere complex with Nd(III) through tridentate coordination similar to that observed in the case of diglycolamides.49
| Nd(III) matrix | λ max/nm | |||||
|---|---|---|---|---|---|---|
| Electronic transition from the ground state (4I9/2) to excited state - | ||||||
| 4G9/2 (A) | 4G7/2,2K13/2 (B) | 4G5/2,2G7/2 (C) | 4F7/2,4S3/2 (F) | 2H9/2,4F5/2 (G) | 4F3/2 (H) | |
| a Blue shift may be for the F (4S3/2 ← 4I9/2) transition. b Red shift may be for the G (2H9/2 ← 4I9/2) transition. | ||||||
| 0.001 M HNO3 | 512 | 522 | 576 | 732, 740 | 794, 800 | 865 |
| 10 M HNO3 | 510 (blue) | 523 (red) | 580 (red) | 733, 738 (red, bluea) | 796 (redb) | 866 (red) |
| 0.2 M HDODGA in 30% IDA/n-DD | 512 (no shift) | 526 (red) | 582 (red) | 739, 744 (red) | 800 (redb) | 870 (red) |
| 0.2 M HD2DGA in 30% IDA/n-DD | 512 (no shift) | 525 (red) | 582 (red) | 738, 744 (red) | 800 (redb) | 870 (red) |
4 Conclusions
The N,N-dialkyl diglycolamic acids (alkyl groups varied from n-hexyl to n-dodecyl) were synthesized, and N,N-dioctyl diglycolamic acid (HDODGA) and N,N-didecyl diglycolamic acid (HD2DGA) were studied for the mutual separation of Eu(III) and Am(III) from dilute nitric acid solution. The extractants, N,N-dihexyl diglycolamic acid and N,N-didodecyl diglycolamic acid, were not soluble in the conventional diluent, n-dodecane, even in the presence of 30% isodecyl alcohol, and therefore they were not studied further. However, HDODGA and HD2DGA were soluble in n-dodecane in the presence of 30% (v/v) isodecyl alcohol, and therefore the solvent phase composed of 0.2 M HDODGA or HD2DGA in 30% IDA/n-dodecane was employed for the studies on mutual separation of Eu(III) and Am(III). The extraction of Eu(III) and Am(III) from dilute nitric acid solution (<0.05 M) into the solvent phase established that Eu(III) and Am(III) coordinate with three molecules of the anionic form of HDODGA or HD2DGA in the inner coordination sphere and also with two to three molecules of neutral HDODGA or HD2DGA in the outer coordination sphere, based on the aggregation behavior of the Nd(III)-loaded organic phase and spectroscopic investigations.The HDRDGA molecules underwent self-aggregation in 30% IDA/n-dodecane with an average aggregate size of ∼7 nm, and decreased marginally with an increase in the volume of IDA in the organic phase. Equilibrating the organic phase with dilute nitric acid (≤0.01 M) marginally increased the average aggregate size and its distribution in the organic phase, which was attributed to the increase in the polar species of the organic phase due to the dissociation of HDRDGA molecules facilitating the formation of aggregates. However, the aggregate formation tendency increased significantly when the organic phase was in contact with Nd(III) solution in nitric acid. The average aggregate size and its distribution in the organic phase were strongly dependent on the quantity of loaded Nd(III) in the organic phase. At higher nitric acid concentrations (> 0.5 M), where the loading of Nd(III) was negligible, the aggregate size distribution was similar to that observed in the nitric acid-equilibrated organic phase. In contrast, the monomodal aggregate size distribution obtained in the organic phase, especially at 0.001 M and 0.005 M nitric acid, was wide (FWHM ∼ 14 nm) with higher Nd(III) loadings. This observation confirmed the formation of a range of Nd(DRDGA)3·HDRDGAx complexes in the organic phase at higher loadings. At intermediate Nd(III) loadings, a reasonable concentration of uncomplexed HDRDGA also existed as a free ligand, along with bigger aggregates comprising of ligand molecules coordinated to Nd(III) in a bimodal distribution.
Coordination of Nd(III) with HDRDGA induced significant changes in the hypersensitive band of the UV-visible spectrum of Nd(III) observed at 580–610 nm. All the absorption bands of Nd(III) were shifted to the lower wavelength region due to inner-sphere coordination of anionic DRDGA molecules with Nd(III). The coordination of three molecules of the anionic form of HDRDGA with the trivalent metal ion was in good agreement with the inner-sphere 1![[thin space (1/6-em)]](https://www.rsc.org/images/entities/char_2009.gif) :
:![[thin space (1/6-em)]](https://www.rsc.org/images/entities/char_2009.gif) 3 stoichiometry observed for the extraction of Eu(III) and Am(III). In addition, the neutral HDRDGA molecules also participated in the complexation of Nd(III) at lower acidities. Based on the extraction, aggregation, and spectroscopic studies reported in this work, it can be concluded that HDODGA and HD2DGA ligands are promising candidates for the separation of lanthanides and actinides from nitric acid solution.
3 stoichiometry observed for the extraction of Eu(III) and Am(III). In addition, the neutral HDRDGA molecules also participated in the complexation of Nd(III) at lower acidities. Based on the extraction, aggregation, and spectroscopic studies reported in this work, it can be concluded that HDODGA and HD2DGA ligands are promising candidates for the separation of lanthanides and actinides from nitric acid solution.
Author contribution statement
Anjan Dhawa: conceptualization, investigation, formal analysis, and writing. Jammu Ravi: methodology, resources, data curation, data validation, and writing. R. Puspalata: formal analysis, resources, and writing. N. R. Jawahar: resources, and project administration. K. A. Venkatesan: conceptualization, methodology, supervision, writing, and reviewing.Conflicts of interest
There are no conflicts of interest between the authors to declare.Acknowledgements
The authors would like to thank Mr P. Magesvaran and Mrs D. Sreejeya, INRPK, Bhabha Atomic Research Centre Facilities, Kalpakkam, for their help in the purification of 241Am radiotracer, and Dr Debasish Saha, MC&MFCG, Indira Gandhi Centre for Atomic Research, Kalpakkam, for helping the experiments with 152Eu.References
- K. A. Venka, R. Kumaresan, M. P. Antony, T. Kumar, T. G. Srinivasan and P. R. Vasudeva Rao, Radiochim. Acta, 2012, 100(11), 843–850 CrossRef.
- B. Merk, D. Litskevich, A. Peakman and M. Bankhead, ATW, Int. J. Nucl. Power, 2019, 64(5), 261–266 Search PubMed.
- H. A. Abderrahim and M. Giot, Sustainability, 2021, 13(22), 12643 CrossRef CAS.
- J. N. Mathur, M. S. Murali and K. L. Nash, Solvent Extr. Ion Exch., 2001, 19(3), 357–390 CrossRef CAS.
- D. Magnusson, B. Christiansen, J. P. Glatz, R. Malmbeck, G. Modolo, D. Serrano-Purroy and C. Sorel, Solvent Extr. Ion Exch., 2009, 27(1), 26–35 CrossRef CAS.
- D. Whittaker, A. Geist, G. Modolo, R. Taylor, M. Sarsfield and A. Wilden, Solvent Extr. Ion Exch., 2018, 36(3), 223–256 CrossRef CAS.
- J. Ravi, K. A. Venkatesan, M. P. Antony, T. G. Srinivasan and P. R. Vasudeva Rao, Solvent Extr. Ion Exch., 2014, 32(4), 424–436 CrossRef CAS.
- B. Weaver and F. A. Kappelmann, ORNL-3559, 1964.
- G. J. Lumetta, A. J. Casella, B. M. Rapko, T. G. Levitskaia, N. K. Pence, J. C. Carter, C. M. Niver and M. R. Smoot, Solvent Extr. Ion Exch., 2015, 33(3), 211–223 CrossRef CAS.
- Y. Sasaki, Y. Sugo, S. Suzuki and S. Tachimori, Solvent Extr. Ion Exch., 2001, 19(1), 91–103 CrossRef CAS.
- S. Tachimori, Y. Sasaki and S.-I. Suzuki, Solvent Extr. Ion Exch., 2002, 20(6), 687–699 CrossRef CAS.
- Y. Sasaki, Y. Sugo, S. Suzuki and T. Kimura, Anal. Chim. Acta, 2005, 543(1–2), 31–37 CrossRef CAS.
- Y. Sasaki, Y. Sugo, K. Morita and K. L. Nash, Solvent Extr. Ion Exch., 2015, 33(7), 625–641 CrossRef CAS.
- S. A. Ansari, P. Pathak, P. K. Mohapatra and V. K. Manchanda, Chem. Rev., 2012, 112(3), 1751–1772 CrossRef CAS PubMed.
- K. V. Hecke and P. Goethals, SCK·CEN-BLG-1030, Open Report, 2006, ISSN 1379-2407.
- Z. Kolarik, Chem. Rev., 2008, 108(10), 4208–4252 CrossRef CAS PubMed.
- H. H. Dam, D. N. Reinhoudt and W. Verboom, Chem. Soc. Rev., 2007, 36(2), 367–377 RSC.
- A. Bhattacharyya, T. Gadly, P. Pathak, S. K. Ghosh, M. Mohapatra, T. K. Ghanty and P. K. Mohapatra, Dalton Trans., 2014, 43(32), 12422–12429 RSC.
- A. Bhattacharyya, S. A. Ansari, T. Gadly, S. K. Ghosh, M. Mohapatra and P. K. Mohapatra, Dalton Trans., 2015, 44(13), 6193–6201 RSC.
- I. Svantesson, I. Hangström, G. Persson and J. O. Liljenzin, Radiochem. Radioanal. Lett., 1979, 37(4–5), 215–222 CAS.
- M. Nilsson and K. L. Nash, Solvent Extr. Ion Exch., 2007, 25(6), 665–701 CrossRef CAS.
- K. L. Nash, Solvent Extr. Ion Exch., 2015, 33(1), 1–55 CrossRef CAS.
- J. L. Lapka and K. L. Nash, Solvent Extr. Ion Exch., 2015, 33(4), 346–361 CrossRef CAS.
- T. S. Grimes, R. D. Tillotson and L. R. Martin, Solvent Extr. Ion Exch., 2014, 32(4), 378–390 CrossRef CAS.
- G. J. Lumetta, T. G. Levitskaia, A. Wilden, A. J. Casella, G. B. Hall, L. Lin, S. I. Sinkov, J. D. Law and G. Modolo, Solvent Extr. Ion Exch., 2017, 35(6), 377–395 CrossRef CAS.
- K. Shimojo, H. Naganawa, J. Noro, F. Kubota and M. Goto, Anal. Sci., 2007, 23(12), 1427–1430 CrossRef CAS PubMed.
- K. Shimojo, N. Aoyagi, T. Saito, H. Okamura, F. Kubota, M. Goto and H. Naganawa, Anal. Sci., 2014, 30(2), 263–269 CrossRef CAS PubMed.
- A. S. Suneesh, K. A. Venkatesan, K. V. Syamala, M. P. Antony and P. R. Vasudeva Rao, Radiochim. Acta, 2012, 100(7), 425–430 CrossRef CAS.
- A. S. Suneesh, R. Kumaresan, S. Rajeswari, P. K. Nayak, K. V. Syamala, K. A. Venkatesan, M. P. Antony and P. R. Vasudeva Rao, Sep. Sci. Technol., 2013, 48(13), 1998–2006 CrossRef CAS.
- J. Ravi, K. A. Venkatesan, M. P. Antony, T. G. Srinivasan and P. R. Vasudeva Rao, Radiochim. Acta, 2014, 102(7), 599–607 CrossRef CAS.
- K. R. Swami, K. A. Venkatesan and M. P. Antony, Ind. Eng. Chem. Res., 2018, 57(40), 13490–13497 CrossRef.
- K. R. Swami, R. Kumaresan, K. A. Venkatesan and M. P. Antony, New J. Chem., 2018, 42(11), 8891–8899 RSC.
- N. Parvathy, K. R. Swami, T. Prathibha and K. A. Venkatesan, New J. Chem., 2023, 47(17), 8062–8072 RSC.
- P. N. Pathak, S. A. Ansari, S. Kumar, B. S. Tomar and V. K. Manchanda, J. Colloid Interface Sci., 2010, 342(1), 114–118 CrossRef CAS PubMed.
- R. Ganguly, J. N. Sharma and N. Choudhury, J. Colloid Interface Sci., 2011, 355(2), 458–463 CrossRef CAS PubMed.
- M. P. Jensen, T. Yaita and R. Chiarizia, Langmuir, 2007, 23(9), 4765–4774 CrossRef CAS.
- J. Ravi, K. A. Venkatesan, M. P. Antony, T. G. Srinivasan and P. R. Vasudeva Rao, J. Radioanal. Nucl. Chem., 2013, 295(2), 1283–1292 CrossRef CAS.
- R. Finsy, Adv. Colloid Interface Sci., 1994, 52, 79–143 CrossRef CAS.
- A. Dhawa, A. Rout, N. R. Jawahar and K. A. Venkatesan, J. Mol. Liq., 2021, 341, 117397 CrossRef CAS.
- J. H. Campbell and T. I. Suratwala, J. Non-Cryst. Solids, 2000, 263, 318–341 CrossRef.
- K. Gatterer, G. Pucker, H. P. Fritzer and S. Arafa, J. Non-Cryst. Solids, 1994, 176(2–3), 237–246 CrossRef CAS.
- B. R. Judd, Atomic theory and optical spectroscopy, Handb. Phys. Chem. Rare Earths, 1988, 11, 81–195 Search PubMed.
- T. Moaienla, N. Bendangsenla, T. David, C. Sumitra, N. R. Singh and M. I. Devi, Spectrochim. Acta, Part A, 2012, 87, 142–150 CrossRef CAS.
- E. M. Stephens, K. Schoene and F. S. Richardson, Inorg. Chem., 1984, 23(12), 1641–1648 CrossRef CAS.
- G. R. Choppin, D. E. Henrie and K. Buijs, Inorg. Chem., 1966, 5(10), 1743–1748 CrossRef CAS.
- S. Kumar, S. Maji and K. Sundararajan, Talanta, 2021, 231, 122398 CrossRef CAS.
- L. Rao and G. Tian, Inorg. Chem., 2009, 48(3), 964–970 CrossRef CAS PubMed.
- S. A. Ansari, P. K. Mohapatra, S. M. Ali, N. Rawat, B. S. Tomar, A. Leoncini, J. Huskens and W. Verboom, New J. Chem., 2018, 42(1), 708–716 RSC.
- G. Tian, S. J. Teat and L. Rao, Inorg. Chem., 2014, 53(18), 9477–9485 CrossRef CAS PubMed.
- W. Wu, T. Sun, N. Pu, D. Meng, Y. Li, J. Dang, Y. Yang, J. Chen and C. Xu, New J. Chem., 2018, 42(11), 9098–9109 RSC.
- J. Dang, W. Duan, W. Wu, T. Sun, Y. Li, N. Pu, L. Xu, J. Chen and C. Xu, New J. Chem., 2019, 43(9), 3866–3873 RSC.
- C. K. Jørgensen, Influence of rare earth on chemical understanding and classification, Handb. Phys. Chem. Rare Earths, 1988, 11, 196–292 Search PubMed.
Footnote |
| † Electronic supplementary information (ESI) available. See DOI: https://doi.org/10.1039/d3nj02840b |
| This journal is © The Royal Society of Chemistry and the Centre National de la Recherche Scientifique 2024 |

