Tuning the fluorescence sensing for Fe3+ ions by using different dipyridyl linkers in pillar-layered metal–organic frameworks†
Yan-E
Liu‡
,
Ye
Zhou‡
,
Xiao-Yu
Li
,
Jun
Yao
,
Qiu-Xia
Li
,
Quan-Qing
Xu
,
Rong-Rong
Zhu
 * and
Ai-Xin
Zhu
 *
*
Faculty of Chemistry and Chemical Engineering, Yunnan Normal University, Kunming 650500, China. E-mail: chemzrr1993@163.com; zaxchem@126.com; Tel: +86 0871 65941088
First published on 17th November 2023
Abstract
Isostructural, pillar-layered metal–organic frameworks (MOFs) will provide an ideal structural model for studying the influence of functional groups on fluorescence sensing. Here, we study dipyridyl linkers to tune the detection of Fe3+ ions. Three isostructural analogues of pillar-layered frameworks were used as fluorescence sensors to quickly, sensitively, and selectively detect Fe3+ ions with good repeatability. Importantly, an increase in length of the pillars and accessible volumes may lead to an increase in the fluorescence quenching constants (Ksv(PL-1) = 1.58 × 10⁴ M−1) < (Ksv(PL-2) = 1.72 × 10⁴ M−1) < (Ksv(PL-3) = 2.47 × 10⁴ M−1), which may be related to different dipyridyl ligands acting as pillars.
1. Introduction
Fe3+ ions play a significant role in the formation of haemoglobin, enzymes, and proteins and the transport of oxygen molecules.1,2 The lack or excess of Fe3+ ions may lead to biological malfunction, such as syndromes like insomnia, cancer, heart disease, and declining immunity.3,4 There are many techniques for the detection of Fe3+ ions including atomic absorption spectrometry,5 inductively coupled plasma mass spectrometry,6 spectrophotometry,7 and voltammetry.8 However, these techniques always need expensive and complicated instruments and cumbersome sample preparation procedures.9 Thus, developing other approaches for detecting Fe3+ ions is extremely urgent. To date, a plethora of fluorescent sensors for detecting Fe3+, such as organic fluorescent sensors (rhodamine10 and napthalamide11), polymer-based sensors (NBN-embedded polymers),12 and nanocomposite-based fluorescent sensors (carbon quantum dots and g-C3N4 nanosheets),13 have been reported because of their high sensitivity, efficiency, and convenient manipulation.14 However, their practical applications have been limited due to low water solubility, instability, high toxicity, difficult separation, and slow response towards Fe3+ ions.15 Many fluorescent MOFs were used to detect Fe3+ ions by fluorescence quenching due to their many advantages including ease of use, quick detection ability, high sensitivity, highly selective response, diverse pore topologies, high surface area, and easy separation.16–28Pillar-layered MOFs have been in the spotlight due to their applications in gas adsorption,29 detection of metal ions,30 mechanical energy storage,31etc. These MOFs are composed of M2L2P (M2+ = divalent metal cations; L2− = dicarboxylate linkers; P = neutral N pillars).32 The paddle-wheel nodes (M2) are connected by the O atoms of the dicarboxylate linkers to form two-dimensional M2L2 sheets of sql topology.33 The M2L2 sheets are further extended by the N of the neutral pillar to generate a three-dimensional M2L2P framework of pcu topology.34 It is easy to construct a series of isostructural, pillar-layered frameworks with different pore sizes and surface areas through the reaction of different groups of dipyridyl organic linkers as pillars and functional dicarboxylate ligands, which provide an ideal model to study how linkers affect the properties of compounds detecting metal ions.
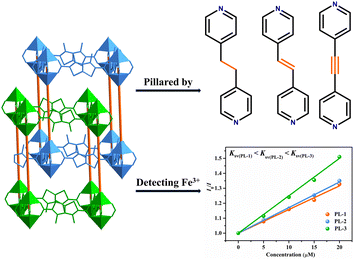
It is necessary to exclude the structural factors to investigate the impact of functional groups on the detection of Fe3+ ions; therefore, three isostructural, pillar-layered MOFs with 2-fold interpenetrated, pcu topology nets constructed using 3,4-dimethylthieno[2,3-b]thiophehe-2,5-dicarboxylic acid (H2DMTDC) and three different dipyridyl linkers, namely {[Zn2(DMTDC)2(bpe)]·3DMF·1.8H2O}n (PL-1, bpe = 1,2-bis(4-pyridyl)ethane), {[Zn2(DMTDC)2(dpe)]·3DMF·0.5H2O}n (PL-2, dpe = 1,2-di(4-pyridyl)ethylene), and {[Zn2(DMTDC)2(bpa)]·3DMF·3.2H2O}n (PL-3, bpa = 1,2-bis(4-pyridyl)acetylene)35 were selected to study the effects of different dipyridyl linkers on the properties of fluorescence sensing (Scheme 1).
2. Experimental
2.1. Materials and methods
The ligand H2DMTDC was synthesized according to the literature method.36 Other reagents and solvents were obtained from commercial sources and used without further purification. PL-1, PL-2, and PL-3 were synthesized according to the literature methods.35 Powder X-ray diffraction (PXRD) measurements were taken using a MiniFlex 600 automated diffractometer (CuKα, λ = 1.5418 Å). Fluorescence spectra were recorded using a Hitachi F-4600 fluorescence spectrophotometer at room temperature. Fourier transform infrared spectroscopy (FT-IR) was performed from KBr pellets using a Bruker EQUINOX 55 FT IR spectrometer in the range of 4000–400 cm−1. UV-visible absorption spectroscopy was carried out using a Hitachi 3310 UV-vis spectrophotometer. X-ray photoelectron spectroscopy (XPS) data were recorded using a Fisher Scientific K-Alpha+ instrument (Seymour Flight).2.2. Fluorescence sensing experiments
2.3. Fe3+ ion adsorption experiments
30 mg of the single-crystalline powder samples of PL-1, PL-2, and PL-3 without any activation were soaked in 5 mL of the EtOH solution (10 mg L−1) of Fe(NO3)3. At certain time intervals, 4 mL of the supernatant were collected after centrifugation and then dried at 50 °C to remove the EtOH solvent. The residual product was mixed with hydrochloric acid (1 mL), KSCN (30 mg), and H2O (4 mL) to obtain a reddish-brown solution. The absorbance was measured at 470 nm using an ultraviolet spectrophotometer for the analysis of the corresponding amount of Fe3+ ions.3. Results and discussion
3.1 Structure description
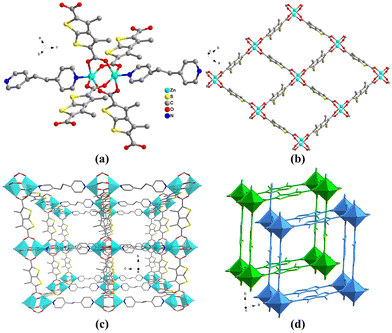
Single-crystal, X-ray diffraction analysis reveals that PL-1, PL-2, and PL-3 display isostructural, pillar-layered structures.35 They consist of dinuclear ZnII ion paddlewheel secondary building units (SBUs) coordinated by four DMTDC2− ligands (Fig. 1(a)), which are linked by DMTDC2− ligands leading to the square lattice, sql, networks (Fig. 1(b)). The sql nets are further pillared by dipyridyl-type ligands to generate 3D pcu topology nets with a 2-fold interpenetration (Fig. 1(c) and (d)). Despite the 2-fold interpenetration, 1D channels with effective pore cross-sectional sizes of 3.7 × 4.6, 4.6 × 5.1, and 4.0 × 4.4 Å2 are observed in the frameworks of PL-1, PL-2, and PL-3, respectively.35 The calculated accessible volumes of PL-1, PL-2, and PL-3 were 45.5%, 45.7%, and 46.0%, respectively.35The phase purity was ascertained by PXRD, as displayed in Fig. S1 (ESI†). The experimental patterns of PL-1, PL-2, and PL-3 were essentially in agreement with the simulated ones from the single-crystal data, indicating the high phase purity of the as-synthesized materials.
3.2. Photoluminescence properties
Taking into account the excellent luminescence properties of MOFs based on d10 metal ions and aromatic linkers, the solid-state emission spectra of the free ligands (H2DMTDC, bpe, dpe, and bpa) and MOFs (PL-1, PL-2, and PL-3) were investigated at ambient temperature (Fig. S2, ESI†). These free ligands have the main emission peaks at 371 nm (λex = 337 nm) for H2DMTDC, 346 nm (λex = 307 nm) for bpe, 365 nm (λex = 330 nm) for dpe, and 344 nm (λex = 319 nm) for bpa, which may be assigned to the π* → n or π* → π transitions (Fig. S2b, ESI†). As shown in Fig. S2d (ESI†), PL-1, PL-2, and PL-3 exhibited blue fluorescence emissions, with maximal peaks occurring at 493 nm (λex = 420 nm), 511 nm (λex = 466 nm), and 512 nm (λex = 467 nm). The emissions of these MOFs were red-shifted by ca. 122, 140, and 141 nm, respectively, as compared to that of the ligand H2DMTDC. The emissions of PL-1, PL-2, and PL-3 may be assigned to a mixture character of intra-ligand and ligand-to-ligand charge transitions (LLCT) due to the difficulties of oxidation or reduction of ZnII ions with the d10 configuration.3.3. Detection of metal cations
Luminescent MOFs have drawn much attention in the field of detecting metal ions because of their excellent selectivity, sensitivity, and recyclability.37 Therefore, the potential cation sensing for PL-1, PL-2, and PL-3 was examined. As shown in Fig. 2, the luminescence intensities and peaks of most metal ions were almost unchanged, while only Fe3+ ions displayed drastic turn-off effects on the luminescence intensities, indicating that PL-1, PL-2, and PL-3 can be considered promising fluorescent probes for Fe3+ ions. In order to eliminate the interference of various anions on the detection of Fe3+ ions, the quenching efficiencies were collected after adding Fe3+ ions containing different anions (NO3−, Br−, Cl−, and ClO4−). As shown in Fig. S3 (ESI†), all the Fe3+ ions with different anions have significant quenching effects, and the quenching efficiencies can keep above 95% (quenching efficiency = (I0 − I)/I0 × 100%, where I0 and I are the emission intensities in the absence and presence of Fe3+ ions, respectively). Therefore, the detection of Fe3+ ions was not affected by anions in Fe3+ solutions.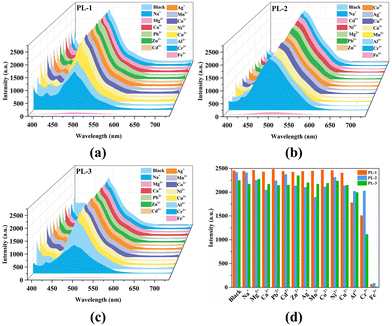 | ||
| Fig. 2 The emission spectra (a)–(c) and the comparison of the luminescence intensities (d) of PL-1, PL-2, and PL-3 dispersed in EtOH upon the addition of 200 μL of metal ion solutions (10 mM). | ||
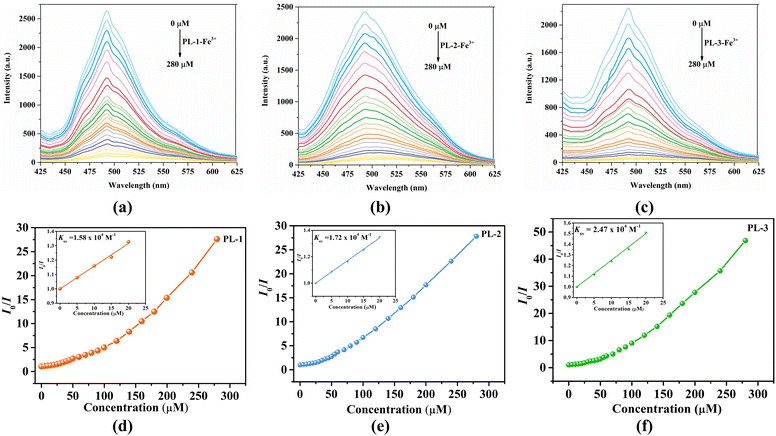
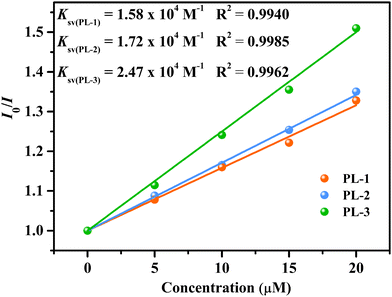
For a better understanding of the sensitivity of the three MOFs toward Fe3+ ions, fluorescence titration experiments were carried out. The emission intensity of these MOFs progressively decreased with the addition of the Fe3+ ions (Fig. 3(a)–(c)). When the concentrations were increased to 280 μM, the quenching efficiencies were up to 95.46% (PL-1), 96.35% (PL-2), and 97.87% (PL-3), respectively. The quenching processes were evaluated by the Stern–Volmer (S–V) equation I0/I = 1 + Ksv[M], where [M] and Ksv are the concentration (M) and the quenching constant (M−1), respectively. The S–V plots were nearly linear at low concentrations and then deviated from linearity at higher concentrations, and the corresponding Ksv values are calculated to be 1.58 × 10⁴ (R2 = 0.9940), 1.72 × 10⁴ (R2 = 0.9985), and 2.47 × 10⁴ M−1 (R2 = 0.9962), respectively (Fig. 3(d)–(f)) The Ksv values are arranged in the following order: Ksv(PL-1) < Ksv(PL-2) < Ksv(PL-3) (Fig. 4), suggesting that the sensing ability of PL-3 toward Fe3+ ions is better than those of PL-1 and PL-2. The different sensing results may be ascribed to the different functional groups of dipyridyl ligands acting as pillars. These quenching constants of PL-1, PL-2, and PL-3 are comparable to those of fluorescent MOFs that have been reported (Table S1, ESI†). Furthermore, the time-dependent fluorescence intensity was also reported (Fig. 5). It was found that the three MOFs exhibit a fast response time within 20 s. These results reveal that PL-1, PL-2, and PL-3 can be used as a kind of sensor that can quickly respond to Fe3+ ions.
 | ||
| Fig. 5 Time-dependent fluorescence quenching by Fe3+ for PL-1 (a), PL-2 (b), and PL-3 (c). Inset: [time] ⩽ 2 min. | ||
Cycle experiments were carried out to investigate reproducibility and recyclability. The luminescence intensities still maintained a very good level (Fig. 6) and the PXRD peaks could be matched well with the crystallographic data (Fig. S4, ESI†) after five cycles. This indicates that the frameworks of these samples after five cycles were unchanged. The above results implied that PL-1, PL-2, and PL-3 can quickly, sensitively, and selectively detect Fe3+ ions with good repeatability.
To elucidate the possible luminescence quenching mechanism, other experiments were carried out. Firstly, the PXRD patterns proved that the 3D frameworks remained intact after these samples were soaked in the EtOH solution of different metal ions for two days (Fig. S5, ESI†). Thus, the luminescence quenching towards Fe3+ ions was not caused by the collapse of the frameworks. Secondly, it is very difficult to capture Fe3+via cation exchange due to the neutral frameworks; hence, the cation exchange mechanism can be ruled out. Thirdly, the color of PL-1, PL-2, and PL-3 immersed by the Fe3+ ions has changed from colorless or yellow to brown, suggesting that the Fe3+ ions may have been absorbed or bonded by the three MOFs (Fig. S6, ESI†). Therefore, the XPS spectra were recorded. The XPS spectra of PL-1, PL-2, and PL-3 display changes after being soaked in the Fe3+ solutions (Fig. S7 and S8, ESI†). As shown in the XPS spectra (Fig. S7a–c, ESI†), the emergence of Fe2p peaks at 726.1 and 712.1 eV verified that Fe3+ ions may have a binding interaction with the frameworks.38 However, the shift values for O1s, S2p, and N1s peaks are no more than 0.2 eV, signifying the very weak affinity between the frameworks and Fe3+ ions. In other words, the interaction between the Fe3+ ions and open S/O/N atoms is very weak, which is consistent with the fast and simple regeneration method of the three MOFs.39 Therefore, we speculate that Fe3+ ions may be diffused into the channels of PL-1, PL-2, and PL-3 or rapidly attached to the surface of PL-1, PL-2, and PL-3, which may be responsible for the quenching of luminescence. Finally, to further investigate the luminescence quenching mechanism caused by Fe3+ ions, the UV-vis absorption of Fe(NO3)3 in EtOH solutions was measured. As shown in Fig. S9 (ESI†), the absorption range (256–425 nm) of the Fe3+ ions partly overlapped with the excitation bands of the three MOFs (259–423 nm), which reveals that there was a competitive absorption of the exciting light between the Fe3+ ions and these MOFs, thus resulting in the quenching of luminescence.40 According to all the above experimental results, the luminescence quenching of PL-1, PL-2, and PL-3 was ascribed to the encapsulated Fe3+ ions and competitive absorption.
3.4. Tuning the fluorescence sensing properties by different linkers
Since PL-1, PL-2, and PL-3 are isostructural, the quenching constant Ksv values for Fe3+ detection derive from different dipyridyl ligands as pillars. As shown in Table S2 (ESI†), the length of the pillars is controlled by dipyridyl ligands due to the conform freedom. The pore volumes (45.5% for PL-1, 45.7% for PL-2, and 46.0% for PL-3) and the lengths of the pillars (16.2235, 16.3357, and 16.5907 Å, respectively for PL-1, PL-2, and PL-3, Fig. S11, ESI†) are also observed in the following order: PL-1 < PL-2 < PL-3. The pore volume increases accompanied by the increase of the length of the pillars. Therefore, the dipyridyl linkers can influence the pore volumes. Besides, the saturated adsorption capacity for Fe3+ ions is comparable to that for PL-1, PL-2 and PL-3 with ca. 376, 374, and 402 mg mol−1, respectively. However, the adsorption rate (from the slope in Fig. S10, ESI†) below 30 min obviously follows the order: PL-3 > PL-2 > PL-1 (Fig. S10, ESI†). The order of the adsorption rate of Fe3+ ions follows that of Ksv, suggesting the larger adsorption rate of Fe3+ ions may lead to larger Ksv.According to the above description, it can be known that the Ksv values, adsorption rates, and pore volumes increase accompanied by the increase in the length of the pillars. The order of the quenching constant Ksv for PL-1, PL-2, and PL-3 follows the pillars. Therefore, the longer pillars and larger pore volumes may cause more adsorbed Fe3+ ions in the MOFs, thus leading to larger Ksv. These above results demonstrate that dipyridyl ligands have influence on detecting Fe3+ ions in the pillar-layered MOFs.
4. Conclusions
In conclusion, three isostructural, pillar-layered MOFs PL-1, PL-2, and PL-3 with different dipyridyl linkers were selected to study their fluorescence sensing properties. The systematic fluorescence study indicates that PL-1, PL-2, and PL-3 can quickly, selectively, and sensitively detect Fe3+ ions with favorable recyclability by fluorescence quenching. Importantly, the dipyridyl ligand can influence the fluorescence quenching constant of Fe3+ ions. The increase in the length of pillars and accessible volumes in pillar-layered MOFs may lead to the increase in the fluorescence quenching constants (Ksv(PL-1) = 1.58 × 10⁴ M−1) < (Ksv(PL-2) = 1.72 × 10⁴ M−1) < (Ksv(PL-3) = 2.47 × 10⁴ M−1). This work provides an ideal structural model for studying the influence of different dipyridyl ligands on fluorescence sensing in pillar-layered MOFs.Author contributions
Yan-E Liu and Ye Zhou: investigation, preparation, data curation, formal analysis, and writing – original draft; Xiao-Yu Li and Jun Yao: investigation and validation; Qiu-Xia Li and Quan-Qing Xu: data curation, review, and validation; Ai-Xin Zhu and Rong-Rong Zhu: writing – reviewing and editing, supervision, and funding acquisition.Conflicts of interest
The authors declare no competing financial interest.Acknowledgements
This work was financially supported by the National Natural Science Foundation of China (no. 22161052 and 21661035).References
- (a) S. K. Sahoo, D. Sharma, R. K. Bera, G. Crisponi and J. F. Callan, Chem. Soc. Rev., 2012, 41, 7195–7227 RSC; (b) K. P. Carter, A. M. Young and A. E. Palmer, Chem. Rev., 2014, 114, 4564–4601 CrossRef CAS; (c) X. Ma, X. Zhang, L. Han, Z. Hao and S. Yong, Methods Appl. Fluoresc., 2021, 9, 025077 Search PubMed; (d) H. Xu, J. K. Gao, X. F. Qian, J. P. Wang, H. J. He, Y. J. Cui, Y. Yang, Z. Y. Wang and G. D. Qian, J. Mater. Chem. A, 2016, 4, 10900–10905 RSC.
- (a) A. Barba-Bon, A. M. Costero, S. Gil, M. Parra, J. Soto, R. Martinez-Manez and F. Sancenon, Chem. Commun., 2012, 48, 3000–3002 RSC; (b) N. Abbaspour, R. Hurrell and R. Kelishadi, J. Res. Med. Sci., 2014, 19, 164–174 Search PubMed; (c) K. Pantopoulos, S. K. Porwal, A. Tartakoff and L. Devireddy, Biochemistry, 2012, 51, 5705–5724 CrossRef CAS.
- (a) X. Liu and E. C. Theil, Acc. Chem. Res., 2005, 38, 167–175 CrossRef CAS; (b) W. Zhou, R. Saran and J. Liu, Chem. Rev., 2017, 117, 8272–8325 CrossRef CAS; (c) M. Singh, G. Kumar and S. Neogi, Front. Chem., 2021, 9, 651866 CrossRef CAS PubMed.
- (a) X. Y. Xu and B. Yan, ACS Appl. Mater. Interfaces, 2015, 7, 721–729 CrossRef CAS PubMed; (b) M. Arici, Cryst. Growth Des., 2017, 17, 5499–5505 CrossRef CAS; (c) Y. W. Li, J. Li, X. Y. Wan, D. F. Sheng, H. Yan, S. S. Zhang, H. Y. Ma, S. N. Wang, D. C. Li, Z. Y. Gao, J. M. Dou and D. Sun, Inorg. Chem., 2021, 60, 671–681 CrossRef CAS PubMed.
- (a) J. E. Andersen, Analyst, 2005, 130, 385–390 RSC; (b) W. S. Zhong, T. Ren and L. J. Zhao, J. Food Drug Anal., 2016, 24, 46–55 CrossRef CAS.
- (a) A. Matusch, C. Depboylu, C. Palm, B. Wu, G. U. Hoglinger, M. K. Schafer and J. S. Becker, J. Am. Soc. Mass Spectrom., 2010, 21, 161–171 CrossRef CAS; (b) W. Huang, J. Jiao, M. Ru, Z. Bai, H. Yuan, Z. Bao and Z. Liang, Sci. Rep., 2018, 8, 8603 CrossRef.
- D. M. Gomes, M. A. Segundo, J. L. Lima and A. O. Rangel, Talanta, 2005, 66, 703–711 CrossRef CAS PubMed.
- (a) C. M. G. van den Berg, Anal. Chem., 2006, 78, 156–163 CrossRef CAS; (b) S. K. Mittal, S. Rana, N. Kaur and C. E. Banks, Analyst, 2018, 143, 2851–2861 RSC.
- L. L. Hou, Y. H. Song, Y. J. Xiao, R. Wu and L. Wang, Microchem. J., 2019, 150, 104154 CrossRef CAS.
- (a) Z. Yang, X. X. Bai, S. Y. Ma, X. R. Liu, S. S. Zhao and Z. W. Yang, Anal. Methods, 2017, 9, 18–22 RSC; (b) Q. P. Diao, H. Guo, Z. W. Yang, W. W. Luo, T. C. Li and D. Y. Hou, Anal. Methods, 2019, 11, 794–799 RSC; (c) Z. Y. Wu, Z. Y. Xu, J. W. Yan, Y. F. Li, Q. Y. Kou and L. Zhang, New J. Chem., 2019, 43, 1725–1732 RSC; (d) H. L. Chen, X. F. Bao, H. Shu, B. J. Zhou, R. L. Ye and J. Zhu, Sens. Actuators, B, 2017, 242, 921–931 CrossRef CAS.
- (a) N. Ahfad, G. Mohammadnezhad, S. Meghdadi and H. Farrokhpour, Spectrochim. Acta, Part A, 2020, 228, 117753 CrossRef CAS; (b) F. Liu, P. Tang, R. Ding, L. Liao, L. Wang, M. Wang and J. Wang, Dalton Trans., 2017, 46, 7515–7522 RSC.
- T. Li, Y. J. Sheng, X. L. Sun, W. M. Wan, Y. Liu, Q. Qian and Q. Chen, Polymers, 2022, 14, 2025 CrossRef CAS PubMed.
- (a) S. Ding, Y. Gao, B. S. Ni and X. D. Yang, Inorg. Chem. Commun., 2021, 130, 108636 CrossRef CAS; (b) X. Wang, H. Xiong, T. H. Chen, Y. Y. Xu, G. X. Bai, J. J. Zhang, Y. Tian and S. Q. Xu, Opt. Mater., 2021, 119, 111393 CrossRef CAS.
- (a) R. Kumar, P. Gahlyan, N. Yadav, M. Bhandari, R. Kakkar, M. Dalela and A. K. Prasad, Dyes Pigm., 2017, 147, 420–428 CrossRef CAS; (b) M. Ucuncu, J. Fluoresc., 2023, 33, 707–712 CrossRef CAS PubMed; (c) Y. Wu, Z. Meng, F. Zhao, S. Wang, Z. Wang and Y. Yang, Spectrochim. Acta, Part A, 2023, 284, 121767 CrossRef CAS; (d) Y. S. Yang, F. N. Wang, Y. P. Zhang, F. Yang and J. J. Xue, J. Fluoresc., 2023, 3, DOI:10.1007/s10895-023-03213-.
- Z. Q. Yan, L. Hu and J. M. You, Anal. Methods, 2016, 8, 5738–5754 RSC.
- (a) Y. Su, J. H. Yu, Y. B. Li, S. F. Z. Phua, G. F. Liu, W. Q. Lim, X. Z. Yang, R. Ganguly, C. Dang, C. L. Yang and Y. L. Zhao, Commun. Chem., 2018, 1, 12 CrossRef; (b) C. X. Yang, H. B. Ren and X. P. Yan, Anal. Chem., 2013, 85, 7441–7446 CrossRef CAS; (c) Y. Zhao, X. Xu, L. Qiu, X. Kang, L. Wen and B. Zhang, ACS Appl. Mater. Interfaces, 2017, 9, 15164–15175 CrossRef CAS PubMed; (d) S. Chen, Z. Shi, L. Qin, H. Jia and H. Zheng, Cryst. Growth Des., 2016, 17, 67–72 CrossRef.
- (a) K. M. Wang, L. Du, Y. L. Ma, J. S. Zhao, Q. Wang, T. Yan and Q. H. Zhao, CrystEngComm, 2016, 18, 2690–2700 RSC; (b) R. Debnath, R. Bhowmick, P. Ghosh, S. Biswas and S. Koner, New J. Chem., 2022, 46, 8523–8533 RSC; (c) H. He, Q.-Q. Zhu, C.-P. Li and M. Du, Cryst. Growth Des., 2018, 19, 694–703 CrossRef; (d) A. A. Sapianik, M. O. Barsukova, K. A. Kovalenko, D. G. Samsonenko and V. P. Fedin, Dalton Trans., 2021, 50, 2807–2814 RSC.
- (a) R. R. Zhu, T. Wang, D. W. Wang, T. Yan, Q. Wang, H. X. Li, Z. Xue, J. Zhou, L. Du and Q. H. Zhao, New J. Chem., 2019, 43, 1494–1504 RSC; (b) Z. Z. Xiao, L. J. Han, Z. J. Wang and H. G. Zheng, Dalton Trans., 2018, 47, 3298–3302 RSC; (c) Y. J. Liang, J. Yao, M. Deng, Y. E. Liu, Q. Q. Xu, Q. X. Li, B. Jing, A. X. Zhu and B. Huang, CrystEngComm, 2021, 23, 7348–7357 RSC; (d) J. R. Zhang, J. J. Lee, C. H. Su, M. J. Tsai, C. Y. Li and J. Y. Wu, Dalton Trans., 2020, 49, 14201–14215 RSC.
- (a) Q. J. Jiang, J. Y. Lin, Z. J. Hu, V. K. S. Hsiao, M. Y. Chung and J. Y. Wu, Cryst. Growth Des., 2021, 21, 2056–2067 CrossRef CAS; (b) S. T. Wang, X. Zheng, S. H. Zhang, G. Z. Li and Y. Xiao, CrystEngComm, 2021, 23, 4059–4068 RSC; (c) P. M. Chuang, Y. W. Huang, Y. L. Liu and J. Y. Wu, CrystEngComm, 2021, 23, 2222–2234 RSC.
- (a) R. R. Zhu, T. Wang, T. Yan, L. Jia, Z. Xue, J. Zhou, L. Du and Q. H. Zhao, Dalton Trans., 2019, 48, 12159–12167 RSC; (b) Y. Yu, Y. Wang, H. Yan, J. Lu, H. Liu, Y. Li, S. Wang, D. Li, J. Dou, L. Yang and Z. Zhou, Inorg. Chem., 2020, 59, 3828–3837 CrossRef CAS; (c) S. S. Chen, Z. Y. Zhang, R. B. Liao, Y. Zhao, C. Wang, R. Qiao and Z. D. Liu, Inorg. Chem., 2021, 60, 4945–4956 CrossRef CAS; (d) Y. Q. Su, L. Fu and G. H. Cui, Dalton Trans., 2021, 50, 15743–15753 RSC.
- (a) Y. Lin, X. Zhang, W. Chen, W. Shi and P. Cheng, Inorg. Chem., 2017, 56, 11768–11778 CrossRef CAS; (b) Y. T. Yan, J. Liu, G. P. Yang, F. Zhang, Y. K. Fan, W. Y. Zhang and Y. Y. Wang, CrystEngComm, 2018, 20, 477–486 RSC; (c) X. Zhang, Z. J. Wang, S. G. Chen, Z. Z. Shi, J. X. Chen and H. G. Zheng, Dalton Trans., 2017, 46, 2332–2338 RSC.
- J. Yao, Y. E. Liu, L. B. Yang, A. N. Dou, C. F. Hou, Q. Q. Xu, B. Huang and A. X. Zhu, CrystEngComm, 2020, 22, 5970–5979 RSC.
- (a) H. M. Chai, J. L. Yan, G. Q. Zhang, J. X. Wang, Y. X. Ren and L. J. Gao, Inorg. Chem., 2022, 61, 7286–7295 CrossRef CAS PubMed; (b) M. Y. Zhang, F. Y. sYi, L. J. Liu, G. P. Yan, H. Liu and J. F. Guo, Dalton Trans., 2021, 50, 15593–15601 RSC; (c) J. Q. Wu, X. Y. Ma, C. L. Liang, J. M. Lu, Q. Shi and L. X. Shao, Dalton Trans., 2022, 51, 2890–2897 RSC; (d) L. J. Zhao, B. Li and G. P. Yong, CrystEngComm, 2023, 25, 2813–2823 RSC.
- (a) M. Y. Zhang, F. Y. Yi, Q. Z. Guo, F. L. Luo, L. J. Liu and J. F. Guo, Dalton Trans., 2023, 52, 3300–3307 RSC; (b) P. Cen, C. Liang, L. Duan, M. Wang, D. Tian and X. Liu, New J. Chem., 2020, 44, 16076–16081 RSC; (c) M. Shi, C. C. Fu, J. Yu, Y. P. Yang and P. F. Shi, New J. Chem., 2022, 46, 18911–18916 RSC.
- (a) S. K. Panda, S. Mishra and A. K. Singh, Dalton Trans., 2021, 50, 7139–7155 RSC; (b) F. Rouhani, M. Ghiasvand and N. Safari, New J. Chem., 2023, 47, 13703–13709 RSC; (c) E. P. Asiwal, D. S. Shelar, C. S. Gujja, S. T. Manjare and S. D. Pawar, New J. Chem., 2022, 46, 12679–12685 RSC.
- (a) L. J. Han, W. Yan, S. G. Chen, Z. Z. Shi and H. G. Zheng, Inorg. Chem., 2017, 56, 2936–2940 CrossRef CAS PubMed; (b) Z. Q. Liu, Y. Zhao, X. D. Zhang, Y. S. Kang, Q. Y. Lu, M. Azam, S. I. Al-Resayes and W. Y. Sun, Dalton Trans., 2017, 46, 13943–13951 RSC; (c) Y. Xiong, G. Liu, X. Wang, J. Zhang, H. Lin and X. Sha, CrystEngComm, 2017, 19, 4561–4570 RSC.
- (a) X.-T. Hu, Z. Yin, X.-P. Luo, C.-H. Shen and M.-H. Zeng, Inorg. Chem. Commun., 2021, 129, 108664 CrossRef CAS; (b) M. Singh, S. Senthilkumar, S. Rajput and S. Neogi, Inorg. Chem., 2020, 59, 3012–3025 CrossRef CAS PubMed.
- (a) W. S. Zhang, G. Q. Wang, Y. X. Wang, Y. L. Yang, X. Bai, H. Cui, Y. Lu and S. X. Liu, Dalton Trans., 2023, 52, 4407–4414 RSC; (b) K. Talha, Alarngir, T. He, L. H. Xie, B. Wang, M. J. Zhao, Y. Z. Zhang, Q. Chen and J. R. Li, New J. Chem., 2020, 44, 11829–11834 RSC.
- (a) A. X. Zhu, Q. Y. Yang, A. Kumar, C. Crowley, S. Mukherjee, K. J. Chen, S. Q. Wang, D. O’Nolan, M. Shivanna and M. J. Zaworotko, J. Am. Chem. Soc., 2018, 140, 15572–15576 CrossRef CAS PubMed; (b) S. Liang, F. Y. Ge, S. S. Ren, M. Y. Lei, X. J. Gao and H. G. Zheng, Dalton Trans., 2021, 50, 7409–7416 RSC.
- (a) A. Mandal, A. Adhikary, A. Sarkar and D. Das, Inorg. Chem., 2020, 59, 17758–17765 CrossRef CAS; (b) S. Dang, E. Ma, Z. M. Sun and H. J. Zhang, J. Mater. Chem., 2012, 22, 16920–16926 RSC.
- J. Wieme, S. M. J. Rogge, P. G. Yot, L. Vanduyfhuys, S. K. Lee, J. S. Chang, M. Waroquier, G. Maurin and V. Van Speybroeck, J. Mater. Chem. A, 2019, 7, 22663–22674 RSC.
- S. Wannapaiboon, A. Schneemann, I. Hante, M. Tu, K. Epp, A. L. Semrau, C. Sternemann, M. Paulus, S. J. Baxter, G. Kieslich and R. A. Fischer, Nat. Commun., 2019, 10, 346 CrossRef CAS.
- A. Schneemann, P. Vervoorts, I. Hante, M. Tu, S. Wannapaiboon, C. Sternemann, M. Paulus, D. C. F. Wieland, S. Henke and R. A. Fischer, Chem. Mater., 2018, 30, 1667–1676 CrossRef CAS.
- G. F. Turner, S. C. McKellar, D. R. Allan, A. K. Cheetham, S. Henke and S. A. Moggach, Chem. Sci., 2021, 12, 13793–13801 RSC.
- A. X. Zhu, Q. Y. Yang, S. Mukherjee, A. Kumar, C. H. Deng, A. A. Bezrukov, M. Shivanna and M. J. Zaworotko, Angew. Chem., Int. Ed., 2019, 58, 18212–18217 CrossRef CAS PubMed.
- B. A. Coombs, S. R. Rutter, A. E. Goeta, H. A. Sparkes, A. S. Batsanov and A. Beeby, RSC Adv., 2012, 2, 1870–1876 RSC.
- G. L. Yang, X. L. Jiang, H. Xu and B. Zhao, Small, 2021, 17, 2005327 CrossRef CAS PubMed.
- J. Li, L. H. Wu, S. L. Yao, H. Xu, T. F. Zheng, S. J. Liu, J. L. Chen and H. R. Wen, New J. Chem., 2021, 45, 22915–22923 RSC.
- H. Xu, H. C. Hu, C. S. Cao and B. Zhao, Inorg. Chem., 2015, 54, 4585–4587 CrossRef CAS.
- S. Ding, C. Cheng, J. H. Xu, Z. Tang, G. S. Yang, S. F. Peng, L. Q. Yu, C. J. Jiang and Z. M. Su, New J. Chem., 2022, 46, 18710–18717 RSC.
Footnotes |
| † Electronic supplementary information (ESI) available: PXRD patterns, excitation and emission spectra, XPS spectra, and UV-vis absorption spectrum. See DOI: https://doi.org/10.1039/d3nj03489e |
| ‡ These authors contributed equally to this paper. |
| This journal is © The Royal Society of Chemistry and the Centre National de la Recherche Scientifique 2024 |

