DOI:
10.1039/D3NJ03311B
(Paper)
New J. Chem., 2024,
48, 79-88
Preparation and characterisation of wheat starch-based aerogels for procyanidin encapsulation to enhance stability
Received
16th July 2023
, Accepted 20th November 2023
First published on 21st November 2023
Abstract
Procyanidins (PC) are formed by the polymerisation of flavan-3-ol monomers, which have excellent bioactivity and present great health benefits. However, the application range of the PC is greatly limited due to their poor stability. Therefore, in this study, starch aerogels were used as carriers to encapsulate PC. After screening, wheat starch aerogel (WSA) was finally chosen to encapsulate PC. Afterward, characterization (SEM, XRD, FT-IR, TGA and BET), stability testing, investigations on antioxidant activity, and in vitro tests simulating digestion were carried out. The results of relevant characterization showed that the micro surface structure of the procyanidin wheat starch aerogel (PC-WSA) presented a network structure, and PC were encapsulated in WSA. In addition, PC-WSA allows PC to be released in the final stage of simulated digestion. Meanwhile, the results of antioxidant experiments indicate that PC-WSA exhibits antioxidant activity after encapsulating PC. Moreover, the retention of PC in PC-WSA was still 53.63 ± 3.23% when stored at 70 °C for 20 days. After 6 days of light exposure, the retention of PC in PC-WSA under different light sources was all above 85%, which was higher than that of PC. In conclusion, the wheat starch aerogel could improve the stability of PC and has great potential for application.
1 Introduction
Procyanidins (PC) are polyphenolic compounds formed by the condensation of different amounts of flavan-3-ol unit and are widely found in fruits and cereals.1,2 PC have potent biological activities, including antioxidant,3–6 anti-inflammatory,7–9 antibacterial,10,11 anti-hypertensive,12,13 blood glucose and lipid regulation,14–16 chemoprevention,17–19 prevention of cardiovascular diseases,20–22 and treatment of Alzheimer's disease.23–25 However, PC are unstable and susceptible to high temperatures, light and pH, and their constituents are prone to change during production and storage.26–29 These detrimental effects on PC stability have significant implications on their bioavailability and can impose limitations on their application. Consequently, it becomes imperative to identify and implement effective strategies for enhancing the stability of procyanidins. To enhance the stability of PC, researchers have explored various methods in previous studies, including liposomes,30,31 microcapsules,32,33 protein complexes34,35 or nanoparticles.36 However, these methods suffer from issues such as molecular leakage, thermal degradation, easy dissociation, and stringent preparation conditions.37 Aerogels, a novel porous material, possess high surface area, low density, and high porosity.37,38 Starch, due to its safety, storage stability, and low cost, has been considered as a potential raw material for the preparation of bio-based aerogels.39 When a cross-linking agent is added in the preparation of starch aerogels, they exhibit higher stability, better solubility, faster digestion rate, and a more uniform network structure.40–42 Starch aerogels are being applied to enhance the bioavailability of active ingredients,43 offering a promising material to overcome the limitations of conventional delivery systems and address the commercial bottlenecks in the emerging green field. Starch aerogels have been used as carriers for the delivery of bioactive substances.44,45 Compared to “crystalline ibuprofen”, the dissolution rate and solubility of ibuprofen loaded by starch aerogels were improved.46 Besides, after impregnating phytosterols into nano-porous starch aerogel, their bioavailability is significantly improved.47 In a previous study, starch aerogel was employed as a carrier for pinhão coat extract (PCE). In an in vitro simulated digestion experiment, it was found that the starch aerogel could maintain the release of PCE phenolic compounds at the final stage, while it also had a protective effect on PCE.48 β-Carotene is unstable when exposed to UV light, resulting in its poor bioavailability. Zhang et al. used corn starch aerogel to encapsulate β-carotene and found that the stability of β-carotene was significantly improved, indicating that the corn starch aerogel played an effective protective role.49 To our knowledge, there is nearly no research about starch aerogel encapsulation of PC in order to enhance their stability.
In this study, three types of starch aerogels were screened and utilized for the encapsulation of procyanidins. The wheat starch aerogels were characterized by SEM, PXRD, BET, FT-IR and TGA. Furthermore, they were subjected to in vitro digestion experiments, stability investigations, and antioxidant studies. This study provides theoretical support for the utilization of starch aerogels to enhance the stability of procyanidins and promote the loading of active substances.
2 Materials and methods
2.1 Materials and chemicals
Wheat starch (WS) and rice starch (RS) were purchased from Shanghai Yuanye Biotechnology Co., Ltd Corn starch (CS), porcine pepsin (3000 U mg−1) and porcine pancreatic pancrelipase were purchased from Shanghai Aladdin Biochemical Technology Co., Ltd. Sodium hexametaphosphate (SHMP) was purchased from Shanghai Macklin Biochemical Technology Co., Ltd. Procyanidins (purity > 95%) were purchased from Shanghai Boer Chemical Reagent Co. Other chemicals were provided by Sinopharm Chemical Reagent Co., Ltd.
2.2 Preparation of PC starch aerogels
The PC starch aerogels were prepared according to a previous study.49 0.45 g of SHMP and 15.0 g of starch (CS, WS, RS) were mixed in 85 mL of distilled water, and then procyanidin solution (500 mg of procyanidins dissolved in 5 mL of anhydrous ethanol) was added to the mixture. The mixture was stirred at 90 °C for 15 min to achieve starch pasting, and poured into cylindrical polypropylene molds after cooling. The molds were placed in a refrigerator at 4 °C and removed after 48 h to be cut into small pieces about 2 cm long, and then dried in a freeze dryer (FD-1A-50, BioCool Experimental Instruments, Beijing, China) at −40 °C for 24 h to obtain procyanidin starch aerogels. Procyanidin corn starch aerogel (PC-CSA), procyanidin wheat starch aerogel (PC-WSA) and procyanidin rice starch aerogel (PC-RSA) were obtained, respectively. The above preparations were carried out under light-proof conditions.
2.3 The screening of PC starch aerogels
The prepared starch aerogels were screened according to the appearance and drug loading capacity. The specific experimental method was as follows: 0.25 g of PC starch aerogel was dissolved in 50% ethanol (5 mL), and then centrifuged after vortexing and sonication. The supernatant was taken for the assay of PC content. The estimation of the content of PC was performed by the vanillin-sulfuric acid method with some modifications according to the method of Sun et al.50 50 μL of methanol-diluted sample, 125 μL of 1% vanillin-methanol solution and 125 μL of 25% sulfuric acid-methanol solution were added to a 96-well plate and the reaction was performed at room temperature in the dark for 20 min, followed by detection at 492 nm. The drug loading of the PC loaded starch aerogels was calculated using eqn (1).| |  | (1) |
where, M1 is the amount of PC released from procyanidin starch aerogels, and M2 is the mass of the procyanidin starch aerogels.
2.4 Scanning electron microscopy (SEM)
The morphology of the samples was observed using a scanning electron microscope (JSM-6700F, JEOL, Japan). The device was operated at 15 kV and 10 mA. A portion of the sample was sliced and placed on a double-sided conductive carbon adhesive which was fixed to the copper plate followed by a gold sputtering process.
2.5 Fourier transform-infrared (FT-IR) spectroscopy
The samples were evaluated by FT-IR spectroscopy. The samples mentioned above were mixed and ground with KBr (1![[thin space (1/6-em)]](https://www.rsc.org/images/entities/char_2009.gif) :100), and then the mixtures were pressed into clear flakes. Their spectra were collected between 4000 cm−1 and 400 cm−1 using an FT-IR spectrometer (NICOLET iS50, Thermo Scientific, USA).
:100), and then the mixtures were pressed into clear flakes. Their spectra were collected between 4000 cm−1 and 400 cm−1 using an FT-IR spectrometer (NICOLET iS50, Thermo Scientific, USA).
2.6 Powder X-ray diffraction (PXRD)
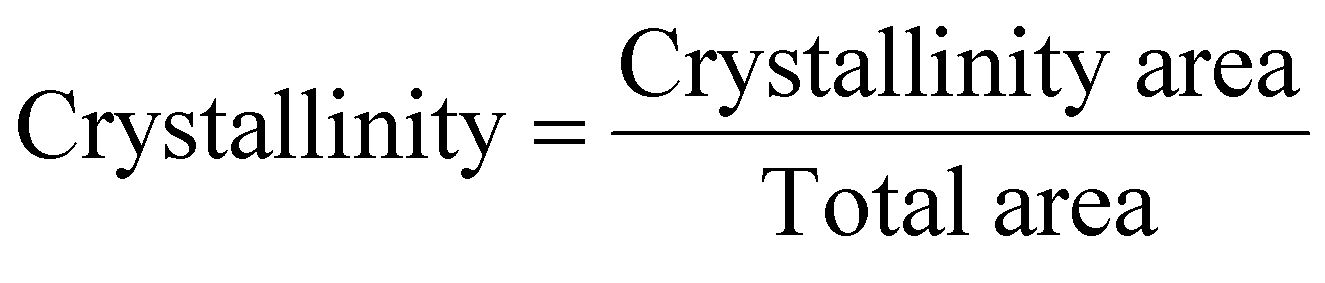
X-ray diffraction patterns of four samples (PC, starch, starch aerogel and PC starch aerogel) were obtained using an X-ray diffractometer (X’Pert PRO MPD, PANalytical B.V., the Netherlands) at 40 mA and 30 kV. The angle range was 5–90° (2θ). The crystallinity was calculated with the formula shown below.| |  | (2) |
2.7 Thermogravimetric analysis (TGA)
The thermal stability of samples was analyzed using a thermogravimetric analyzer (TGA, LABSYS EVO, SETARAM LABSYS, France). Nitrogen was used as the carrier gas at a flow rate of 100 mL min−1; the detection temperature was increased from 21 °C to 600 °C at a heating rate of 10 °C min−1.
2.8 BET analysis
The BET surface area, pore volume parameters and pore size of the samples were determined using an automated N2 adsorption specific surface physical absorption analyzer (Autosorb iQ, Quantachrome Instruments, USA). The samples were degassed at 115 °C for 4 h and subjected to N2 gas adsorption/desorption experiments under liquid nitrogen.
2.9 Stability study
2.9.1 Stability of PC under high temperature.
The samples were placed in 50 °C and 70 °C ovens and stored away from light for 20 days. The PC concentrations of the samples were assayed at a fixed interval. and the retention rate of PC was calculated to investigate the stability of starch. The formula for retention rate calculation is shown below.| |  | (3) |
where, W1 is the PC concentration after treatment, and W2 is the original PC concentration.
2.9.2 Stability of PC under light irradiation.
The samples were placed under natural light, room light and UV light for 6 days. On day 6, the procyanidin concentration of each sample was measured and the PC preservation rate was calculated. The equation for the retention rate calculation is the same as eqn (3).
2.9.3 HPLC analysis.
The detection of PC B1, PC B2, and PC B3 was performed by HPLC. The analysis was conducted using an Agilent 1260 Infinity system, using a C18 chromatographic column (5 μm, 4.6 × 250 nm) for separation, at a column temperature of 30 °C and a flow rate of 0.6 mL min−1. The mobile phase consists of methanol and 0.0.2% acetic acid; gradient elution (the methanol phase is 15–25% at 0–15 min, 25–60% at 16–40 min, and 60–15% at 40–50 min) was performed.
2.10 Release in simulated gastrointestinal conditions
Simulated gastric fluid (SGF) and simulated intestinal fluid (SIF) were configured according to previous reports with some modifications.51 About 2 g of samples was mixed with 15 mL of simulated gastric fluid (SGF: 15 mL of saline (9 g L−1) and 0.045 g of pepsin were mixed; the pH was adjusted to 1.5 with 1 M sodium hydroxide or 1 M hydrochloric acid) and stirred for 1 h at 37 °C. 2 mL of the solution was taken at 30 min and 60 min for the assay and replenished with gastric fluid. The mixture was then adjusted to pH 7.5 and mixed with 15 mL of simulated intestinal fluid (SIF: 0.15 g of trypsin and 0.045 g of bile salts were mixed with 15 mL of phosphate buffer solution at pH 7.5). The mixture was then stirred for 3 h and sampled at 180 min, 210 min and 240 min. The samples obtained above were centrifuged (3200 rpm, 5 min) and filtered through 0.45 μm filter membrane. Procyanidin B1 (PC B1), procyanidin B2 (PC B2) and procyanidin B3 (PC B3) contents were detected.
2.11
In vitro antioxidant activity study
The DPPH radical scavenging assay is a common method to determine the antioxidant activity of natural products. Briefly, 100 μL of sample solutions with different concentrations were mixed with 100 μL of DPPH (0.2 mM). The solutions were mixed thoroughly and then kept in the dark for 30 min. The absorbance was then analyzed at 520 nm using a UV detector.
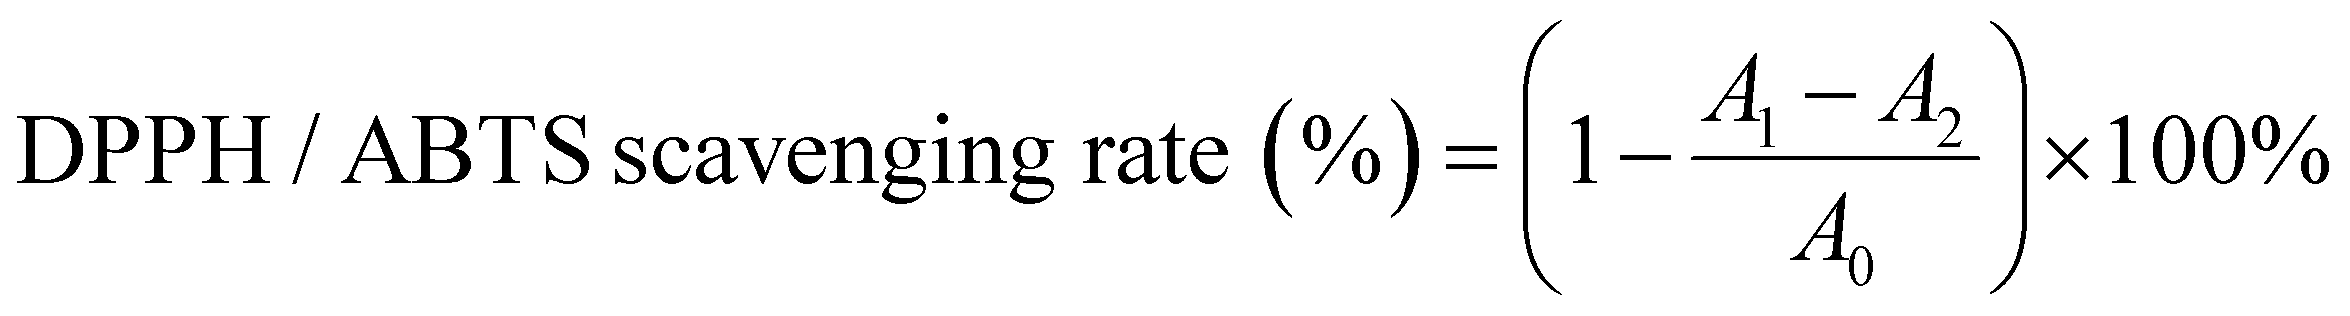
For the ABTS experiments, the test was carried out according to the method of Chang et al. with minor modifications.52 First, 7 mM ABTS was mixed with 140 mM potassium persulfate in water and kept in the dark for 12 hours. The above obtained solution was then diluted with water until the absorbance was around 0.7 (at 700 nm). Subsequently, 50 μL of the sample solution was mixed with 200 μL of ABTS working solution in a 96-well plate. After thorough mixing, the solution was kept in the dark for 6 min, and then the absorbance was measured at 700 nm using a UV detector. The formula for calculating the scavenging rate is shown below.
| |  | (4) |
where
A1 is the absorbance of sample group,
A2 is the absorbance of control group, and
A0 is the absorbance of blank group.
2.12 Statistical analysis
All experiments were repeated at least twice and mean values and standard deviations were calculated. The data were plotted using origin2018 software (Origin Lab Corporation, Northampton, MA, USA) and analyzed using the ANOVA test.
3 Results and discussion
3.1 Screening of PC-loaded starch aerogels
The preparation process of PC starch aerogel is shown in Fig. 1, and Fig. 1A shows the stages of the formation of starch hydrogel. Except for RS, both WS and CS hydrogels successfully formed tight gel structures, which may be related to the low content of straight-chain starch in rice starch (the amylose content of wheat starch > the amylose content of corn starch > the amylose content of rice starch.)39,53 Meanwhile, the LC of wheat starch aerogel (1.16 ± 0.03%) was higher than that of corn starch aerogel (1.07 ± 0.07%), which may be related to the different structure of starch and the nature of PC, and hence the subsequent selection of PC-WSA for the experiment.
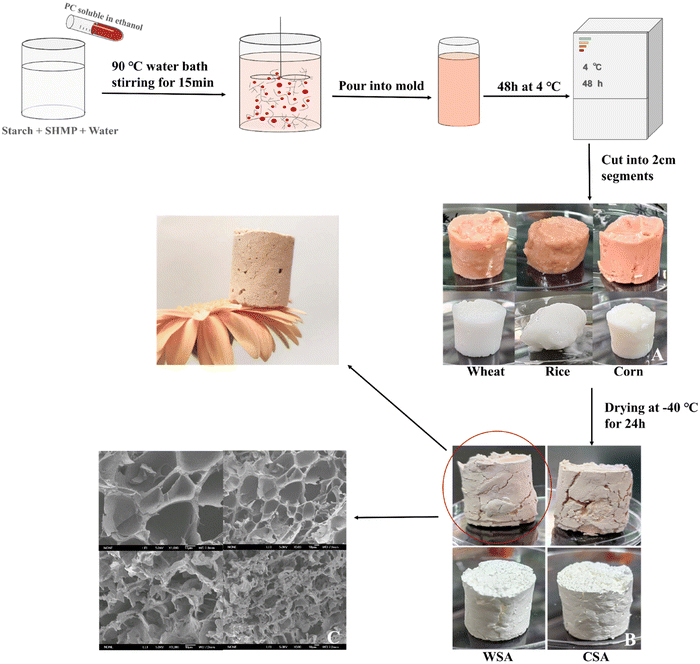 |
| | Fig. 1 Preparation of PC starch aerogel, (A) hydrogel stage, (B) starch aerogel, and (C) microscopic surface structure of WSA and PC-WSA; WSA, wheat starch aerogel; CSA, corn starch aerogel; SHMP, sodium hexametaphosphate. | |
3.2 Characterization of WSA and PC-WSA
The morphology of WSA and PC-WSA was shown by SEM images (as displayed in Fig. 2). Before encapsulating the PC, the WSA exhibited a laminar structure with a large pore network of about 10 μm, which was possibly related to the growth of ice crystals and the shrinkage of micropores.37,54 After encapsulating the PC, its lamellar structure disappeared, and PC-WSA showed a mesh structure of different sizes and some pores were filled. Meanwhile, according to Fig. 2, the pore size of PC-WSA seems to be larger than that of WSA, which was also observed in the BET analysis (Table 1). The change in its microstructure may be due to the fact that the added ethanol formed an amorphous starch matrix with the starch paste, thus randomly trapping the PC molecules through non-specific interactions.55 In addition, probably due to the water solubility of PC, they were dissolved into the pores during the preparation process and part of the pores were filled.
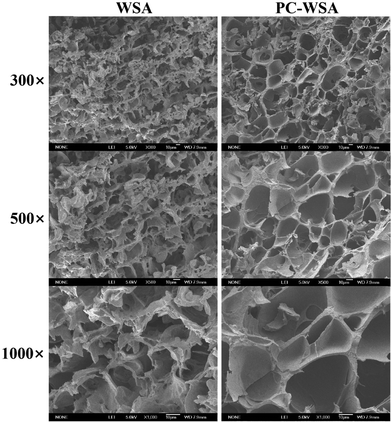 |
| | Fig. 2 Scanning electron microscopy (SEM) of WSA and PC-WSA. | |
Table 1 BET surface area and pore structural parameters of PC-WSA and WSA
|
|
BET surface area (m2 g−1) |
Average pore diameter (nm) |
Total pore volume (cc g−1) |
| WSA |
2.391 |
19.575 |
1.170 × 10⁻² |
| PC-WSA |
8.108 |
23.108 |
4.684 × 10⁻² |
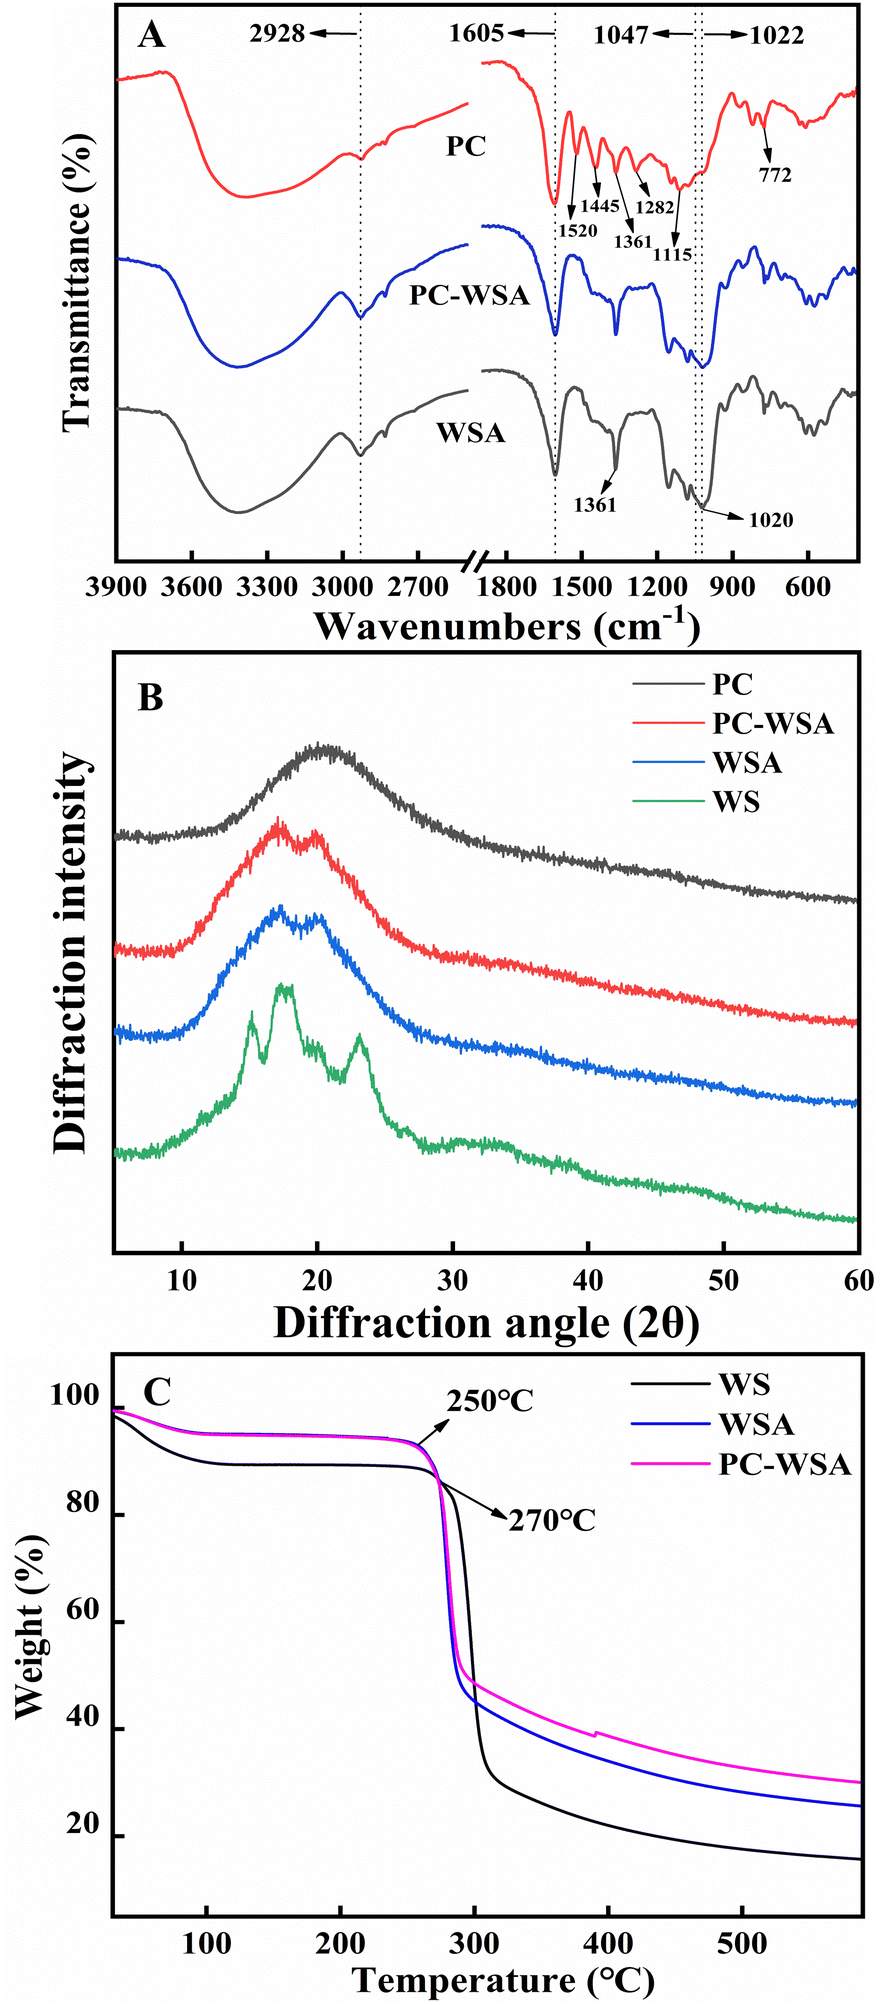
The structures of WSA, PC-WSA and PC and their interactions were analyzed by FT-IR spectroscopy (Fig. 3A). The broadband between 3600–3000 cm−1 corresponds to the –OH stretching vibration (present in both PC and carbohydrates)56 and the peak at 2928 cm−1 represents the stretching vibration of –CH. The weaker absorption peaks at 1605 cm−1 and 1047 cm−1 may be in that the addition of cross-linking agents restrict or replace the intermolecular hydrogen bonds.42 Starch usually shows adsorption bands caused by C–O, C–C and C–O–H stretching and C–O–H bending in the region of 1200–1000 cm−1,57 while the absorption peaks between 1400–1150 cm−1 and 1050–995 cm−1 were caused by the vibration of the P–O band and the P–O–C stretching vibration.42 The above results indicate that the addition of crosslinking agents combined with some characteristic peaks of starch confirms the effectiveness of wheat starch crosslinking. The characteristic peaks of PC are at 1520 cm−1, 1445 cm−1, 1361 cm−1, 1282 cm−1, 1115 cm−1 and 772 cm−1, where the peaks at 1520 cm−1 and 1445 cm−1 generally represent the structures of aromatic compounds,58 and the corresponding absorption peaks at 1361 cm−1 and 1282 cm−1 are the vibrations of saturated C–C bonds,56 the corresponding absorption peaks at 1115 cm−1 were the C–H stretching vibrations of the benzene ring in the molecular structure of PC,58 with peak at 772 cm−1 indicating a higher frequency of out of plane deformation vibration of the unsaturated C–H of the aromatic ring of PC.59 However, none of the characteristic peaks of PC appeared in PC-WSA, and the characteristic peaks of PC between 1500–770 cm−1 after WSA encapsulation were completely covered by the adsorption bands caused by WSA. Meanwhile, both PC-WSA and WSA showed a large number of adsorption bands in the range of 1700–1200 cm−1, which could be secondary components such as proteins or lipids in starch,57 while the characteristic 1520 cm−1 peak in this region was completely masked. All this indicate that PC are encapsulated in WSA. In addition, the bands at 1047 cm−1 and 1022 cm−1 were related to the ordered and amorphous structures of starch, respectively.60 The ratio of 1047 cm−1 to 1022 cm−1 indicated the short-range molecular order of starch, and the ratio of PC-WSA (1.13) was lower than that of WSA (1.14), indicating that its short-range molecular order decreased after the addition of PC.
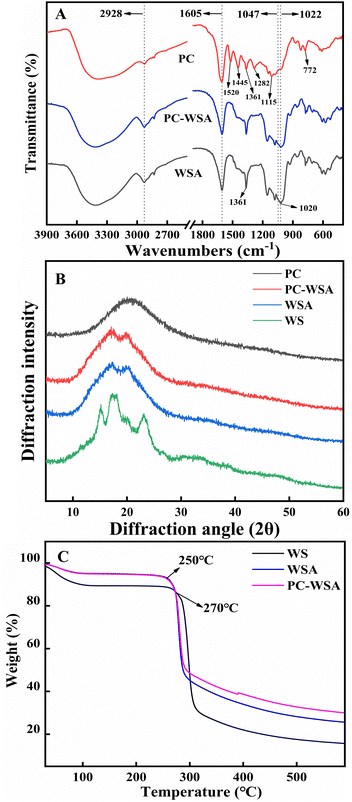 |
| | Fig. 3 (A) FT-IR of PC, WSA, and PC-WSA; (B) powder X-ray diffraction (PXRD) of WS, WSA, PC, and PC-WSA; and (C) TGA curves of WS, WSA and PC-WSA. | |
The shift, disappearance or change in crystallinity of the PXRD peak can indicate the availability of substance encapsulation. Fig. 3B shows the PXRD patterns and crystallinity of WS, WSA and PC-WSA. WS has strong diffraction peaks at 15.149°, 17.355°, 18.024°, 23.070°, indicating that it has an A-type crystal structure.53 However, WSA showed only two diffraction peaks at 17.12° and 20.22°, while all the characteristic peaks of WS disappeared, which is consistent with the study of Ubeyitogullari et al.61 After being encapsulated by WSA, the peak of the PC disappeared and its diffraction peak was identical to the WSA peak pattern. The crystallinity of PC-WSA (0.62) was lower than that of WSA (0.68), indicating that the addition of PC decreased the long-range molecular order, which may be attributed to the disruption of the crystal structure by PC.62 This shows that its characteristic peak is hidden in the aerogel after encapsulation, which can indicate that the PC was completely encapsulated in WSA.
TGA was performed for WS, WSA and PC-WSA, respectively (Fig. 3C), and TGA is an effective means to determine the intermolecular interactions and the stability of the substances during the reaction. A certain weight loss occurred in all samples at around 20–100 °C, which may be due to the loss of water. Weight loss occurred at about 270 °C for WS and at about 250 °C for both PC-WSA and WSA, which may be attributed to the degradation of starch at high temperatures.63 PC-WSA (the final residual solid mass was 29.9%) showed higher thermal stability than WSA (the final residual solid mass was 25.6%), indicating the interaction between PC and WSA and the successful encapsulation of PC by WSA. The better thermal stability of WSA (weight loss rate at 250 °C: 93.6%, weight loss rate at 270 °C: 88.7%) compared to WS (weight loss rate at 250 °C: 88.9%, weight loss rate at 270 °C: 87.3%) indicated the contribution of cross-linking of WSA to the thermal stability of aerogels.41
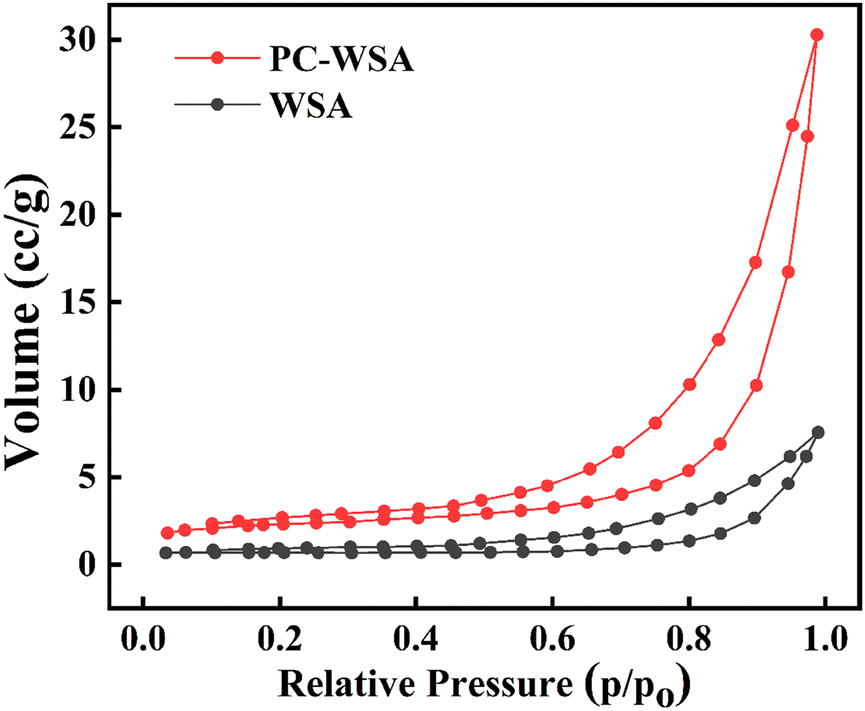
The data of BET surface area, total pore volume and average pore size of the samples are shown in Table 1, and Fig. 4 shows the nitrogen adsorption isotherms. Both samples have type IV isotherms, which is one of the main characteristics of mesoporous materials.64 Moreover, both samples have H3-type mesoporous hysteresis loops, which can indicate that both samples have slit-like pores formed by the accumulation of lamellar materials,65 which reflected the lamellar structure in SEM. According to the IUPAC classification,66 porous materials can be classified into microporous (average pore diameter less than 2 nm), mesoporous (average pore diameter between 2 nm and 50 nm) and macroporous (average pore diameter greater than 50 nm) based on their pore diameters.67 The average pore sizes of 19.575 nm and 23.108 nm for WSA and PC-WSA, respectively, are in the mesoporous range, which is consistent with the results reflected by the isothermal curve. In addition, as shown in Table 1, the BET surface area, pore size and total pore volume of PC-WSA were all increased compared to WSA. This is presumably because the addition of PC inhibited the growth of ice crystals and shrinkage of micropores due to the cold drying process to a certain extent and maintained the micropore structure. In the other hand, it may be due to the formation of a new network by the interaction between PC and starch. Meanwhile, it may also be because the average pore size formed by the interaction between PC and starch is likely to be larger compared to the interaction between starch and starch. The above results also demonstrate the interaction between the PC and the WSA, confirming that WSA successfully encapsulates PC.
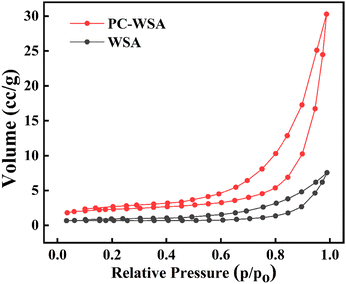 |
| | Fig. 4 Nitrogen adsorption–desorption isotherms for PC-WSA and WSA. | |
3.3 Release of PC under simulated digestion conditions
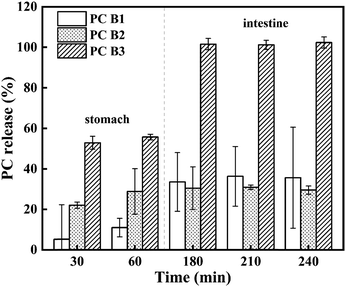
The bioavailability of PC is correlated with their degree of polymerisation. PC B1, PC B2 and PC B3 are all dimers, and procyanidin dimers have the highest absorption rate compared to other aggregates.68 Hence, this experiment was carried out to examine the release behavior of PC B1, PC B2 and PC B3 of PC-WSA during the simulated digestion. The in vitro digestion of PC-WSA was simulated in gastric and intestinal fluids, and the results are shown in Fig. 5. From the results, it could be seen that the release of PC displayed an increasing trend. At 60 min, the release rate reached 10.92%, 28.93% and 55.69% for PC B1, PC B2 and PC B3, respectively. The release of all PC B1, PC B2 and PC B3 was nearly stable at 180 min. PC-WSA releases more PC in the SIF and relatively less PC in the SGF, probably due to the introduction of phosphate groups that make PC-WSA more stable in the gastric fluid phase. Meanwhile, the increased stability of PC-WSA might also be responsible for the lower release rate of PC B1 and PC B2.48 This is similar to previous studies in which modified starch aerogels (with the introduction of phosphate groups) and natural starch aerogels were used to load pinhão coat extract, and ultimately found that phenolic compounds were released in greater amounts in the simulated intestinal fluid and that modified starch was more difficult to degrade than the natural starch.48 In the report by Song et al. the mixture of corn starch and procyanidins (SP) and the mixture of corn starch, corn protein and procyanidins (SZP) were extruded to prepare the particles separately. Among them, the PC release rate of SP was much higher than that of SZP, which also indicated that starch was easily hydrolyzed.69 In another study, PC were encapsulated in alginate/pectin aerogel microspheres, in which PC were also released in a burst before 60 min and then gradually plateaued to a plateau.70 Thus, PC-WSA has the potential to improve PC stability and bioavailability.
 |
| | Fig. 5 Release of PC from PC-WSA. | |
3.4 Stability study
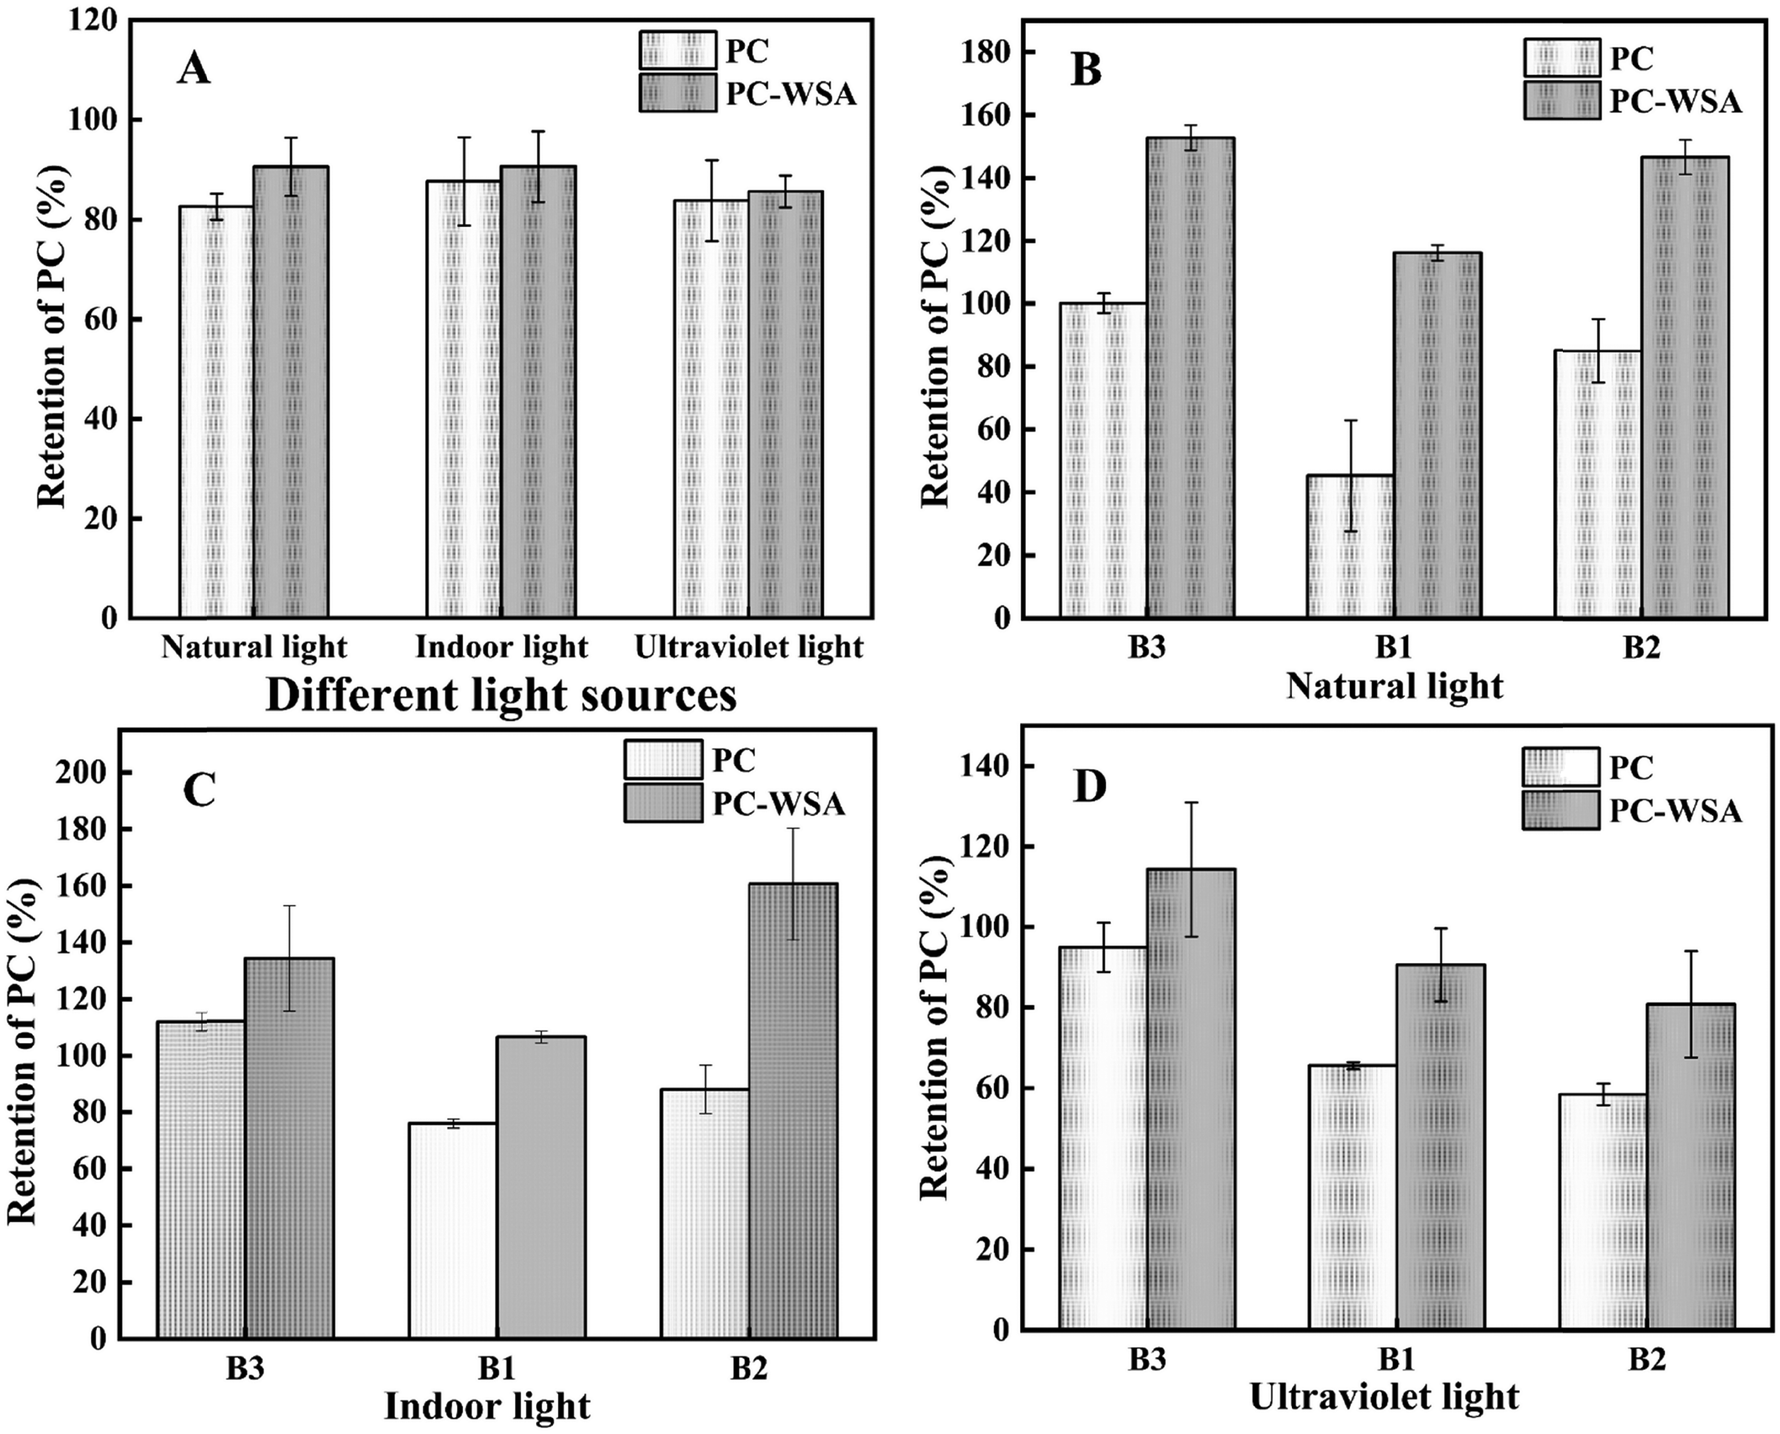
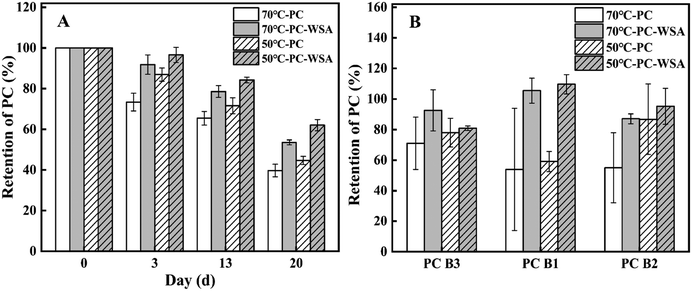
In view of the instability of procyanidins the thermal and photostability of PC and PC-WSA were studied. It can be seen from Fig. 6 that the PC retention of PC-WSA was always higher than that of PC after different temperature and time treatments. When stored at 50 °C and 70 °C on day 3, the PC retention of PC-WSA was 96.60% and 91.83%, respectively, and those of PC were 86.93% and 73.41%, respectively. When stored at a high temperature for 20 days, the retention amounts of procyanidins in PC were only 44.74% (50 °C) and 39.79% (70 °C), while the retention amounts of PC in PC-WSA were 62.09% (50 °C) and 53.63% (70 °C), respectively. In addition, PC B1, PC B2 and PC B3 in PC and PC-WSA were examined at day 20, and it was found that the retention rate of PC B1, PC B2 and PC B3 in PC-WSA was higher than that of PC at both temperatures, illustrating that PC-WSA has better thermal stability. This is because the encapsulation of WSA has a protective and thermal insulation effect on PC, indicating that WSA can effectively improve the thermal stability of PC. The results of the photostability study are presented in Fig. 7. Although the difference is not significant, it can be found that the retention of procyanidins in PC (natural light: 82.60%; indoor light: 87.68%; UV light: 83.81%) was lower than that in PC-WSA (natural light: 90.59%; indoor light: 90.63%; UV light: 85.85%) after 6 days of direct irradiation with different light sources. This indicates that WSA has a protective effect on PC and reduces the effect of light irradiation on PC, especially under natural light source. The samples were also tested in the liquid phase, and it was found that the retention rate of PC-WSA was higher than that of PC for PC B1, PC B2 and PC B3. In the photostability and thermal stability studies, PC B1, PC B2, and PC B3 were all measured. From the results, it was found that the retention rates of PC B1, PC B2 and PC B3 of PC-WSA exceeded 100%, which means that the contents of PC B1, PC B2 and PB B3 increased under light or heat environment. PC can be divided into polymers and oligomers, and under some conditions polymers will depolymerize into lower molecular weight oligomeric procyanidins.71,72 This may be due to the constant conversion of procyanidin polymers to oligomers under the influence of temperature or light, and the protective effect of WSA. Thus retention appears to exceed 100%. In the study of Dorota Wyspiańska et al. procyanidin microcapsules were prepared, which showed an increase in the content of procyanidin oligomers after storage at different temperatures for a period of time.32 That is similar to our results.
 |
| | Fig. 6 Procyanidins retention rates of PC and PC-WSA at 50 °C and 70 °C, (A) change of the procyanidin retention rate of PC and PC-WSA within 20 days, and (B) retention rates of PC B1, PC B2, and PC B3 in PC and PC-WSA on day 20. | |
 |
| | Fig. 7 (A) Retention of procyanidins in PC and PC-WSA exposed to different light sources and retention of PC B1, PC B2 and PC B3 under (B) natural light, (C) indoor light and (D) ultraviolet light irradiation. | |
In previous studies, PC were encapsulated using gelatin and chitosan, after which PC showed better stability.73 Chen et al. encapsulated procyanidins in super-deformed liposomes and improved the storage stability of procyanidins at different temperatures.74 This can all show that encapsulation is an effective way to improve the stability of PC. It also shows that it is the protective effect of WSA on PC and intermolecular interactions that improve the stability of PC.
3.5 Evaluation of antioxidant activity
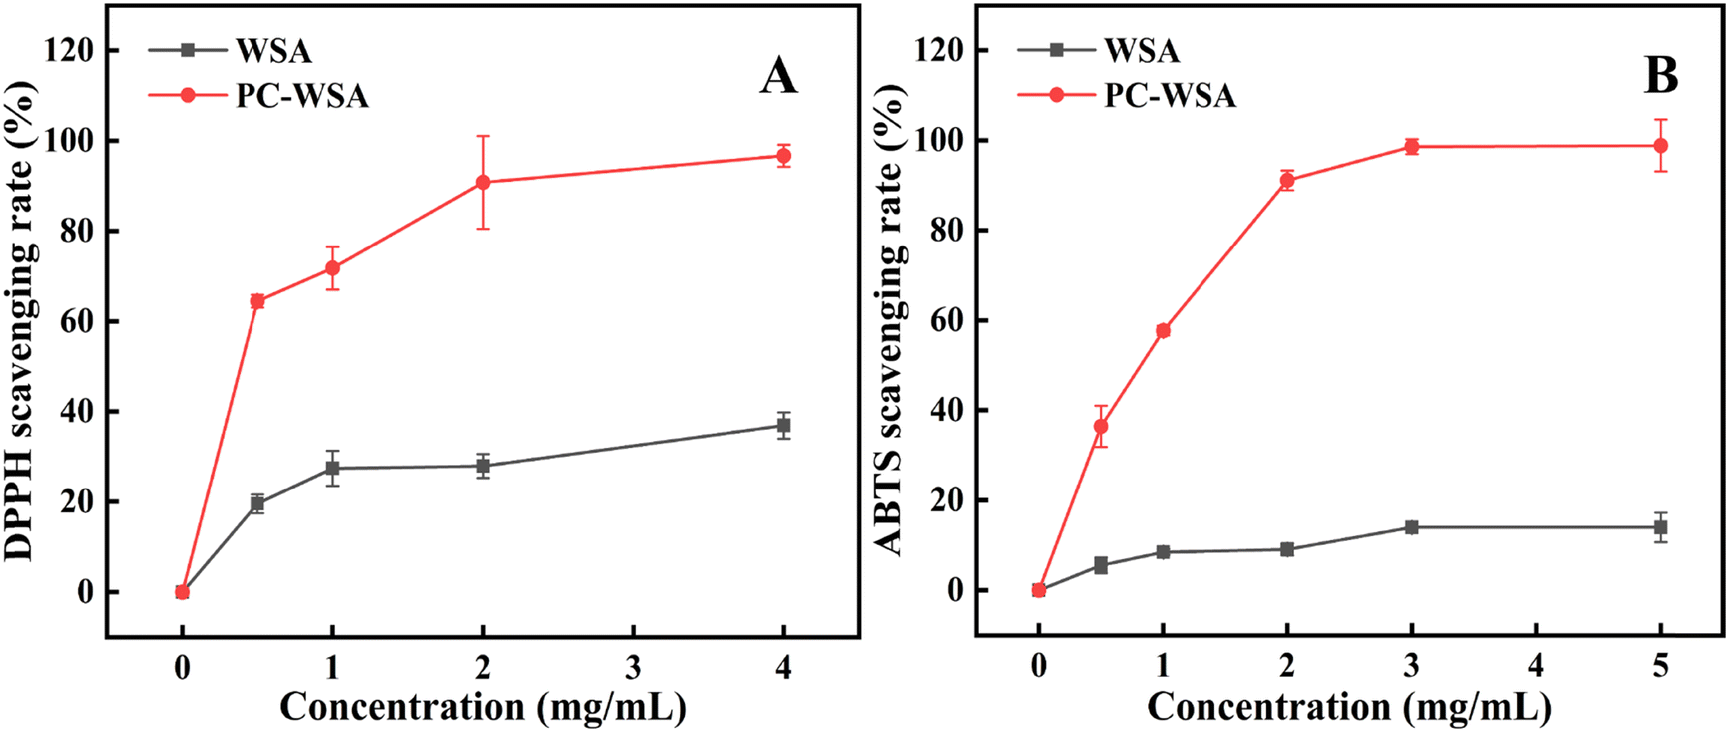
In order to explore the potential of PC-WSA for future applications, its antioxidant activity was evaluated. DPPH and ABTS radical scavenging assays are common techniques used to evaluate the antioxidant activity of a substance, so the scavenging rates of DPPH and ABTS radicals were evaluated for WSA and PC-WSA. The results are shown in Fig. 8, and it can be seen that the clearance rates of PC-WSA were all much higher than that of WSA, which is due to the fact that PC is a natural antioxidant with strong antioxidant activity, and the antioxidant activity of PC-WSA was significantly enhanced after the addition of PC. The scavenging rate of DPPH increased with the increase of concentration. When the concentration of PC-WSA reached 0.5 mg mL−1, the scavenging rate reached 64.47 ± 1.41%, and the EC50 was about 0.39 mg mL−1. However the scavenging rate of WSA was relatively low. The reason why WSA possesses a certain antioxidant activity may be due to the fact that SHMP exhibits some antioxidant properties against DPPH radicals.75 The scavenging of ABTS radicals by PC-WSA was also positively correlated with the concentration, reaching 98.87 ± 5.77% at 5 mg mL−1, while the scavenging of WSA was very low and close to 0. In particular, the EC50 of PC-WSA was approximately 0.82 mg mL−1. It can be found that the encapsulated PC aerogel has better antioxidant activity, which makes PC-WSA have better application prospects in food and other related fields. Moreover, VC was also used as a positive control with 100% scavenging of both DPPH and ABTS radicals, which are not shown in the figure.
 |
| | Fig. 8 DPPH radical scavenging activity (A), and ABTS radical scavenging activity (B) of WSA and PC-WSA. | |
4 Conclusions
WSA has a laminar mesoporous structure; the layered structure disappears and forms a mesh of varying sizes after encapsulating PC. The increase in short-range molecular sequence and crystallinity demonstrated that PC could be inserted into the double helix structure of starch as well as being able to inhibit the crystalline structure of starch. At the same time, it was shown that the PC was successfully encapsulated by the starch. During the first 60 min of the simulated digestion process, PC-WSA rapidly released PC B1, PC B2 and PC B3. After encapsulation of PC, PC-WSA showed better antioxidant activity with nearly 100% scavenging of DPPH radicals and ABTS radicals at 4 mg mL−1. PC-WSA retained 62.09 ± 2.77% (50 °C) and 53.63 ± 3.23% (70 °C) of PC after 20 days of high temperature treatment. The retention rates of PC after 6 days of light treatment with different light sources were 90.59 ± 5.84% (natural light), 90.63 ± 7.07% (indoor light) and 85.85 ± 3.19% (ultraviolet light), respectively. The retention rates of PC of PC-WSA were higher than those of unencapsulated PC, which indicated that WSA could improve the stability of PC. This study provides theoretical support for improving PC stability and the application of starch-based aerogels.
Author contributions
Tian-Xiao Yang: investigation, methodology, data curation, and writing-original draft. Hang Li: investigation, methodology, and writing-review & editing. Yuan Zhu: investigation and writing-review & editing. Yu Gao: investigation and writing – review & editing. Hong-Ning Lv: investigation and writing – review & editing. Sheng-Hua Zha: investigation and writing – review & editing. Xiao-Li Sun: conceptualization, writing-review & editing, and supervision. Qing-Sheng Zhao: funding acquisition, resources, and writing-review & editing.
Conflicts of interest
The authors declare that they have no known competing financial interests or personal relationships that could have appeared to influence the work reported in this paper.
Acknowledgements
This work was supported by the Key Research and Development Program of Ningxia (2023BCF01030).
References
- H. X. Yang, X. Tuo, L. B. Wang, R. Tundis, M. P. Portillo, J. Simal-Gandara, Y. Yu, L. Zou, J. B. Xiao and J. J. Deng, Trends Food Sci. Technol., 2021, 111, 114–127 CrossRef CAS.
- Q. Q. Qi, M. J. Chu, X. T. Yu, Y. N. Xie, Y. L. Li, Y. M. Du, X. M. Liu, Z. F. Zhang, O. Shi and N. Yan, Food Rev. Int., 2022, 39(7), 4581–4609 CrossRef.
- L. Liu, B. Xie, S. Cao, E. Yang, X. Xu and S. Guo, Food Chem., 2007, 105, 1446–1451 CrossRef CAS.
- J. Jiao, Y. Wei, J. Chen, X. Chen and Y. Zhang, J. Funct. Foods, 2017, 30, 63–73 CrossRef CAS.
- X. Luo, M. Chen, Y. Duan, W. Duan, H. Zhang, Y. He, C. Yin, G. Sun and X. Sun, Biomed. Pharmacother., 2016, 82, 640–648 CrossRef CAS.
- J. Iglesias, M. Pazos, J. L. Torres and I. Medina, Food Chem., 2012, 134, 1767–1774 CrossRef CAS.
- N. Martinez-Micaelo, N. Gonzalez-Abuin, A. Ardevol, M. Pinent and M. T. Blay, BioFactors, 2012, 38, 257–265 CrossRef CAS.
- A. Lobo, Y. Liu, Y. Q. Song, S. Liu, R. Zhang, H. Liang and H. Xin, Heliyon, 2020, 6(9), e04847 CrossRef CAS PubMed.
- X. Han, W. Zhao, Q. Zhou, H. Chen, J. Yuan, Z. Xiaofu and Z. S. Zhang, Food Funct., 2022, 13, 7901–7917 RSC.
- J. M. Silvan, A. Gutierrez-Docio, S. Moreno-Fernandez, T. Alarcon-Cavero, M. Prodanov and A. J. Martinez-Rodriguez, Foods, 2020, 9(10), 1370 CrossRef CAS.
- R. Mayer, G. Stecher, R. Wuerzner, R. C. Silva, T. Sultana, L. Trojer, I. Feuerstein, C. Krieg, G. Abel, M. Popp, O. Bobleter and G. K. Bonn, J. Agric. Food Chem., 2008, 56, 6959–6966 CrossRef CAS PubMed.
- A. Mas-Capdevila, L. Iglesias-Carres, A. Arola-Arnal, M. Suarez, F. I. Bravo and B. Muguerza, Food Funct., 2020, 11, 8735–8742 RSC.
- W. D. Fan, H. R. Zong, T. Zhao, J. J. Deng and H. X. Yang, Crit. Rev. Food Sci. Nutr., 2022 DOI:10.1080/10408398.2022.2132375.
- E. Sommella, N. Badolati, G. Riccio, E. Salviati, S. Bottone, M. Dentice, P. Campiglia, G. C. Tenore, M. Stornaiuolo and E. Novellino, Nutrients, 2019, 11, 163 CrossRef CAS PubMed.
- X. P. Li, Q. Wu, Y. Sui, S. Y. Li, B. J. Xie and Z. D. Sun, J. Funct. Foods, 2018, 44, 155–165 CrossRef CAS.
-
F. Wang, J. Wang, M. P. Ren and B. Hu, Effects of pine bark procyanidins extract on blood glucose, blood lipid and antioxidation in diabetic mice, Advances in Engineering, 5th International Conference on Machinery, Materials and Computing Technology (ICMMCT 2017), 2017, vol. 126.
- Y. Yao, S. Y. Feng, X. J. Li, T. H. Liu, S. Y. Ye, L. Ma and S. L. Man, Cell Death Dis., 2023, 14 DOI:10.1038/s41419-022-05482-5.
- F. T. Kong, C. X. He, F. L. Kong, S. F. Han, X. S. Kong, W. Q. Han and L. X. Yang, Nat. Prod. Commun., 2021, 16 DOI:10.1177/1934578X21991691.
- Y. Wu, C. Liu, Y. X. Niu, J. M. Xia, L. W. Fan, Y. Wu and W. Gao, Transl. Cancer Res., 2021, 10, 2023–2035 CrossRef CAS PubMed.
- M. W. Byun, J. Med. Food, 2012, 15, 1032–1037 CrossRef CAS.
- D. Liu, BMC Cardiovasc. Disord., 2018, 18, 35 CrossRef PubMed.
- B. W. Yin, X. Zhang, J. Y. Ren, F. G. Chen, J. F. Liang, H. N. Zhang, H. T. Pei, Z. H. Hu, Y. Wang, W. Xue, X. Y. Yu, R. Zhang and Y. X. Ma, Environ. Sci. Pollut. Res., 2023, 30, 10890–10900 CrossRef CAS PubMed.
- J. Wang, M. Varghese, K. Ono, M. Yamada, S. Levine, N. Tzavaras, B. Gong, W. J. Hurst, R. D. Blitzer and G. M. Pasinetti, J. Alzheimers Disease, 2014, 41, 643–650 CAS.
- X. H. Cheng, J. Y. Zhang, H. T. Jing, Y. Qi, T. X. Yan, B. Wu, Y. Y. Du, F. Xiao and Y. Jia, Curr. Pharm. Anal., 2021, 17, 119–128 CrossRef CAS.
- R. Xiong, X. L. Wang, J. M. Wu, Y. Tang, W. Q. Qiu, X. Shen, J. F. Teng, R. Pan, Y. Zhao, L. Yu, J. Liu, H. X. Chen, D. L. Qin, C. L. Yu and A. G. Wu, J. Ethnopharmacol., 2020, 251, 112548 CrossRef CAS.
- M. J. Cires, X. Wong, C. Carrasco-Pozo and M. Gotteland, Front. Nutrition, 2017, 3, 57 Search PubMed.
- W. C. Lu, W. T. Huang, A. Kumaran, C. T. Ho and L. S. Hwang, J. Agric. Food Chem., 2011, 59, 6214–6220 CrossRef CAS PubMed.
- R. C. Khanal, L. R. Howard and R. L. Prior, Food Res. Int., 2010, 43, 1464–1469 CrossRef CAS.
- Q. An, X. X. Gong, L. Q. Le, D. Z. Zhu, D. B. Xiang, F. Geng, H. Zhu, L. X. Peng, L. Zou, G. Zhao and Y. Wan, Food Rev. Int., 2023, 39, 349–368 CrossRef CAS.
- F. Guo, M. Lin, Y. Gu, X. Zhao and G. S. Hu, Eur. Food Res. Technol., 2015, 240, 1013–1021 CrossRef CAS.
- S. Toro-Uribe, L. J. Lopez-Giraldo, G. Alvarez-Rivera, E. Ibanez and M. Herrero, J. Agric. Food Chem., 2019, 67, 1990–2003 CrossRef CAS PubMed.
- D. Wyspianska, A. Z. Kucharska, A. Sokol-Letowska and J. Kolniak-Ostek, J. Sci. Food Agric., 2017, 97, 669–678 CrossRef CAS.
- R. Berendsen, C. Guell and M. Ferrando, Food Chem., 2015, 178, 251–258 CrossRef CAS PubMed.
- Y. C. Zou, C. L. Wu, C. F. Ma, S. He, C. S. Brennan and Y. Yuan, LWT-Food Sci. Technol., 2019, 115, 108465 CrossRef CAS.
- C. Y. Tang, B. Tan and X. J. Sun, Molecules, 2021, 26, 5468 CrossRef CAS PubMed.
- K. X. Hou and Z. Y. Wang, Food Rev. Int., 2022, 38, 738–752 CrossRef CAS.
- A. Ubeyitogullari, S. Ahmadzadeh, G. Kandhola and J. W. Kim, Compr. Rev. Food Sci. Food Saf., 2022, 21, 4610–4639 CrossRef CAS.
-
I. Smirnova and P. Gurikov, in Annual Review of Chemical and Biomolecular Engineering, ed. J. M. Prausnitz, 2017, vol. 8, pp. 307–334 Search PubMed.
- F. Zhu, Food Chem., 2017, 229, 542–552 CrossRef CAS.
- A. Ubeyitogullari, S. Brahma, D. J. Rose and O. N. Ciftci, J. Agric. Food Chem., 2018, 66, 9490–9497 CrossRef CAS PubMed.
- A. V. Singh and L. K. Nath, Int. J. Biol. Macromol., 2012, 50, 14–18 CrossRef CAS PubMed.
- Y. W. Wang, M. H. He, Y. W. Wu, Y. G. Liu and J. Ouyang, Starch-Starke, 2021, 73, 2000161 CrossRef CAS.
- F. Zhu, Trends Food Sci. Technol., 2019, 89, 1–10 CrossRef CAS.
- S. Y. Zhao, W. J. Malfait, N. Guerrero-Alburquerque, M. M. Koebel and G. Nystrom, Angew. Chem., Int. Ed., 2018, 57, 7580–7608 CrossRef CAS.
- D. D. Lovskaya, A. E. Lebedev and N. V. Menshutina, J. Supercrit. Fluids, 2015, 106, 115–121 CrossRef CAS.
- A. Mohammadi and J. Moghaddas, Turk. J. Chem., 2020, 44, 614–633 CrossRef CAS PubMed.
- A. Ubeyitogullari and O. N. Ciftci, Food Res. Int., 2019, 123, 27–35 CrossRef CAS.
- L. M. Fonseca, F. T. Silva, N. P. Bona, F. M. Stefanello, C. D. Borges, A. R. G. Dias and E. D. Zavareze, Starch-Starke, 2020, 72, 1900280 CrossRef CAS.
- P. Y. Zhang, Y. W. Wang, Y. G. Liu, Y. W. Wu and J. Ouyang, Food Chem., 2023, 406 DOI:10.1016/j.foodchem.2022.135040.
- B. S. Sun, J. M. Ricardo-da-Silva and I. Spranger, J. Agric. Food Chem., 1998, 46, 4267–4274 CrossRef CAS.
- D. Momekova, Y. Danov, G. Momekov, E. Ivanov and P. Petrov, Pharmaceutics, 2021, 13, 1774 CrossRef CAS.
- S. L. Chang, Q. S. Zhao, H. Li, X. D. Wang, L. W. Wang and B. Zhao, Food Hydrocolloids, 2022, 124, 107314 CrossRef CAS.
- S. Srichuwong and J. L. Jane, Food Sci. Biotechnol., 2007, 16, 663–674 CAS.
- V. Baudron, P. Gurikov, I. Smirnova and S. Whitehouse, Gels, 2019, 5, 12 CrossRef CAS PubMed.
- J. Y. Kim and K. C. Huber, Carbohydr. Polym., 2016, 136, 394–401 CrossRef CAS.
- A. Munoz-Labrador, M. Prodanov and M. Villamiel, Ultrason. Sonochem., 2019, 50, 74–81 CrossRef CAS PubMed.
- F. J. Warren, M. J. Gidley and B. M. Flanagan, Carbohydr. Polym., 2016, 139, 35–42 CrossRef CAS PubMed.
- Y. L. Zhu, M. Yuen, W. X. Li, H. Yuen, M. Wang, D. Smith and Q. Peng, Curr. Res. Food Sci., 2021, 4, 840–851 CrossRef CAS.
- C. S. Ku and S. P. Mun, Wood Sci. Technol., 2007, 41, 235–247 CrossRef CAS.
- O. Sevenou, S. E. Hill, I. A. Farhat and J. R. Mitchell, Int. J. Biol. Macromol., 2002, 31, 79–85 CrossRef CAS.
- A. Ubeyitogullari and O. N. Ciftci, Carbohydr. Polym., 2016, 147, 125–132 CrossRef CAS PubMed.
- D. L. Zhang, L. J. Jiang, J. H. Zong, S. F. Chen, C. Y. Ma and H. J. Li, RSC Adv., 2017, 7, 56771–56778 RSC.
- Q. Luo, X. Huang, F. Gao, D. Li and M. Wu, Materials, 2019, 12, 1420 CrossRef CAS.
- N. Rodriguez, Y. Y. Agamez-Pertuz, E. Romero, J. D. Diaz-Velasquez, J. A. Odriozola and M. A. Centeno, J. Non-Cryst. Solids, 2019, 522, 119554 CrossRef CAS.
- M. J. Chen, X. Q. Zhang, A. P. Zhang, C. F. Liu and R. C. Sun, Cellulose, 2016, 23, 1325–1334 CrossRef CAS.
- K. S. W. Sing, D. H. Everett, R. A. W. Haul, L. Moscou, R. A. Pierotti, J. Rouquerol and T. Siemieniewska, Pure Appl. Chem., 1985, 57, 603–619 CrossRef CAS.
- M. Anas, A. G. Gonel, S. E. Bozbag and C. Erkey, J. CO2 Util., 2017, 21, 82–88 CrossRef CAS.
- K. Q. Ou and L. W. Gu, J. Funct. Foods, 2014, 7, 43–53 CrossRef CAS.
- J. L. Song, L. J. Jiang, M. M. Qi, X. Y. Li, R. H. Li, C. Y. Ma, S. F. Chen, H. J. Li and D. L. Zhang, J. Food Meas. Charact., 2022, 16, 3618–3629 CrossRef.
- K. L. Chen and H. Zhang, Int. J. Biol. Macromol., 2019, 136, 936–943 CrossRef CAS.
- J. Zhang, D. Liu, A. K. Wang, L. Cheng, W. Y. Wang, Y. H. Liu, S. Ullah and Q. P. Yuan, Bioresour. Bioprocess., 2021, 8, 23 CrossRef.
- H. W. Liu, T. Zou, J. M. Gao and L. W. Gu, Food Chem., 2013, 141, 488–494 CrossRef CAS PubMed.
- T. Zou, S. S. Percival, Q. Cheng, Z. Li, C. A. Rowe and L. W. Gu, Eur. J. Pharm. Biopharm., 2012, 82, 36–42 CrossRef CAS PubMed.
- R. C. Chen, R. L. Li, Q. Liu, C. Bai, B. L. Qin, Y. Ma and J. Han, AAPS PharmSciTech, 2017, 18, 1823–1832 CrossRef CAS PubMed.
- M. Fallah, M. Rouhi, M. Soltani, M. A. Mohammadifar, R. Bahrami, S. M. Davachi, A. Abbaspourrad and R. Mohammadi, J. Polym. Environ., 2021, 29, 2174–2184 CrossRef CAS.
|
| This journal is © The Royal Society of Chemistry and the Centre National de la Recherche Scientifique 2024 |
Click here to see how this site uses Cookies. View our privacy policy here. 
 bc,
Yuan
Zhu
bc,
Yu
Gao
d,
Hong-Ning
Lv
b,
Sheng-Hua
Zha
e,
Xiao-Li
Sun
*a and
Qing-Sheng
Zhao
bc,
Yuan
Zhu
bc,
Yu
Gao
d,
Hong-Ning
Lv
b,
Sheng-Hua
Zha
e,
Xiao-Li
Sun
*a and
Qing-Sheng
Zhao