DOI:
10.1039/D3NA01167D
(Paper)
Nanoscale Adv., 2024,
6, 1661-1677
Enhanced sunlight-driven catalysis for hydrogen generation and dye remediation using synergistic p-Co3O4/n-TiO2 nanocomposites
Received
31st December 2023
, Accepted 5th February 2024
First published on 26th February 2024
Abstract
In this study, p-Co3O4/n-TiO2 nanocomposites were synthesized using different ratios of cobalt and titanium precursors through a hydrothermal method. These nanocomposites demonstrated notable potential in photocatalytic applications for hydrogen production and orange-red dye degradation under sunlight. Various techniques, including XRD, Raman spectroscopy, XPS, FESEM, TEM, and BET analysis, were used to comprehensively characterize their structural, morphological, and optical properties. The nanocomposites exhibited both cubic and tetragonal phases of Co3O4 and TiO2, and their combined effect resulted in a narrowed band gap. Additionally, the presence of Co3O4 induced surface plasmon resonance on the TiO2 surface, effectively impeding electron–hole recombination. The nanocomposites displayed an average particle size of ∼20 to 30 nm with substantial visible light absorption. High crystallinity and well-dispersed nanocomposites were confirmed by XRD and Raman, with BET surface areas ranging between 49 and 106 m2 g−1. Notably, the p-Co3O4/n-TiO2 nanocomposite showed superior photocatalytic activity, achieving a maximum hydrogen generation rate of 1120 μmol h−1 g−1 and an 83% degradation efficiency of the orange-red dye within 6 minutes under sunlight. This study emphasizes the enhanced performance of the p-Co3O4/n-TiO2 nanocomposite, indicating its potential in photocatalytic applications, conforming to a pseudo-first-order kinetics model.
1. Introduction
The escalating global energy demand driven by population growth and rapid industrialization has precipitated severe environmental issues. Efforts to secure sustainable energy alternatives, particularly from renewable sources, are paramount to mitigate reliance on finite fossil fuels.1–10 Solar energy, as a free and abundant resource, holds promise for hydrogen production through water splitting and remediation of environmental contaminants in wastewater treatment. Semiconductor nanomaterials, especially titanium dioxide (TiO2) with a substantial band gap of 3.2 eV, have emerged as promising photocatalysts due to their low cost, efficient photochemical stability, and non-toxic nature. However, the wide band gap of TiO2 limits its efficiency under solar illumination, primarily utilizing a mere 4–5% of the solar spectrum consisting of UV light. To enhance its utilization of solar energy, various strategies have been explored, such as structural and electronic modifications involving doping, coupling with other semiconductors, and introducing metal or non-metal ions and metal oxides.11–15 These modifications aim to extend the light absorption efficiency of TiO2 to the visible spectrum. Consequently, the development of visible light-driven catalysts is a current research focus to improve water treatment efficiency. The formation of TiO2 nanocomposites with other semiconductors has shown potential to enhance visible light absorption and catalytic efficiency. Recent research efforts have aimed at designing photocatalysts with intriguing properties such as high surface area, uniform pore size distribution, and large pore volumes that significantly influence the behavior of photogenerated electrons and holes. Until now, a large number of semiconductor materials have been introduced as fruitful photocatalysts for elimination and mineralization of organic dyes including CdO, SnO2, ZnO, CeO2, CuO, TiO2, Co3O4 and so many.16–21
Semiconductor materials like Co3O4 and TiO2 nanoparticles have garnered attention for their favorable photocatalytic performance and sunlight harvesting capability. The narrow band gap of Co3O4 (∼2.19 eV) and the broad band gap of TiO2 make them potential candidates for photocatalysis.22–26 Their nanocomposite formation is anticipated to enhance photocatalytic activities, making them effective in degrading organic dyes like orange-red (OR) dye. This study aims to explore the efficiency of p-Co3O4/n-TiO2 nanocomposites as catalysts for OR dye degradation and hydrogen generation, and their potential in environmental remediation. The utilization of these nanocomposites offers promising prospects for developing efficient photocatalysts for environmental cleanup.27–30
This study focuses on the synthesis, characterization and investigation of the potential of p-Co3O4/n-TiO2 nanocomposites as efficient catalysts for solar-driven hydrogen generation and the degradation of organic dyes, particularly orange-red dye. The nanocomposites were synthesized using a hydrothermal method with varying cobalt-titanium ratios (1![[thin space (1/6-em)]](https://www.rsc.org/images/entities/char_2009.gif) :
:![[thin space (1/6-em)]](https://www.rsc.org/images/entities/char_2009.gif) 1, 1
1, 1![[thin space (1/6-em)]](https://www.rsc.org/images/entities/char_2009.gif) :
:![[thin space (1/6-em)]](https://www.rsc.org/images/entities/char_2009.gif) 2, and 2
2, and 2![[thin space (1/6-em)]](https://www.rsc.org/images/entities/char_2009.gif) :
:![[thin space (1/6-em)]](https://www.rsc.org/images/entities/char_2009.gif) 1) to examine their catalytic performance for different compositions. The research aims to ascertain the influence of varying ratios on the nanocomposites efficacy in photocatalysis. By systematically exploring the synthesis and characterization of p-Co3O4/n-TiO2 nanocomposites, this study contributes to the development of advanced photocatalytic materials capable of harnessing solar energy more effectively. The ultimate goal is to pave the way for the creation of innovative nanocomposite photocatalysts that can efficiently address environmental challenges while promoting sustainable energy production.
1) to examine their catalytic performance for different compositions. The research aims to ascertain the influence of varying ratios on the nanocomposites efficacy in photocatalysis. By systematically exploring the synthesis and characterization of p-Co3O4/n-TiO2 nanocomposites, this study contributes to the development of advanced photocatalytic materials capable of harnessing solar energy more effectively. The ultimate goal is to pave the way for the creation of innovative nanocomposite photocatalysts that can efficiently address environmental challenges while promoting sustainable energy production.
2. Materials and methods
2.1 Chemicals
The analytical grade reagents, CoCl2·6H2O, (TiC4H9O)4, anhydrous urea (≥98%), ethanol (99.9% purity) and orange red (≥97% purity) dye were procured from Sigma Aldrich. No additional purification steps were employed, and all chemicals were used as received. For the degradation experiments, all stock solutions were prepared using deionized (DI) water. Additionally, DI water served as the solvent for synthesizing the p-Co3O4/n-TiO2 nanocomposite.
2.2 Synthesis of p-Co3O4/n-TiO2 nanocomposites
The synthesis of cobalt titanium oxide (p-Co3O4/n-TiO2) nanostructures involved a hydrothermal method using cobalt(II) chloride hexahydrate (CoCl2·6H2O), titanium butoxide ((TiC4H9O)4), and urea (0.1 M). This solution mixture was stirred continuously for 30 min. Then the solution was transferred into a Teflon-coated stainless-steel autoclave and placed in an oven at 180 °C for 24 hours. Varying molar weight ratios of CoCl2·6H2O and (TiC4H9O)4 produced three distinct products, denoted as CT-11, CT-12, and CT-21, corresponding to ratios of 1![[thin space (1/6-em)]](https://www.rsc.org/images/entities/char_2009.gif) :
:![[thin space (1/6-em)]](https://www.rsc.org/images/entities/char_2009.gif) 1, 1
1, 1![[thin space (1/6-em)]](https://www.rsc.org/images/entities/char_2009.gif) :
:![[thin space (1/6-em)]](https://www.rsc.org/images/entities/char_2009.gif) 2, and 2
2, and 2![[thin space (1/6-em)]](https://www.rsc.org/images/entities/char_2009.gif) :
:![[thin space (1/6-em)]](https://www.rsc.org/images/entities/char_2009.gif) 1, respectively. Purification involved multiple washings with distilled water and ethanol in a centrifuge machine. The purified samples were dried at 80 °C and further subjected to calcination at 500 °C for 3 hours in the presence of air. This process yielded the materials p-Co3O4/n-TiO2 (1
1, respectively. Purification involved multiple washings with distilled water and ethanol in a centrifuge machine. The purified samples were dried at 80 °C and further subjected to calcination at 500 °C for 3 hours in the presence of air. This process yielded the materials p-Co3O4/n-TiO2 (1![[thin space (1/6-em)]](https://www.rsc.org/images/entities/char_2009.gif) :
:![[thin space (1/6-em)]](https://www.rsc.org/images/entities/char_2009.gif) 1), p-Co3O4/n-TiO2 (1
1), p-Co3O4/n-TiO2 (1![[thin space (1/6-em)]](https://www.rsc.org/images/entities/char_2009.gif) :
:![[thin space (1/6-em)]](https://www.rsc.org/images/entities/char_2009.gif) 2), and p-Co3O4/n-TiO2 (2
2), and p-Co3O4/n-TiO2 (2![[thin space (1/6-em)]](https://www.rsc.org/images/entities/char_2009.gif) :
:![[thin space (1/6-em)]](https://www.rsc.org/images/entities/char_2009.gif) 1) labelled as CT-11, CT-12, and CT-21. The synthesized materials were subjected to comprehensive characterization utilizing various analytical techniques to elucidate their structural, morphological, and compositional properties. Subsequently, these materials are assessed for their photocatalytic performance, specifically in the realms of dye degradation and hydrogen production, elucidating their potential in environmental remediation and renewable energy applications.
1) labelled as CT-11, CT-12, and CT-21. The synthesized materials were subjected to comprehensive characterization utilizing various analytical techniques to elucidate their structural, morphological, and compositional properties. Subsequently, these materials are assessed for their photocatalytic performance, specifically in the realms of dye degradation and hydrogen production, elucidating their potential in environmental remediation and renewable energy applications.
2.3 Characterization
X-ray powder diffraction (XRD) was carried out with a Bruker D8-Advance using Cu-Kα radiation (λ = 1.54 Å) with a 2θ range of 10° to 80° at 40 kV and 40 mA to elucidate the structural information, while UV-DRS spectroscopy was performed with a JASCO V-770 UV-vis spectrophotometer to determine band gaps. Fourier-transform infrared spectroscopy (FTIR) was performed using a JASCO FTIR-6100 to analyze the molecular composition. Morphologies were examined via field emission scanning electron microscopy (FESEM) at 10 kV and energy dispersive X-ray (EDX) analysis was performed using a NOVA FESEM, NPE303 to identify the elemental composition. X-ray photoelectron spectroscopy (XPS) was performed with a PHI5000Versa Probe III instrument using monochromatized Mg Kα radiation to investigate surface elements. High-resolution transmission electron microscopy (HR-TEM) was performed at 300 kV to obtain fine structural details (Philips G-Technai instrument) and BET surface area analysis was performed using an Autosorb iQ (Quantachrome Inc., USA) to determine the surface area of materials. These techniques collectively offered insights into the structural, morphological, compositional, and surface properties of the materials.
2.4 Photocatalytic degradation of OR dye
Under natural sunlight conditions, the photocatalytic degradation of an organic dye (OR dye) was systematically conducted using three distinct catalysts: CT-11, CT-12, and CT-21 nanocomposites. The experimental protocol involved introducing CT nanocomposites into the OR dye solution (25 ppm). Each reaction consisted of dispersing 25 mg of the CT nanocomposite in 100 mL of the OR dye solution, with solar radiation exposure at an approximate intensity of 650 Watt per m2 while carefully maintaining the temperature at 30 ± 2 °C. Intermittently, 2 mL aliquots of the reaction mixture were withdrawn during sunlight exposure and subjected to centrifugation at 13![[thin space (1/6-em)]](https://www.rsc.org/images/entities/char_2009.gif) 000 rpm for 20 minutes facilitating the separation of the dye from the photocatalyst. Absorbance spectra of the resulting supernatant samples were recorded using a UV-vis system for detailed analysis. Comparative assessment revealed differing efficiencies in photodegradation among the three CT nanocomposites, with the observed trend of performance ranking as CT-12 > CT-11 > CT-21. Notably, the CT-12 nanocomposite exhibited superior photocatalytic efficacy in degrading the OR dye under natural sunlight conditions.
000 rpm for 20 minutes facilitating the separation of the dye from the photocatalyst. Absorbance spectra of the resulting supernatant samples were recorded using a UV-vis system for detailed analysis. Comparative assessment revealed differing efficiencies in photodegradation among the three CT nanocomposites, with the observed trend of performance ranking as CT-12 > CT-11 > CT-21. Notably, the CT-12 nanocomposite exhibited superior photocatalytic efficacy in degrading the OR dye under natural sunlight conditions.
2.5 Photocatalytic hydrogen generation by water splitting
In the evaluation of hydrogen (H2) generation through water (H2O) splitting, three distinct photocatalysts, labelled as CT-11, CT-12, and CT-21 in their original synthesized forms, were employed. The assessment was conducted in a sealed reactor setup using solar illumination. The reactor comprised a 100 mL cylindrical quartz vessel with a septum design allowing gas retrieval using a gas-tight syringe for precise gas quantification. A typical experiment involved a 30 mL solution composed of 25 mL deionized water with 0.5 wt% preloaded platinum as a co-catalyst and 5 mL methanol as a sacrificial reagent, with 20 mg of CT catalyst powder suspended in it. Prior to irradiation, dissolved gases were removed by purging nitrogen gas through the mixture. Continuous magnetic stirring maintained particle suspension during the experiment. Periodically, 0.5 mL gas samples were collected via the septum for hydrogen quantification using a Shimadzu Model GC 2014 gas chromatograph equipped with a molecular sieve column, referencing a standard curve for accurate determination. To assess the sustained performance, the most active catalyst underwent three consecutive photocatalytic cycles under identical conditions, offering insights into its long-term stability and durability.
3. Results and discussion
3.1 X-ray diffraction analysis
Fig. 1 illustrates the X-ray diffraction (XRD) patterns of CT-11, CT-12, and CT-21 photocatalyst nanocomposites, affirming their composite nature involving Co3O4 and TiO2. Structural analyses via XRD unveiled specific 2θ peaks at 31.30°, 36.84°, 44.82°, 59.30°, and 65.10°, corresponding to (hkl) crystallographic planes (220), (311), (400), (511), and (440), respectively. These peaks signify the presence of the cubic phase of Co3O4 (indexed to JCPDS no 43-1003). Moreover, additional 2θ peaks at 25.2, 37.82, 47.90, 54.54, and 62.80 degrees, distinct from the cubic Co3O4 phase, were observed, aligning with (hkl) planes (101), (004), (200), (105), and (204), confirming the existence of the tetragonal phase of TiO2 (associated with space group I41/amd and JCPDS no 21-1272), indicating the growth of TiO2 in the anatase phase. Broadened XRD peaks suggest nanoscale crystallite dimensions, indicating a pure phase without unwanted peaks. Utilizing the Scherrer equation and XRD data, the calculated crystallite size ranged between 20 and 30 nanometres, as outlined in Table 1. The tabulated data reflect a reduction in the crystallite size concurrent with increased cobalt and titanium content, highlighting an inverse correlation between the crystallite size and the concentrations of these elements.
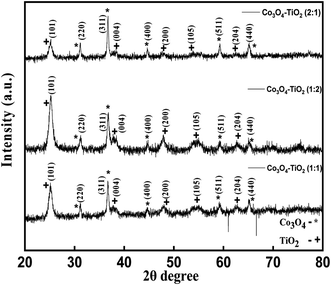 |
| | Fig. 1 XRD patterns of CT-11, CT-12 and CT-21. | |
Table 1 Crystallite size and band gap energy of CT-11, CT-12 and CT-21
| S. no. |
CT samples |
Average crystallite size; D (nm) |
Band gap (eV) |
Surface area (m2 g−1) |
| 1. |
1![[thin space (1/6-em)]](https://www.rsc.org/images/entities/char_2009.gif) : :![[thin space (1/6-em)]](https://www.rsc.org/images/entities/char_2009.gif) 2 2 |
20 ± 0.027 |
2.13 |
106 |
| 2. |
1![[thin space (1/6-em)]](https://www.rsc.org/images/entities/char_2009.gif) : :![[thin space (1/6-em)]](https://www.rsc.org/images/entities/char_2009.gif) 1 1 |
24 ± 0.027 |
2.30 |
74 |
| 3. |
2![[thin space (1/6-em)]](https://www.rsc.org/images/entities/char_2009.gif) : :![[thin space (1/6-em)]](https://www.rsc.org/images/entities/char_2009.gif) 1 1 |
33 ± 0.027 |
2.56 |
49 |
3.2 FTIR analysis
Fig. 2 depicts the Fourier-transform infrared (FTIR) spectra of CT-11, CT-12, and CT-21 nanocomposites. The foremost peak observed at 3409 cm−1 corresponds to the stretching vibration of the hydroxyl group (O–H) linked to TiO2 nanoparticles. Following this, the band at 1632 cm−1 signifies the bending modes of water molecules (O–H) adsorbed onto the surface, notably emphasizing the presence of hydroxyl groups on the anatase surface, particularly in lower temperature preparations, highlighting their significance in the photocatalytic degradation process.31 Additionally, the prominent peak at 1383 cm−1 is related to Ti–O modes, reflecting titanium–oxygen bonding.32–34 The existence of Co–O bonds in Co3O4 is evident through stretching and bending mode vibrations at 417 cm−1, along with weak absorptions at 660 cm−1 indicating the formation of Co3O4.35,36 These distinct absorption peaks in the FTIR spectra of the CT nanocomposites validate the presence of the specific nanoparticles, affirming the successful synthesis of the composite materials.
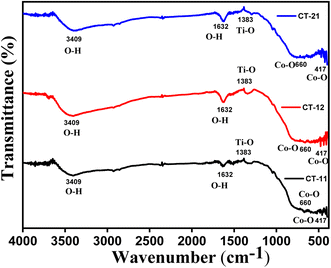 |
| | Fig. 2 FTIR spectra of CT-11, CT-12 and CT-21. | |
3.3 UV-DRS analysis
The optical characteristics of CT nanocomposites were studied using diffuse reflectance UV-visible absorption spectroscopy spanning 200–800 nm. The absorption spectra depicted in Fig. 3 exhibited strong light absorption characteristics for all three materials. The analysis of these spectra revealed that the CT nanocomposites effectively absorb both visible and UV light, leading to a redshift in the absorption edge, which is indicative of longer wavelengths being absorbed. This redshift enhances the photocatalytic efficiency of the materials.37 To determine the optical band gaps, the Tauc plots [(αhν)2vs. (hν)] were employed, using the Kubelka–Munk (KM) method, as represented in eqn (1):
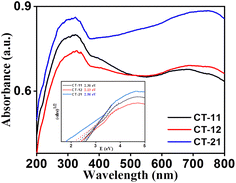 |
| | Fig. 3 UV-visible spectra of CT-11, CT-12 and CT-21; Tauc plot of CT-11, CT-12 and CT-21 (inset). | |
In this equation, α represents the absorption coefficient, hν is the photon energy, A is a proportionality constant, Eg is the material's optical band gap, and n characterizes the type of electronic transition (direct or indirect). The resultant optical band gap values for CT-11, CT-12, and CT-21 were determined to be 2.30 eV, 2.13 eV, and 2.56 eV, respectively, as summarized in Table 1. Notably, these values reflect a substantial reduction in the band gap in comparison to the pure constituent materials like Co3O4 and TiO2. This reduction arises from additional sub-bandgap energy levels induced by abundant surface and interface defects within the CT nanocomposite nanoparticle structure.38 This reduced band gap is of significance as it enables the activation of the photocatalytic degradation process under visible and even sunlight irradiation, offering a more cost-effective and safer alternative to UV irradiation across diverse applications.
3.4 Raman analysis
The Raman spectra of CT nanocomposites are shown in Fig. 5 to further support crystalline nature in addition to the vibrational modes of the atomic arrangement. Both Co3O4 and TiO2 components displayed distinct vibrational modes in their respective Raman spectra due to the coexistence of mixed phases. In the Raman spectrum displayed in Fig. 4, five active Raman modes characteristic of cobalt oxides were observed at 188, 476, 518, 607, and 685 cm−1, consistent with previously reported data.39 Furthermore, the Raman spectra revealed distinct bands at 144 cm−1 (Eg) and 393 cm−1 (B1g), corresponding to the O–Ti–O bending mode, as well as a band at 517 cm−1 (A1g + B1g) for the Ti–O stretching mode, and a band at 639 cm−1 (Eg) for another Ti–O stretching mode, all of which are indicative of the typical features of TiO2 anatase.40,41
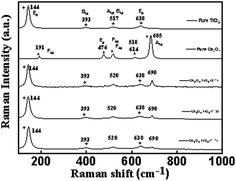 |
| | Fig. 4 Raman spectra of CT-11, CT-12 and CT-21. | |
3.5 BET surface area analysis
The surface areas and BET surface area graph of all three CT nanocomposites are detailed in Table 1 and Fig. 5 respectively. The CT-12 nanocomposites exhibited a significantly larger surface area in comparison to the other variants. This characteristic of CT-12 provides an abundance of active sites, which play a crucial role in facilitating the interaction between the photocatalyst and dye molecules, thereby promoting their degradation.22 The substantial surface area observed in calcined materials is often attributed to the evolution of gases such as CO2 and H2O during the calcination process.42,43 This increased specific surface area of the catalyst has been previously reported and can significantly enhance the mass transfer of gas molecules, thereby expediting catalytic reaction processes.44 As described in Table 1, it is evident that the specific surface area exhibits a positive correlation with the Ti content, wherein an increment in Ti content is associated with an increase in specific surface area. Conversely, an inverse relationship is observed in relation to the Co content, where higher Co content corresponds to a decrease in specific surface area. These trends highlight the interplay between the compositional constituents and the resulting surface characteristics of the CT nanocomposites.
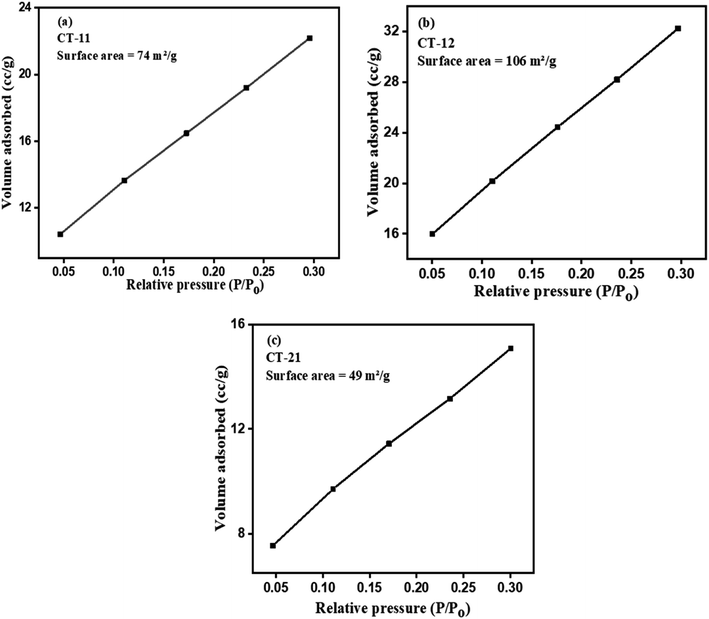 |
| | Fig. 5 BET surface area plots of (a) CT-11, (b) CT-12, and (c) CT-21. | |
3.6 XPS analysis
X-ray photoelectron spectroscopy (XPS) analysis was conducted to elucidate the chemical composition of the CT-12 nanocomposite. Fig. 6(a) displays the survey scan of CT-12, along with specific scans for Co 2p, Ti 2p, and O 1s regions. In Fig. 6(b), the Co 2p spectrum reveals two discernible peaks at binding energies of 779.6 eV and 795.18 eV, corresponding to Co 2p3/2 and Co 2p1/2, respectively. These peaks exhibit a characteristic orbital splitting energy of 15.58 eV, indicative of the coexistence of Co2+ and Co3+ states, a finding consistent with prior reports.45,46 Additionally, two satellite peaks at 786.01 eV and 802.16 eV are associated with Co2+.47Fig. 6(c) displays the high-resolution XPS spectrum of the Ti 2p region. The Ti 2p peak exhibits two well-defined peaks at 457.8 eV and 463.5 eV, corresponding to the core levels of Ti 2p3/2 and Ti 2p1/2, respectively.48,49 This observation aligns with existing literature and signifies that the titanium species exist predominantly in the tetravalent state, Ti4+, consistent with pure TiO2.50 The energy difference of 5.7 eV between Ti 2p3/2 and Ti 2p1/2 conforms precisely to the accepted binding energy difference.51 The presence of the O 1s peak at 529.30 eV, attributed to lattice oxygen, holds significant implications for the structural and chemical characteristics of the CT-12 nanocomposite (Fig. 6d).
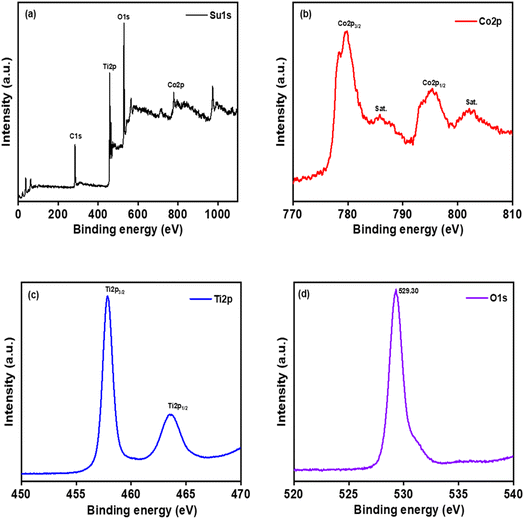 |
| | Fig. 6 X-ray photoelectron (XPS) spectra of (a) survey spectrum, (b) Co 2p, (c) Ti 2p and (d) O 1s. | |
3.7 FESEM analysis
Fig. 7 presents field emission scanning electron microscopy (FESEM) images of the CT nanocomposites. These images reveal a predominant feature of uniform particle size distribution and a nearly spherical morphology. The typical agglomerated particle size falls within the range of 10 to 25 nanometres. The observed spherical shape of the particles carries notable significance in the context of photocatalysis, as it contributes to the fine-tuning of the electronic structure of the nanocomposites. This adjustment in the electronic structure holds the potential to enhance the photocatalytic activity, particularly in the visible light spectrum.52 The EDS analysis of the CT-12 sample shows that the weight percentage of Co, Ti and O is 18.60%, 26.70% and 54.71% respectively.
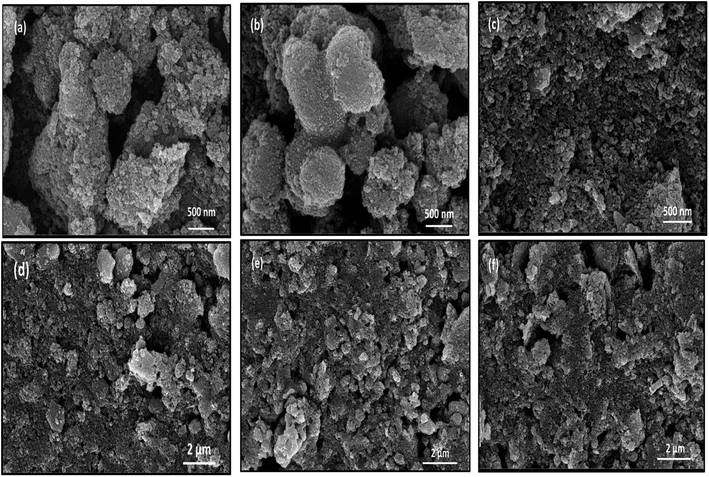 |
| | Fig. 7 FESEM micrograph of (a and d) CT-11, (b and e) CT-12 and (c and f) CT-21 NPs. | |
3.8 TEM analysis
Fig. 8 illustrates the TEM image of the CT-21 nanocomposite with its SAED pattern. Polycrystalline nature of the CT nanocomposite has been clearly seen in the magnified TEM images. They appeared as approximately spherical shaped particles with uniform size distribution. The average particle size is obtained to be approximately in the range of 10–20 nm as confirmed from Fig. 8b and c due to high magnification TEM which is in good agreement with FESEM as well as with the crystallite size revealed from XRD results. Predominantly, TiO2 nanoparticles look to be in a translucent spherical shape. Thus, after making a composite with cobalt nanoparticles, forbidden patches are noticed on the surface of transparent TiO2 nanoparticles.53 The electron diffraction pattern, as depicted in the SAED pattern (Fig. 8d), provides further insights into the crystallinity of the nanocomposite. This pattern displays bright and intense polymorphic rings, signifying a high degree of crystallinity within the particles. The presence of clearly visible lattice fringes in the TEM images indicates a well-ordered crystalline structure in the CT-12 nanocomposite, with the interlayer spacing measuring approximately 0.1825 nanometers.
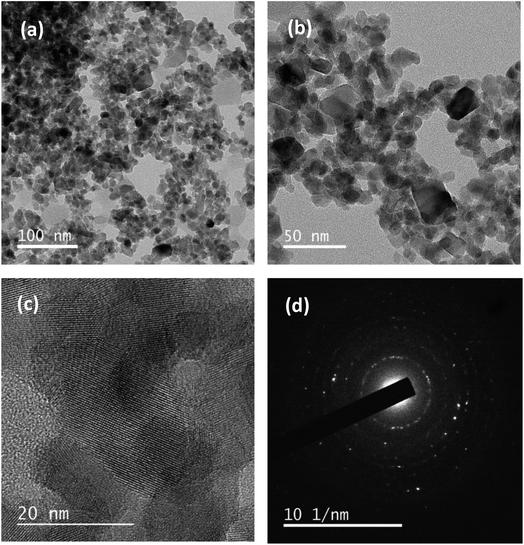 |
| | Fig. 8 TEM images of CT-12 nanocomposites (a) polyhedral structure, and (b) and (c) high resolution images; (d) the SAED pattern with the lattice plane view. | |
3.9 Photoluminescence study
Photoluminescence spectroscopy (PL) has been performed extensively to elucidate the processes governing electron transmission, separation, and recombination of photogenerated charge carriers. The PL spectra of p-Co3O4/n-TiO2 nanocomposite nanomaterials at different ratios (1![[thin space (1/6-em)]](https://www.rsc.org/images/entities/char_2009.gif) :
:![[thin space (1/6-em)]](https://www.rsc.org/images/entities/char_2009.gif) 1, 1
1, 1![[thin space (1/6-em)]](https://www.rsc.org/images/entities/char_2009.gif) :
:![[thin space (1/6-em)]](https://www.rsc.org/images/entities/char_2009.gif) 2, and 2
2, and 2![[thin space (1/6-em)]](https://www.rsc.org/images/entities/char_2009.gif) :
:![[thin space (1/6-em)]](https://www.rsc.org/images/entities/char_2009.gif) 1) are delineated in Fig. 9. M. Alhaddad et al. reported a substantial reduction in PL intensities upon the introduction of Co3O4, with the intensities of p-Co3O4/n-TiO2 nanocomposites notably lower than those of pristine TiO2 nanoparticles (NPs). This observation aligns with the outcomes presented herein.22
1) are delineated in Fig. 9. M. Alhaddad et al. reported a substantial reduction in PL intensities upon the introduction of Co3O4, with the intensities of p-Co3O4/n-TiO2 nanocomposites notably lower than those of pristine TiO2 nanoparticles (NPs). This observation aligns with the outcomes presented herein.22
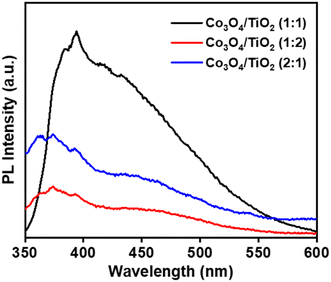 |
| | Fig. 9 PL spectra of CT-11, CT-12 and CT-21. | |
In correlation with photocatalytic results, it becomes apparent that the p-Co3O4/n-TiO2 nanocomposites adeptly capture photoinduced holes or electrons, thereby mitigating surface charge recombination and augmenting the oxidative degradation of organic contaminants. The p-Co3O4/n-TiO2 binary composite exhibits an obvious reduction in PL intensities, attributed to the potential disruption of the Ti–O–Ti linkage and the introduction of surface defects. Remarkably, the CT-12 composite demonstrates a significant decrease in PL intensities, supporting the observed superior photocatalytic activity in the same sample. Consequently, there exists a prospect to enhance the photocatalytic efficacy of the photocatalyst and restrict the rate at which photogenerated charge carriers undergo recombination.54
4. Photocatalytic activity
4.1 Dye degradation (orange red)
Evaluation of the CT photocatalyst's efficacy in degrading OR dye under sunlight revealed substantial reductions in dye absorbance, initially at 25 ppm, within the first 6 minutes of the reaction with absorbance drop of 79%, 83%, and 73% as depicted in Fig. 12. Following this initial phase, the degradation process reached a saturation point. To facilitate detailed analysis, UV-visible absorbance spectra were recorded at regular (1 minute) intervals for an additional 6 minutes, offering insights into the dye's absorbance evolution over time, particularly in the initial degradation phase. Fig. 10a–c portray characteristic degradation curves of OR dye for CT-11, CT-12, and CT-21, illustrating diminishing peak intensities as the dye degrades. Notably, a maximum absorbance loss of 83% was achieved after 6 minutes, highlighting a saturation threshold. The photodegradation efficiency followed the order of 83% > 79% > 73% for CT-12, CT-11 and CT-21, aligning well with the observed red shift in the UV-DRS study (Fig. 3) and correlating with the degradation order, confirming the influential role of catalyst band gap reduction in enhancing the photoactivity. Moreover, a higher TiO2 ratio relative to Co3O4 in the nanocomposites resulted in more pronounced degradation. Both CT-12 and CT-11 demonstrated over 83% and 79% degradation within the initial two minutes, reaching 81% degradation within 4 minutes. Beyond this, a marginal improvement in degradation was noted for CT-12, ultimately reaching a saturation point at 6 minutes. This enhanced photoactivity is due to the incorporation of Co3O4 with TiO2 facilitating the narrowing of band gap and reducing electron–hole recombination, thereby enhancing photoreactivity. The photocatalytic degradation of OR dye using pristine TiO2 and Co3O4 was 34% and 22% in 6 minutes which suggests that the p-Co3O4/n-TiO2 (CT-12) composite is 2.3 and 3.8 times more active in comparison to pristine TiO2 and Co3O4 respectively. These findings underscore the pivotal role of catalyst composition in optimizing photocatalytic processes for enhanced efficiency.
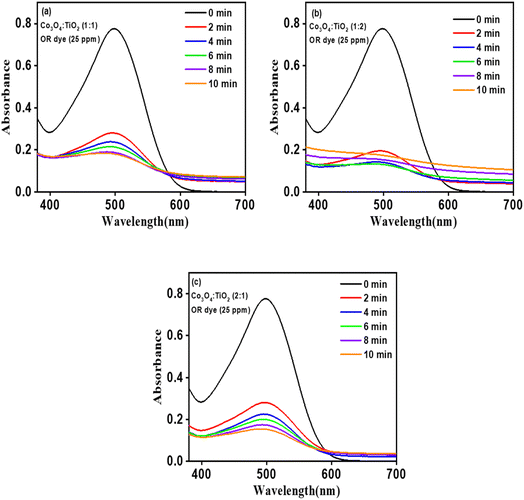 |
| | Fig. 10 UV-vis absorption spectra of OR solutions treated with CT nanostructures (a) CT-11 (b) CT-12 and (c) CT-21. | |
Fig. 11a and b illustrate that both CT-12 and CT-11 achieved the degradation of over 83% and 79% of OR dye within the initial two minutes. Additionally, 81% of OR dye degradation was achieved by both CT-12 and CT-11 within 4 minutes. Beyond this point, a slight improvement in degradation is observed for CT-12, and within 6 minutes, both catalysts reach a saturation point. This enhanced photoactivity can be attributed to the incorporation of Co3O4 with TiO2 in the CT nanocomposites, resulting in a narrower band gap. This alteration reduces electron (e−) and hole (h+) recombination, ultimately leading to increased photoreactivity. These findings underscore the critical role of catalyst composition in optimizing the photocatalytic process for enhanced efficiency.
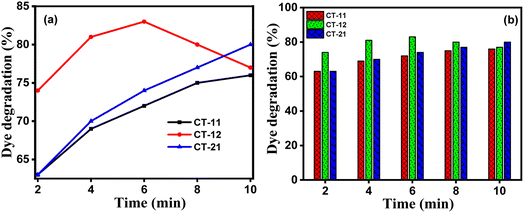 |
| | Fig. 11 (a) Percentage degradation of OR dye and (b) corresponding histogram of OR dye degradation over a period of time for CT-11, CT-12, and CT-21. | |
According to the histogram, deterioration reaches after saturation for both CT-12 and CT-11 at 10 minutes while CT-21 exhibits a modest rate of deterioration and saturation at about 10 minutes. The rapid kinetics of OR dye under sunlight irradiation support good degradation performance of CT-12 when compared to CT-11 and CT-21. The relationship between the irradiation period and dye concentration ratio (C/C0) is shown in Fig. 12. The photocatalysis degradation reactions with the OR dye displayed pseudo-first-order kinetics (the Langmuir–Hinshelwood model) with regard to the rate of deterioration. The outcomes were almost in accordance with the linear equation.
| |  | (2) |
where
C0 is the initial concentration of a dye,
C is the concentration at time
t, and
k is the reaction constant of the first order reaction.
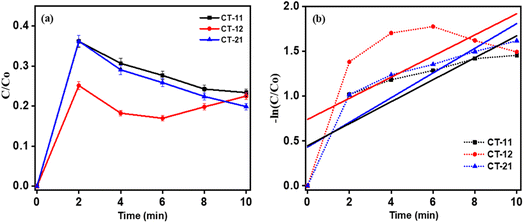 |
| | Fig. 12 Degradation kinetics of CT nanocomposites (a) C/C0vs. time and (b) −ln (C/C0) vs. time (min). | |
The superior photocatalytic efficiency of CT-12 nanoparticles to the other materials, as depicted in Fig. 12a, is due to the predominant presence of titanium, crucial in the mechanism driving dye degradation. Titanium dioxide (TiO2) within CT-12 exhibits exceptional light absorption capability, enabling more electrons to reach higher energy levels, thereby enhancing overall performance. Notably, TiO2 possesses a wider band gap compared to Co3O4, promoting the retreat of weaker electrons to the valence band upon stimulation. This characteristic minimizes energy loss, enhancing dye degradation efficiency.55 The higher k value of 0.2958 min−1 for CT-12, evident in Fig. 12b and Table 2, is attributed to robust nanocomposite interfaces between Co3O4 and TiO2. The Co3O4 integration within the TiO2 matrix potentially facilitates charge carrier transfer while hindering the recombination of photoinduced electron–hole pairs. Additionally, the crystalline nature of CT photocatalysts promotes swift charge transfer from the bulk to the surface.22
Table 2 OR dye degradation% and rate constant for CT-11, CT-12 and CT-21
| S. no. |
Sample |
Dye degradation in 6 minutes (%) |
Rate constant K (min−1) |
Surface area (m2 g−1) |
| 1. |
CT-12 |
83 |
0.29 |
106 |
| 2. |
CT-11 |
79 |
0.21 |
74 |
| 3. |
CT-21 |
73 |
0.22 |
49 |
4.2 Effect of temperature on photocatalytic degradation
Fig. 13a and b show the temperature effect on photocatalytic dye degradation and its kinetics. Temperature plays a crucial role in photocatalytic dye degradation. Elevated temperatures typically enhance the efficiency of photocatalytic processes by promoting better mobility of charge carriers and facilitating surface reactions. However, there is an optimal temperature range, as excessively high temperatures may lead to thermal degradation or alterations in the catalyst's structure. The interplay between temperature and photocatalytic efficiency underscores the need for careful temperature control in applications aiming for effective and sustainable dye degradation using photocatalysis. In the initial 30 seconds, rapid degradation occurred during photocatalytic dye degradation. Subsequently, at temperatures of 35 °C, 40 °C, and 45 °C, there was a modest improvement in degradation. The highest level of degradation was observed at the 2-minute mark. This indicates that temperature influences the efficiency of photocatalytic dye degradation, with an initial burst followed by a more gradual improvement, reaching maximum effectiveness at the 2-minute duration. The consistent and sustained photocatalytic activity throughout the 2-minute duration implies a stable performance of the photocatalyst. The initial burst of activity, followed by a gradual but sustained improvement, highlights the catalyst's effectiveness and ability to maintain its efficacy over a reasonable timeframe. Table 3 shows the calculated degradation percentage at different temperatures.
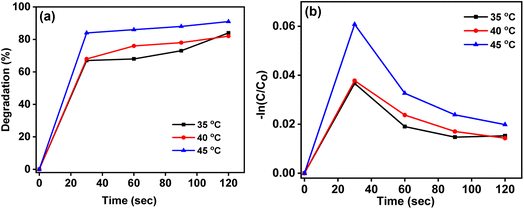 |
| | Fig. 13 (a) Percentage degradation of OR dye with the CT-12 photocatalyst at 35 °C, 40 °C and 45 °C (b) degradation kinetics of CT-12 at 35 °C, 40 °C and 45 °C (graph of −ln (C/C0) vs. time (min)). | |
Table 3 OR dye degradation% and rate constant for CT-12 at 35 °C, 40 °C and 45 °C
| S. no. |
Temperature |
Dye degradation (%) in 2 minutes |
Rate constant K (min−1) |
| 1. |
35 °C |
84 |
0.91 |
| 2. |
40 °C |
82 |
0.85 |
| 3. |
45 °C |
91 |
1.19 |
4.3 Reaction mechanism
Fig. 14 illustrates the schematic of the energy level and electron–hole movement in the Co3O4–TiO2 p–n junction structure. Co3O4 exhibits a much smaller band gap (∼2.3 eV) than TiO2 (∼3.1 eV). Upon sun light irradiation, electron–hole pairs are generated in both Co3O4 and TiO2. According to the energy level structure in Fig. 7, photogenerated electrons would move from the conduction band of Co3O4 to that of TiO2, leaving a hole behind in the valence band. In contrast, holes are injected from the valence band of TiO2 to that of Co3O4. As a result, a high concentration of electrons and holes is formed in the conduction band of TiO2 and the valence band of Co3O4, respectively. As a result, holes in the valence band and water combine, and an OH radical is generated. Furthermore, the electron in the conduction band and O2 will combine to form an O2 radical. Both of these produced radicals cause the breakdown of organic materials present in the aqueous medium.56,57 Typically, the oxidation of superoxide radical anions (˙O2), holes (h+), and ˙OH groups result in the breakdown of OR.58
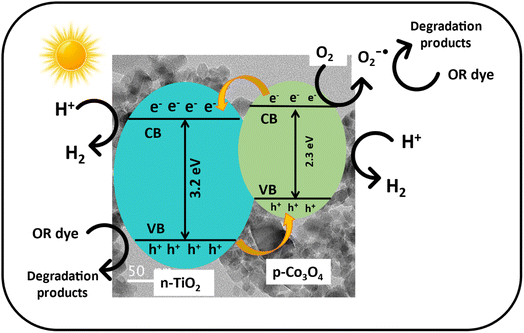 |
| | Fig. 14 Schematic of the energy level and electron–hole mobility in p-Co3O4/n-TiO2 nanocomposites under natural sunlight. | |
The following equations are used to clarify the particular mechanism of OR degradation as follows:
| | | Co3O4 − TiO2 + hν → Co3O4 − TiO2 (h+ + e−) | (3) |
| | | O2−* + 2H+ → O2 + H2O2 | (6) |
| | | OR + OH* → CO2 + H2O + inorganic product | (8) |
Table 4 presents a comparative analysis of dye degradation efficiency employing diverse Co3O4–TiO2 nanocomposites under specified conditions, outlining variations in photocatalytic performance.
Table 4 Different kinds of Co3O4 made using multiple methods of synthesis are used for degradation of dyes
| S. no. |
Photocatalyst |
Catalyst amount (mg) |
Pollutant |
Dye conc. (mg L−1) |
Degradation (%) |
Time (min) |
Rate constant K (min−1) |
Synthesis method |
Light source |
References |
| 1. |
Co3O4/TiO2 nanocomposite |
1000 |
Ciprofloxacin (CIP) |
10 |
100 |
60 |
0.0157 |
Sol–gel approach |
Visible |
22
|
| 2. |
p–n Co3O4–TiO2 heterojunction |
1000 |
Methyl orange |
100 |
88 |
120 |
0.0097 |
Wet incipient impregnation method |
Ordinary visible light |
13
|
| 3. |
Co3O4–TiO2 nanoparticles |
50 |
Tetracycline (TC) and phenol (Pl) |
— |
TC = 67.4, Pl = 85.6 |
180 |
TC = 0.01794, Pl = 0.01975 |
Sol–gel technique |
Sunlight |
59
|
| 4. |
Co3O4–TiO2 nanohybrid |
50 |
Methyl orange (MO) |
10 |
76 |
300 |
0.28 |
Sol–gel methodology |
Solar |
60
|
| 5. |
Co3O4/TiO2 nanorod arrays |
— |
Methylene blue |
10 |
MB = 60 |
530 |
0.91745 |
Photochemical deposition method |
500 W Xe lamp |
61
|
| 6. |
rGO-TiO2/Co3O4 nanocomposite |
50 |
Methylene blue and crystal violet |
10 |
— |
120 |
— |
Co-precipitation method |
150 W tungsten lamp (with main wavelength at 465 nm) |
62
|
| 7. |
0D/2D Co3O4/TiO2 Z-scheme heterojunction |
20 |
Enrofloxacin |
20 |
95.6 |
100 |
0.0269 |
Hydrothermal method |
500 W xenon lamp light source |
63
|
| 8. |
p-Co3O4/n-TiO2 nanopine arrays |
— |
Tetracycline hydrochloride (TC) |
— |
200 |
60 |
— |
Hydrothermal method |
Visible light |
64
|
| 9. |
Co3O4/TiO2 nanotube arrays (NTs) |
— |
Methyl orange (MO) |
4 × 10⁻⁵ M |
92 |
90 |
0.027 |
Impregnating–deposition–decomposition method |
50 W xenon lamp |
65
|
| 10. |
p–n heterojunction (Co3O4/TiO2) |
— |
Acetaminophen (ACE) |
— |
96.78 |
10 |
— |
— |
Simulate solar light illumination |
66
|
|
11.
|
Co
3
O
4
/TiO
2
nanocomposite
|
25
|
OR
|
25
|
83
|
6
|
0.2958
|
Hydrothermal
|
Sunlight
|
Present work
|
4.4 Reusability test
The reusability of the photocatalyst was evaluated through four repeated cycles. The photo-catalyst (CT-12) was extracted after use, then washed twice and dried. The dried powder was again utilized to degrade the orange-red dye. In this set of experiments, the ratio of the catalyst and dye was maintained the same in all cycles. It was observed that the degradation of OR dye was decreased from 83%, 78%, 68%, 59% and 47% at the end of every cycle (Fig. 15).
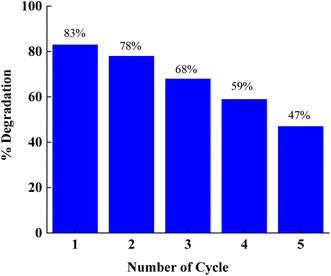 |
| | Fig. 15 Photocatalytic reusability performance of p-Co3O4/n-TiO2 (CT-12). | |
4.5 Photocatalytic hydrogen generation from water splitting
In the hydrogen production process via photocatalysis, a solution comprising 100 ml of deionized water with 0.5 wt% preloaded platinum as a co-catalyst, a CT nanocomposite catalyst, and methanol as a sacrificial agent is employed. Notably, the CT-12 nanocomposite exhibited the highest hydrogen production rate at 1120 μmol h−1 g−1, followed by CT-11 at 780 μmol h−1 g−1 and CT-21 at 522 μmol h−1 g−1, aligning with earlier observed dye breakdown efficiencies (Fig. 16). The exceptional photocatalytic activity of CT-12 is attributed to its narrow band gap of 2.13 eV, enabling efficient utilization of visible light. As established in prior research by J. Tang et al., methanol hinders oxygen (O2) generation by inducing free radicals and reducing charge carrier recombination.67 Methanol's irreversible interaction with photogenerated holes augments hydrogen yield while diminishing recombination. Under visible light, meeting or exceeding the semiconductor's band gap energy, photocatalysis activates the material's surface, generating hole–electron pairs within the composite material's valence band (VB) and conduction band (CB). Methanol interaction with VB holes generates protons (h+) and radicals, while CB electrons facilitate h+ ion breakdown, resulting in molecular hydrogen formation.68 The fundamental mechanism of water splitting involves generating electron–hole pairs within semiconductors, followed by their migration to the reaction surface during aqueous methanol reactions.
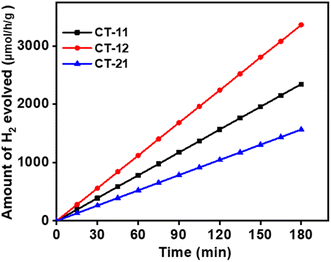 |
| | Fig. 16 Photocatalytic hydrogen generation via water splitting using samples CT-11, CT-12, and CT-21. | |
The following are the reactions involved in the generation of hydrogen:
| | | Co3O4 − TiO2 + hν → Co3O4 − TiO2 (h+ + e−) | (9) |
| | | CH3OH + h+ → CH2OH + H | (10) |
| | | CH2OH + h+ → HCHO + H+ | (11) |
Table 5 shows the amount of hydrogen generated for CT-11, CT-12, and CT-21, whereas Table 6 is a comparison table for the generated H2 utilizing various p-Co3O4/n-TiO2 nanocomposites.
Table 5 The rate of hydrogen generation for CT-11, CT-12, and CT-21
| S. no. |
Sample code |
H2 evolved (μmol h−1 g−1) |
| 1. |
CT-11 |
780 |
| 2. |
CT-12 |
1120 |
| 3. |
CT-21 |
522 |
Table 6 Various Co3O4/TiO2 nanocomposites for the generation of H2
| S. no. |
Photocatalyst |
Co-catalyst |
Light source |
Hydrogen production (μmol h−1 g−1) |
Sacrificial reagent |
Ref. |
| 1. |
Co3O4–TiO2 |
— |
Visible light |
6.5 |
No |
69
|
| 2. |
Co3O4–N–TiO2@Pt |
Pt |
Visible light |
197 |
Methanol |
70
|
| 3. |
TiO2/Co3O4 |
H2PtCl6 |
Sunlight |
721.6 |
10 vol% triethanolamine solution (50 mL) |
71
|
| 4. |
TiO2/Co3O4 composite |
Co3O4 |
Sunlight |
20.22 |
Methanol |
72
|
| 5. |
Co3O4/TiO2 |
— |
300 W Xe arc lamp |
342.7 |
Na2S (0.25 M) and Na2SO3 (0.15 M) solution |
73
|
| 6. |
Pt@Co3O4/TiO2 (CTP) |
Pt |
Sunlight |
964 |
45 mL of water and 5 mL of glycerol |
74
|
| 7. |
Co3O4 quantum dots (QDs)/TiO2 |
Pt |
Sunlight |
41.8 |
No sacrificial agent |
75
|
| 8. |
Co
3
O
4
/TiO
2
|
Pt
|
Sunlight
|
1120
|
Methanol
|
Present work
|
4.6 Total organic carbon (TOC) and biocompatibility of photo-catalytically treated OR dye solution
4.6.1 TOC study.
Total organic carbon (TOC) analysis: total organic carbon (TOC) was determined to know the amount of carbon found in orange red dye that was degraded to CO2 during oxidation. The orange red dye was analysed for mineralization based on the total organic carbon (TOC) removal (%). The TOC analysis was done using a TOC analyser (TOC-VCPN, Shimadzu, Japan) before and after the photocatalysis of the OR dye using the standard SM 5310B method. The TOC removal efficiency was calculated as eqn (14):| |  | (14) |
where TOCi and TOCt are the total organic carbon concentrations (mg L−1) of the OR dye before and after photocatalysis, respectively. The total organic carbon (% TOC) levels before and after the degradation of orange-red dye were measured using catalyst CT-12 under sunlight. A remarkable decrease in TOC was obtained which implies efficient mineralization of OR dye with CT-12. The TOC decreased from 62 to 9 mg L−1, which corresponded to 85% removal of the OR dye. This result was supported by experimental photocatalytic degradation of the OR dye (83%).
4.6.2 Biocompatibility test.
The germination experiment was conducted using a 20 cm round bottom glass dish with a complete randomized design. The experiment was performed with three treatments, which contained 30 uniform seeds of gram (Cicer arietinum L.) treated with (T1) tapwater, (T2) OR dye (25 ppm) and degraded OR dye (T3), at room temperature. The experiment was monitored continuously until the radicle length reached half the length of the seed, indicating germination. Germination characteristics were measured using the following formula:76| |  | (15) |
The findings of photocatalytic degradation of OR dye substantiate the progressive transformation of pollutant molecules into smaller entities. Subsequently, an investigation into the biocompatibility of the resulting post-degradation solution of orange red (OR) dye was conducted by assessing the growth of gram seeds (Cicer arietinum). For this purpose, gram seeds were subjected to cultivation under distinct conditions: tap water (control sample; T1), tap water containing OR dye (untreated solution; T2), and the OR dye solution treated with a p-Co3O4/n-TiO2 photocatalyst (T3) (Fig. 17). Observations depicted in the accompanying figure reveal a lack of significant growth in gram seeds immersed in the untreated solution. Conversely, seeds exposed to the photocatalytic-treated solution exhibited substantial growth, closely approximating the growth observed in the control sample. Hence, it can be inferred that the solution treated with the p-Co3O4/n-TiO2 photocatalyst demonstrates noteworthy efficacy for cultivation purposes.
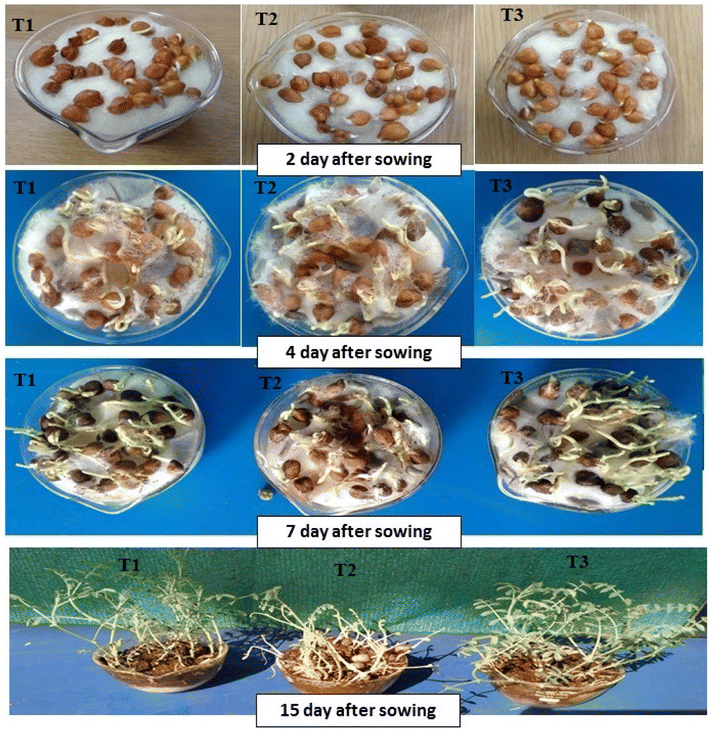 |
| | Fig. 17 Seed germination and plant growth under (T1) tap water, (T2) orange red dye (25 ppm) and (T3) degraded orange red dye at 2 DAS, 4 DAS, 5 DAS and 13 DAS. | |
5. IPCE and transient current–time profile
The IPCE values provide insights into the photo response efficiency of different p-Co3O4/n-TiO2 nanocomposites concerning their ability to convert incident photons into electrical current. In this context, the comparative trend of IPCE values indicates the order of efficiency among the synthesized nanocomposites (Fig. 18a). CT-12 exhibited the highest IPCE percentage among the investigated nanocomposites, indicating its superior ability to convert photons into current compared to CT-11 and CT-21. This enhanced efficiency of CT-12 suggests optimized photoexcitation and charge carrier generation, likely owing to specific ratios of cobalt and titanium precursors, resulting in enhanced photocatalytic activity. CT-11 followed with a slightly lower IPCE percentage than CT-12, implying a slightly reduced photon-to-current conversion efficiency. In contrast, CT-21 displayed the lowest IPCE percentage among the investigated nanocomposites. This comparatively lower efficiency suggests that the specific synthesis ratio or composition in CT-21 might be less favourable to efficient photon absorption or charge carrier generation compared to CT-12 and CT-11. The differences in incident photon-to-current efficiency (IPCE) among the p-Co3O4/n-TiO2 nanocomposites can be attributed to the specific ratios of cobalt and titanium precursors used during synthesis. CT-12 likely possesses an optimized composition that promotes superior charge separation and transfer, resulting in higher IPCE. A well-calibrated ratio of p-Co3O4/n-TiO2 enhances interfaces, crystal phases, and charge transfer dynamics, optimizing photon absorption and subsequent current generation, reflecting their photocatalytic activity.
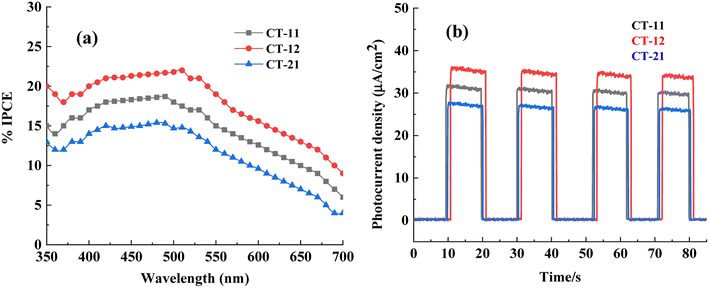 |
| | Fig. 18 (a) %IPCE vs. wavelength graph and (b) transient current–time profile (I–t) graph of CT-11, CT-12 and CT-21. | |
The transient current–time profiles for CT-11, CT-12, and CT-21 nanocomposites exhibit a consistent trend analogous to the observed patterns in incident photon-to-current efficiency (IPCE) and photocatalytic activity (Fig. 18b). This similarity underscores the direct correlation between photoresponse dynamics and the efficacy of these materials in catalyzing light-driven reactions. CT-12, demonstrating the highest IPCE and superior photocatalytic activity, aligns with a transient current–time profile characterized by robust and sustained current generation upon light exposure. This sustained current reflects efficient charge carrier generation, minimal recombination, and effective charge transfer within the nanocomposite, supporting its enhanced performance in photo-induced reactions. The similarity between the trends in transient current–time profiles, IPCE values, and photocatalytic activity reaffirms the intimate relationship between the nanocomposites photo-response dynamics and their effectiveness in catalysing light-driven reactions. This correlation highlights the crucial role of efficient charge carrier generation, dynamics, and transfer in dictating the overall performance of p-Co3O4/n-TiO2 nanocomposites in photocatalysis.
6. Conclusion
The research focused on synthesis of p-Co3O4/n-TiO2 (CT) nanocomposites as potential photocatalysts for two crucial applications: degrading organic dyes and generating hydrogen under sunlight. In-depth structural analyses, including XRD, revealed the composite nature of these materials, confirming specific crystalline phases corresponding to Co3O4 and TiO2. FTIR, UV-DRS, Raman, and BET analyses provided critical insights into the CT nanocomposites' chemical compositions, optical properties, surface characteristics, and specific surface areas, respectively. These analyses highlighted the materials' ability to efficiently absorb visible and UV light, crucial for initiating photocatalytic reactions, while also revealing correlations between surface properties and cobalt/titanium content. Photocatalytic valuations confirmed remarkable efficiency in degrading organic dyes (OR) and generating hydrogen under sunlight irradiation. Notably, CT-12 showcased superior performance owing to its narrow band gap, efficient charge separation mechanisms, and interactions with methanol, leading to enhanced hydrogen production rates and dye degradation efficiency. Overall, the comprehensive characterization and performance evaluations of CT nanocomposites underscore their immense potential for environmental remediation and sustainable energy production, positioning them as promising candidates for various industrial and environmental applications requiring efficient and sunlight-driven photocatalysis.
Conflicts of interest
The authors confirm that they do not have any known financial or personal conflicts of interest that could be perceived as influencing the research presented in this paper.
Acknowledgements
The authors would like to express their gratitude to the JRD Tata Fellowship from Savitribai Phule Pune University, Pune, India, and the MJPRF-2021 fellowship from Dr Babasaheb Ambedkar Samajik Nyay Bhavan, MA/15/1, S Ambazari Rd, Vasant Nagar, Nagpur, Maharashtra, India, for their valuable financial support.
References
- R. S. Salama, S. M. El-Bahy and M. A. Mannaa, Colloids Surf., A, 2021, 628, 127261 CrossRef CAS.
- Q. A. Alsulami, A. Rajeh, M. A. Mannaa, S. M. Albukhari and D. F. Baamer, Int. J. Hydrogen Energy, 2021, 46, 27349–27363 CrossRef CAS.
- Q. A. Alsulami, A. Rajeh, M. A. Mannaa, S. M. Albukhari and D. F. Baamer, Sci. Rep., 2022, 12, 6565 CrossRef PubMed.
- S. M. Hassan, A. I. Ahmed and M. A. Mannaa, Colloids Surf., A, 2019, 577, 147–157 CrossRef CAS.
- H. Lia, F. Ren, Q. Lia, J. Yang, Y. Wang and Z. Cheng, Appl. Surf. Sci., 2018, 457, 633–643 CrossRef.
- G. Yang, Z. Yan and T. Xiao, Appl. Surf. Sci., 2012, 258, 8704–8712 CrossRef CAS.
- J. Niua, B. Yao, Y. Chen, C. Peng, X. Yu, J. Zhang and G. Bai, Appl. Surf. Sci., 2013, 271, 39–44 CrossRef.
- S. M. Hassana, A. I. Ahmed and M. A. Mannaa, Ceram. Int., 2018, 44, 6201–6211 CrossRef.
- A. Zada, Y. Qu, S. Ali, N. Sun, H. Lu, R. Yan, X. Zhang and L. Jing, J. Hazard. Mater., 2018, 342, 715–723 CrossRef CAS PubMed.
- X. Deng, W. N. Schmidt and H. Tuysuz, Chem. Mater., 2014, 26, 6127–6134 CrossRef CAS.
- V. N. Rao, P. Ravib, M. Sathish, K. K. Cheralathan, B. Neppolian, M. Mamatha Kumari and M. V. Shankar, Ceram. Int., 2021, 47, 10226–10235 CrossRef.
- A. Habibi-Yangjeh and K. Pournemati, Crit. Rev. Environ. Sci. Technol., 2024, 54, 290–320 CrossRef CAS.
- A. Akhundi, A. Z. Moshfegh, A. Habibi-Yangjeh and M. Sillanpaa, ACS EST Engg., 2022, 2, 564–585 CrossRef CAS.
- R. Gusain, K. Gupta, P. Joshi and O. P. Khatri, Adv. Colloid Interface Sci., 2019, 272, 102009 CrossRef CAS PubMed.
- M. Saeed, M. Muneer, A. u. Haq and N. Akram, Environ. Sci. Pollut. Res., 2022, 29, 293–311 CrossRef CAS PubMed.
- G. Somasundaram, J. Rajan, P. Sangaiya and R. Dilip, Results Mater., 2019, 4, 100044 CrossRef.
- M. Honarmand, M. Mirzadeh and M. Honarman, J. Environ. Health Sci. Eng., 2020, 18, 1581–1593 CrossRef CAS PubMed.
- S. Gadge, A. Tamboli, M. Shinde, H. Fouad, C. Terashima, R. Chauhan and S. Gosavi, J. Solid State Electrochem., 2023, 27, 2005–2015 CrossRef CAS.
- K. Dulta, G. K. Agceli, P. Chauhan, R. Jasrotia, P. K. Chauhan and J. O. Ighalo, Sustainable Environ. Res., 2022, 32, 2 CrossRef CAS.
- Q. Guo, C. Zhou, Z. Ma and X. Yang, Adv. Mater., 2019, 31, 1901997 CrossRef CAS PubMed.
- M. Honarmand and M. Mahjoore, J. Geomine, 2023, 1, 7–12 Search PubMed.
- M. Alhaddad, A. A. Ismail, Y. G. Alghamdi, N. D. Al-Khathami and R. M. Mohamed, Opt. Mater., 2022, 131, 112643 CrossRef CAS.
- S. Landi Jr, J. Carneiro, S. Ferdov, A. M. Fonseca, I. C. Neves, M. Ferreira, P. Parpot, O. S. G. P. Soares and M. F. R. Pereira, J. Photochem. Photobiol., A, 2017, 346, 60–69 CrossRef.
- H. M. Mousa, J. F. Alenezi, I. M. A. Mohamed, A. S. Yasin, A.-F. M. Hashem and A. Abdal-hay, J. Alloys Compd., 2021, 886, 161169 CrossRef CAS.
- M. Ullah, X. Bai, J. Chen, H. Lv, Z. Liu, Y. Zhang, J. Wang, B. Sun, L. Li and K. Shi, Colloids Surf., A, 2021, 612, 125972 CrossRef CAS.
- X. Li, X. Wang, Y. Nan, Y. Sun, H. Xu, L. Chi, Y. Huang, J. Duan and B. Hou, Colloids Surf., A, 2023, 664, 131150 CrossRef CAS.
- M. Yahyazadehfar, S. A. Ahmadi, E. Sheikhhosseini and D. Ghazanfari, J. Mater. Sci.: Mater. Electron., 2020, 31, 11618–11623 CrossRef CAS.
- Q. Yuanchun, Z. Yanbao and W. Zhishen, Mater. Chem. Phys., 2008, 110, 457–462 CrossRef.
- P. Priyadharsini, P. SundarRajan, K. G. Pavithra, S. Naveen, S. SanjayKumar, D. Gnanaprakash, J. Arun and A. Pugazhendhi, J. Cleaner Prod., 2023, 426, 139180 CrossRef CAS.
- V. Diniz, C. R. Crick and S. Rath, J. Environ. Manage., 2023, 346, 118979 CrossRef CAS PubMed.
- C. Hu, S. Duo, R. Zhang, M. Li, J. Xiang and W. Li, Mater. Lett., 2010, 64, 2040–2042 CrossRef CAS.
- N. D. Abazovic, M. I. Comor, M. D. Dramicanin, D. J. Jovanovic, S. P. Ahrenkiel and J. M. Nedeljkovic, J. Phys. Chem. B, 2006, 110, 25366–25370 CrossRef CAS PubMed.
- S. Mugundan, B. Rajamannan, G. Viruthagiri, N. Shanmugam, R. Gobi and P. Praveen, Appl. Nanosci., 2015, 5, 449–456 CrossRef CAS.
- N. Yan, L. Hu, Y. Li, Y. Wang, H. Zhong, X. Hu, X. Kong and Q. Chen, J. Phys. Chem. C, 2012, 116, 7227–7235 CrossRef CAS.
- Y. Tang, J. Zhou, J. Liu, L. Liu and S. Liang, Int. J. Electrochem. Sci., 2013, 8, 1138–1145 CrossRef CAS.
- X. J. Zhou, P. H. Shi, Y. F. Qin, J. C. Fan, Y. L. Min and W. F. Yao, J. Mater. Sci.: Mater. Electron., 2016, 27, 1020–1030 CrossRef CAS.
- N. Sreeram, V. Aruna, R. Koutavarapu, D.-Y. Lee and J. Shim, Chemosphere, 2022, 299, 134477 CrossRef CAS PubMed.
- V. Manikandan, M. Singh, B. C. Yadav and J. C. Denardin, J. Sci.: Adv. Mater. Devices, 2018, 3, 145–150 Search PubMed.
- A. Fernandez-Osorio, A. Vazquez-Olmos, R. Sato-Berru and R. Escudero, Rev. Adv. Mater. Sci., 2009, 22, 60–66 CAS.
- S. S. El-Deen, A. M. Hashem, A. E. A. Ghany, S. Indris, H. Ehrenberg, A. Mauger and C. M. Julien, Ionics, 2018, 24, 2925–2934 CrossRef CAS.
- S. S. Al-Taweel and H. R. Saud, J. Chem. Pharm. Res., 2016, 8(2), 620–626 CAS.
- S. Ding, D. Wang and X. Wang, Sep. Purif. Technol., 2022, 301, 122033 CrossRef CAS PubMed.
- H. Wang, Y. Zeng, H. Mao, H. Huang and Y. Hu, Chem. Nanomater., 2022, 8, 202200263 Search PubMed.
- J.-T. Ren, Y.-L. Zheng, K. Yuan, L. Zhou, K. Wu and Y.-W. Zhang, Nanoscale, 2020, 12(2), 755–762 RSC.
- H. Fan, L. Quan, M. Yuan, S. Zhu, K. Wang, Y. Zhong, L. Chang, H. Shao, J. Wang, J. Zhang and C.-n. Cao, Electrochim. Acta, 2016, 188, 222–229 CrossRef CAS.
- J. Yang, F. Wei, Y. Sui, J. Qi, Y. He, Q. Meng and S. Zhang, RSC Adv., 2016, 6(66), 61803–61808 RSC.
- A. Manivannan, M. S. Seehra, S. B. Majumder and R. S. Katiyar, Appl. Phys. Lett., 2003, 83, 111 CrossRef CAS.
- F. Guzelcimen, B. Tanoren, C. Cetinkaya, M. D. Kaya, H. I. Efkere, Y. Ozen, D. Bingol, M. Sirkeci, B. Kınacı, M. B. Unlu and S. Ozcelik, Vacuum, 2020, 182, 109766 CrossRef CAS.
- B. Bharti, S. Kumar, H.-N. Lee and R. Kumar, Sci. Rep., 2016, 6, 32355 CrossRef CAS PubMed.
- Y. Jiang, D. Yang, L. Zhang, Q. Sun, X. Sun, J. Li and Z. Jiang, Adv. Funct. Mater., 2009, 19, 150–156 CrossRef CAS.
- K. Das, S. N. Sharma, M. Kumar and S. K. De, J. Phys. Chem. C, 2009, 113, 14783–14792 CrossRef CAS.
- L. Narayana, M. Matheswaran, A. A. Aziz and P. Saravanan, Desalination, 2011, 269, 249–253 CrossRef.
- S. Mugundan, B. Rajamannan, G. Viruthagiri, N. Shanmugam, R. Gobi and P. Praveen, Appl. Nanosci., 2015, 5, 449–456 CrossRef CAS.
- G. D. Moon, J. B. Joo, I. Lee and Y. Yin, Nanoscale, 2014, 6, 12002–12008 RSC.
- R. Raliya, C. Avery, S. Chakrabarti and P. Biswas, Appl. Nanosci., 2017, 7, 253–259 CrossRef CAS.
- M. Saini, B. S. Dehiya and A. Umar, Ceram. Int., 2020, 46, 986–995 CrossRef CAS.
- J. Singh, S. Kaur, G. Kaur, S. Basu and M. Rawat, Green Process. Synth., 2019, 8, 272–280 CAS.
- S. Hussain, N. Farooq, A. S. Alkorbi, R. Alsaiari, N. A. Alhemiary, M. Wang and G. Qiao, J. Mol. Liq., 2022, 362, 119765 CrossRef CAS.
- M. M. Abutalib, H. M. Alghamdi, A. Rajeh, O. Nur, A. M. Hezma and M. A. Mannaa, J. Mater. Res. Technol., 2022, 20, 1043–1056 CrossRef CAS.
- S. Noor, S. Sajjad, S. A. K. Leghari, C. Flox and T. Kallio, Int. J. Hydrogen Energy, 2020, 45, 17410–17421 CrossRef CAS.
- Y. Du, Z. Zheng, W. Chang, C. Liu, Z. Bai, X. Zhao and C. Wang, Nanomaterials, 2021, 11, 214 CrossRef CAS PubMed.
- R. Ranjith, V. Renganathan, S.-M. Chen, N. S. Selvan and P. S. Rajam, Ceram. Int., 2019, 45, 12926–12933 CrossRef CAS.
- Y. Wang, C. Zhu, G. Zuo, Y. Guo, W. Xiao, Y. Dai, J. Kong, X. Xu, Y. Zhou, A. Xie, C. Sun and Q. Xian, Appl. Catal., B, 2020, 5, 119298 CrossRef.
- Z. Jiang, Y. Lu, Y.-Y. Song and Z. Gao, J. Environ. Chem. Eng., 2023, 11, 109298 CrossRef CAS.
- G. Dai, S. Liu, Y. Liang and T. Luo, Appl. Surf. Sci., 2013, 264, 157–161 CrossRef CAS.
- Q. Li, M. Zhang, Y. Xu, X. Quan, Y. Xu, W. Liu and L. Wang, Chin. Chem. Lett., 2023, 34, 107530 CrossRef CAS.
- Y. A. Sethi, A. K. Kulkarni, S. K. Khore, R. P. Panmand, S. C. Kanade, S. W. Gosavi, M. V. Kulkarni and B. B. Kale, RSC Adv., 2019, 9, 28525–28533 RSC.
- Y. A. Sethi, A. K. Kulkarni, A. A. Ambalkar, R. P. Panmand, M. V. Kulkarni, S. W. Gosavi and B. B. Kale, RSC Adv., 2021, 11, 29877–29886 RSC.
- Q. Zhang, Z. Hai, A. Jian, H. Xu, C. Xue and S. Sang, Nanomaterials, 2016, 6, 138 CrossRef PubMed.
- W.-D. Wei, X.-Y. Liu, S.-C. Cui and J.-G. Liu, RSC Adv., 2017, 7, 25650–25656 RSC.
- Z. Hao, X. Tian, C. Wang, B. Yu, L. Wang, Y. Gao, Z.-G. Han, M. Shao and R. Zhang, ACS Sustainable Chem. Eng., 2023, 11, 13709–13717 CrossRef CAS.
- S. N. F. Moridon, D. Anggraini, K. Arifin, L. J. Minggu and M. B. Kassim, Malaysian J. Anal. Sci., 2022, 26, 581–588 Search PubMed.
- G. Xiao, J. Pan, Y. Fu and C. Li, J. Phys.: Conf. Ser., 2021, 2011, 012089 CrossRef CAS.
- V. N. Rao, P. Ravib, M. Sathishb, K. K. Cheralathan, B. Neppolian, M. Mamatha Kumari and M. V. Shankar, Ceram. Int., 2021, 47, 10226–10235 CrossRef.
- J. Liu, J. Ke, Y. Li, B. Liu, L. Wang, H. Xiao and S. Wang, Appl. Catal., B, 2018, 236, 396–403 CrossRef CAS.
- M. A. Ranal, D. G. D. Santana, W. R. Ferreira and C. Mendes-Rodrigues, Rev. Bras. Bot., 2009, 32, 849–855 CrossRef.
|
| This journal is © The Royal Society of Chemistry 2024 |
Click here to see how this site uses Cookies. View our privacy policy here.  Open Access Article
 c,
Indra Jeet
Chaudhary
b,
Muthupandian
Ashokkumar
 d and
Suresh
Gosavi
 *ade
*ade
![[thin space (1/6-em)]](https://www.rsc.org/images/entities/char_2009.gif) :
:![[thin space (1/6-em)]](https://www.rsc.org/images/entities/char_2009.gif) 1, 1
1, 1![[thin space (1/6-em)]](https://www.rsc.org/images/entities/char_2009.gif) :
:![[thin space (1/6-em)]](https://www.rsc.org/images/entities/char_2009.gif) 2, and 2
2, and 2![[thin space (1/6-em)]](https://www.rsc.org/images/entities/char_2009.gif) :
:![[thin space (1/6-em)]](https://www.rsc.org/images/entities/char_2009.gif) 1) to examine their catalytic performance for different compositions. The research aims to ascertain the influence of varying ratios on the nanocomposites efficacy in photocatalysis. By systematically exploring the synthesis and characterization of p-Co3O4/n-TiO2 nanocomposites, this study contributes to the development of advanced photocatalytic materials capable of harnessing solar energy more effectively. The ultimate goal is to pave the way for the creation of innovative nanocomposite photocatalysts that can efficiently address environmental challenges while promoting sustainable energy production.
1) to examine their catalytic performance for different compositions. The research aims to ascertain the influence of varying ratios on the nanocomposites efficacy in photocatalysis. By systematically exploring the synthesis and characterization of p-Co3O4/n-TiO2 nanocomposites, this study contributes to the development of advanced photocatalytic materials capable of harnessing solar energy more effectively. The ultimate goal is to pave the way for the creation of innovative nanocomposite photocatalysts that can efficiently address environmental challenges while promoting sustainable energy production.![[thin space (1/6-em)]](https://www.rsc.org/images/entities/char_2009.gif) :
:![[thin space (1/6-em)]](https://www.rsc.org/images/entities/char_2009.gif) 1, 1
1, 1![[thin space (1/6-em)]](https://www.rsc.org/images/entities/char_2009.gif) :
:![[thin space (1/6-em)]](https://www.rsc.org/images/entities/char_2009.gif) 2, and 2
2, and 2![[thin space (1/6-em)]](https://www.rsc.org/images/entities/char_2009.gif) :
:![[thin space (1/6-em)]](https://www.rsc.org/images/entities/char_2009.gif) 1, respectively. Purification involved multiple washings with distilled water and ethanol in a centrifuge machine. The purified samples were dried at 80 °C and further subjected to calcination at 500 °C for 3 hours in the presence of air. This process yielded the materials p-Co3O4/n-TiO2 (1
1, respectively. Purification involved multiple washings with distilled water and ethanol in a centrifuge machine. The purified samples were dried at 80 °C and further subjected to calcination at 500 °C for 3 hours in the presence of air. This process yielded the materials p-Co3O4/n-TiO2 (1![[thin space (1/6-em)]](https://www.rsc.org/images/entities/char_2009.gif) :
:![[thin space (1/6-em)]](https://www.rsc.org/images/entities/char_2009.gif) 1), p-Co3O4/n-TiO2 (1
1), p-Co3O4/n-TiO2 (1![[thin space (1/6-em)]](https://www.rsc.org/images/entities/char_2009.gif) :
:![[thin space (1/6-em)]](https://www.rsc.org/images/entities/char_2009.gif) 2), and p-Co3O4/n-TiO2 (2
2), and p-Co3O4/n-TiO2 (2![[thin space (1/6-em)]](https://www.rsc.org/images/entities/char_2009.gif) :
:![[thin space (1/6-em)]](https://www.rsc.org/images/entities/char_2009.gif) 1) labelled as CT-11, CT-12, and CT-21. The synthesized materials were subjected to comprehensive characterization utilizing various analytical techniques to elucidate their structural, morphological, and compositional properties. Subsequently, these materials are assessed for their photocatalytic performance, specifically in the realms of dye degradation and hydrogen production, elucidating their potential in environmental remediation and renewable energy applications.
1) labelled as CT-11, CT-12, and CT-21. The synthesized materials were subjected to comprehensive characterization utilizing various analytical techniques to elucidate their structural, morphological, and compositional properties. Subsequently, these materials are assessed for their photocatalytic performance, specifically in the realms of dye degradation and hydrogen production, elucidating their potential in environmental remediation and renewable energy applications.
![[thin space (1/6-em)]](https://www.rsc.org/images/entities/char_2009.gif) 000 rpm for 20 minutes facilitating the separation of the dye from the photocatalyst. Absorbance spectra of the resulting supernatant samples were recorded using a UV-vis system for detailed analysis. Comparative assessment revealed differing efficiencies in photodegradation among the three CT nanocomposites, with the observed trend of performance ranking as CT-12 > CT-11 > CT-21. Notably, the CT-12 nanocomposite exhibited superior photocatalytic efficacy in degrading the OR dye under natural sunlight conditions.
000 rpm for 20 minutes facilitating the separation of the dye from the photocatalyst. Absorbance spectra of the resulting supernatant samples were recorded using a UV-vis system for detailed analysis. Comparative assessment revealed differing efficiencies in photodegradation among the three CT nanocomposites, with the observed trend of performance ranking as CT-12 > CT-11 > CT-21. Notably, the CT-12 nanocomposite exhibited superior photocatalytic efficacy in degrading the OR dye under natural sunlight conditions.
![[thin space (1/6-em)]](https://www.rsc.org/images/entities/char_2009.gif) :
:![[thin space (1/6-em)]](https://www.rsc.org/images/entities/char_2009.gif) 2
2![[thin space (1/6-em)]](https://www.rsc.org/images/entities/char_2009.gif) :
:![[thin space (1/6-em)]](https://www.rsc.org/images/entities/char_2009.gif) 1
1![[thin space (1/6-em)]](https://www.rsc.org/images/entities/char_2009.gif) :
:![[thin space (1/6-em)]](https://www.rsc.org/images/entities/char_2009.gif) 1
1
![[thin space (1/6-em)]](https://www.rsc.org/images/entities/char_2009.gif) :
:![[thin space (1/6-em)]](https://www.rsc.org/images/entities/char_2009.gif) 1, 1
1, 1![[thin space (1/6-em)]](https://www.rsc.org/images/entities/char_2009.gif) :
:![[thin space (1/6-em)]](https://www.rsc.org/images/entities/char_2009.gif) 2, and 2
2, and 2![[thin space (1/6-em)]](https://www.rsc.org/images/entities/char_2009.gif) :
:![[thin space (1/6-em)]](https://www.rsc.org/images/entities/char_2009.gif) 1) are delineated in Fig. 9. M. Alhaddad et al. reported a substantial reduction in PL intensities upon the introduction of Co3O4, with the intensities of p-Co3O4/n-TiO2 nanocomposites notably lower than those of pristine TiO2 nanoparticles (NPs). This observation aligns with the outcomes presented herein.22
1) are delineated in Fig. 9. M. Alhaddad et al. reported a substantial reduction in PL intensities upon the introduction of Co3O4, with the intensities of p-Co3O4/n-TiO2 nanocomposites notably lower than those of pristine TiO2 nanoparticles (NPs). This observation aligns with the outcomes presented herein.22


