DOI:
10.1039/D3NA00749A
(Paper)
Nanoscale Adv., 2024,
6, 256-267
An on-site and portable electrochemical sensing platform based on spinel zinc ferrite nanoparticles for the quality control of paracetamol in pharmaceutical samples†
Received
7th September 2023
, Accepted 15th November 2023
First published on 16th November 2023
Abstract
In this study, crystalline spinel zinc ferrite nanoparticles (ZnFe2O4 NPs) were successfully prepared and proposed as a high-performance electrode material for the construction of an electrochemical sensing platform for the detection of paracetamol (PCM). By modifying a screen-printed carbon electrode (SPE) with ZnFe2O4 NPs, the electrochemical characteristics of the ZnFe2O4/SPE and the electrochemical oxidation of PCM were investigated by cyclic voltammetry (CV), electrochemical impedance spectroscopy (EIS), chronoamperometry (CA), and differential pulse voltammetry (DPV) methods. The calculated electrochemical kinetic parameters from these techniques including electrochemically active surface area (ECSA), peak-to-peak separation (ΔEp), charge transfer resistance (Rct), standard heterogeneous electron-transfer rate constants (k0), electron transfer coefficient (α), catalytic rate constant (kcat), adsorption capacity (Γ), and diffusion coefficient (D) proved that the as-synthesized ZnFe2O4 NPs have rapid electron/mass transfer characteristics, intrinsic electrocatalytic activity, and facilitate the adsorption–diffusion of PCM molecules towards the modified electrode surface. As expected, the ZnFe2O4/SPE offered excellent analytical performance towards sensing of PCM with a detection limit of 0.29 μM, a wide linear range of 0.5–400 μM, and high electrochemical sensitivity of 1.1 μA μM−1 cm−2. Moreover, the proposed ZnFe2O4-based electrochemical nanosensor also exhibited good repeatability, high anti-interference ability, and practical feasibility toward PCM sensing in a pharmaceutical tablet. Based on these observations, the designed electrochemical platform not only provides a high-performance nanosensor for the rapid and highly efficient detection of PCM but also opens a new avenue for routine quality control analysis of pharmaceutical formulations.
1. Introduction
Paracetamol (PCM) also known as acetaminophen or N-acetyl-p-aminophenol is one of the most widely available and commonly used antipyretic and analgesic drugs.1,2 PCM has been used for more than a century as an effective and safe treatment for relieving pain (headache, backache, muscular aches, arthritis, and post-operative pains) and reducing fever.3,4 Generally, PCM is relatively free of side effects at the normal therapeutic doses, but hypersensitivity, overdoses, or regular use of PCM can cause amassing of toxic metabolites which leads to hepatic toxicity, and liver and kidney damage.5–7 Owing to its low cost and easy accessibility, the growing production of PCM drug results in increasing amounts of poor-quality pharmaceuticals in global public health, leading to potential risks to human health. Therefore, monitoring the PCM doses in a given pharmaceutical formulation is crucial for quality control, stability testing, identification, and clinical studies before being licensed for circulation in the commercial market.
To date, many analytical methods have been employed for the determination of PCM content in pharmaceutical formulations including spectrophotometry,8 high-performance liquid chromatography,9 titrimetry,10 spectrofluorimetry,11 UV-Vis spectroscopy,8 gas chromatography,12 and capillary electrophoresis.13 Nevertheless, these quantification techniques are unsuitable for performing routine, rapid, and on-site analysis due to the requirements for sophisticated expensive instruments, time-consuming sampling, skilled operators, and centralized laboratories. For this reason, it is imperative to develop rapid, sensitive, cost-effective, and efficient detection methods for quantitative determination of PCM. Since PCM is an electroactive compound and the mechanism of electrochemical oxidation/reduction has been systematically investigated,1,14,15 electrochemical sensors have attracted widespread attention and great potential in the pharmaceutical quality control of PCM. Owing to the inherent advantages including rapid analysis time, cost-effectiveness, facile miniaturization, on-site detection, high sensitivity and selectivity,16–18 the electrochemical sensor can be used as a promising sensing platform for the determination of PCM. To date, numerous electrochemical sensors have been developed for the electrochemical detection of PCM. Rohini M. Hanabaratti et al.19 reported an economical and efficient glassy carbon electrode (GCE) modified with zinc oxide NPs for quantitative determination of PCM. Jayant I. Gowda et al.20 prepared a GCE modified with multiwalled carbon nanotube-cetyltrimethyl ammonium bromide for PCM oxidation detection in medical, pharmaceutical and biotechnological real samples. Recently, Edgar Nagles et al.21 developed a new method based on a carbon paste electrode (CPE) and La2O3 to detect and quantify PCM in tablets, powder and syrup with PCM.
Nowadays, with the rapid development of nanoscience and nanotechnology, the usage of nanomaterials as signal amplification components has attracted tremendous attention in the construction of a high-performance electrochemical sensing platform for the ultra-sensitive detection of targeted analytes.16,22,23 When nanomaterials are introduced into the electrode surface, the electrochemical kinetic parameters can be comprehensively improved, leading to considerable enhancement in the overall analytical performance.24,25 Recently, spinel oxide-based nanostructures have become quite popular modifiers due to their advantages such as low cost, chemical stability, rich redox properties, superior catalytic activity, and fast electron transfer kinetics.26,27 Particularly, many research and review articles have investigated and summarized the use of various spinel nanostructures such as spinel ferrite (AFe2O4), spinel cobaltite (MCo2O4), and zinc oxide spinel (ZnB2O4) as electrochemical sensors.27–29 In recent work, our group developed a series of electrochemical sensors based on AFe2O4 (A = Zn, Co, Mn, Ni, Cu), BCo2O4 (B = Zn, Cu), and ZnFe2O4/ZnO hetero-nanostructures for the highly sensitive detection of various types of analytes including chloramphenicol, furazolidone, carbaryl, and clenbuterol.30–34 Therefore, the electrochemical sensing platform and spinel oxide nanostructures are expected to provide a promising combination for quickly and accurately analysing as well as quantifying pharmaceutical tablets.
In the present work, a spinel zinc ferrite (ZnFe2O4) nanomaterial was successfully prepared by a facile hydrothermal method and applied to the electrochemical determination of PCM. The developed ZnFe2O4-modified electrode possesses rapid electron/mass transfer properties, fabulous electrocatalytic activity, and enhanced adsorption/diffusion capacity compared to the bare screen-printed electrode (SPE). With the rapid growth of the screen-printing technique, SPEs with the advantages of cost-effectiveness, small size, and easy integration have proven to be a powerful tool to overcome the limitations of conventional three-electrode systems (CPE, GCE) such as requiring repeated recalibration, complicated pre-treatment, and being inappropriate for on-site analysis. As a result, the ZnFe2O4/SPE-based electrochemical sensor has splendid electroanalytical performance towards the electro-oxidation of PCM with high electrochemical sensitivity, low limit of detection, wide linear dynamic range, good repeatability, and excellent anti-interference ability. Furthermore, the developed electrochemical sensing platform based on the ZnFe2O4-modified SPE was successfully applied for quantifying the amounts of PCM drug in commercially available pharmaceutical formulations with satisfactory recovery value. Our proposed rapid-sensing platform and portable electrochemical device would open new avenues for the precise, sensitive, efficient, and on-site detection of PCM in pharmaceutical and urine samples.
2. Experimental procedures
2.1. Chemicals and reagents
Zinc nitrate hexahydrate Zn(NO3)2·6H2O, iron(III) nitrate nonahydrate Fe(NO3)3·9H2O, ethylene glycol (CH2OH)2, and sodium hydroxide (NaOH) were supplied by Xilong Scientific Co., Ltd. Potassium chloride (KCl), potassium dihydrogen phosphate (KH2PO4), sodium chloride (NaCl), and dibasic sodium phosphate (Na2HPO4) were manufactured by Merck KGaA, Germany. A pure sample of PCM powder obtained from the National Institute of Drug Quality Control of Vietnam was used as standard. All the reagents used were of analytical grade and all of the aqueous solutions were prepared using deionized (DI) water.
2.2. Synthesis of ZnFe2O4 NPs
ZnFe2O4 NPs were synthesized using a hydrothermal method, combined with subsequently annealing treatment based on the previously published literature.31 In brief, appropriate quantities of Zn(NO3)2·6H2O and Fe(NO3)3·9H2O with the molar ratio of 1![[thin space (1/6-em)]](https://www.rsc.org/images/entities/char_2009.gif) :
:![[thin space (1/6-em)]](https://www.rsc.org/images/entities/char_2009.gif) 2 were added into 80 mL of a DI water/ethylene glycol mixture (1
2 were added into 80 mL of a DI water/ethylene glycol mixture (1![[thin space (1/6-em)]](https://www.rsc.org/images/entities/char_2009.gif) :
:![[thin space (1/6-em)]](https://www.rsc.org/images/entities/char_2009.gif) 1 volumetric ratio). Afterward, 2 M aqueous NaOH solution was added dropwise to the above homogeneous mixture to form a dark red precipitate. After stirring for 10 minutes, the obtained solution was sealed in a Teflon-lined stainless-steel autoclave and reacted at 180 °C for 12 h. After being cooled naturally to room temperature, the obtained product was harvested by centrifugation and washed with ethanol and DI water before drying at 60 °C for 24 h. Finally, the ZnFe2O4 NPs were produced by calcining the powder at 500 °C for 5 h in air.
1 volumetric ratio). Afterward, 2 M aqueous NaOH solution was added dropwise to the above homogeneous mixture to form a dark red precipitate. After stirring for 10 minutes, the obtained solution was sealed in a Teflon-lined stainless-steel autoclave and reacted at 180 °C for 12 h. After being cooled naturally to room temperature, the obtained product was harvested by centrifugation and washed with ethanol and DI water before drying at 60 °C for 24 h. Finally, the ZnFe2O4 NPs were produced by calcining the powder at 500 °C for 5 h in air.
2.3. Fabrication of the ZnFe2O4-modified electrode
The ZnFe2O4-modified SPE electrode was prepared via a facile drop-casting method. First, 1 mg of the as-prepared ZnFe2O4 NPs was dispersed in 1 mL of DI water by ultrasonic treatment for 3 h to form a homogeneous suspension. Then, an 8 μL aliquot of the ZnFe2O4 suspension was dripped onto the working surface of the bare SPE and dried at room temperature. Finally, the ZnFe2O4/SPE was preserved at 4 °C in a refrigerator for subsequent electrochemical experiments.
2.4. Electrochemical measurements
All electrochemical measurements including cyclic voltammetry (CV), electrochemical impedance spectroscopy (EIS), chronoamperometry (CA), and differential pulse voltammetry (DPV) techniques were performed using a Palmsens 4 electrochemical workstation (PS Trace, Palmsens, The Netherlands).
The characterization of the bare SPE and ZnFe2O4/SPE was carried out by CV and EIS techniques. CV was carried out in 0.1 M KCl solution containing 5 mM K3[Fe(CN)6]/K4[Fe(CN)6] within the potential range of 0.6 to −0.2 V. The EIS technique was applied using an AC voltage amplitude of 10 mV in 0.1 M KCl containing 5 mM [Fe(CN)6]3−/4− solution in the frequency range of 0.01 Hz to 100 kHz.
The electrochemical behavior of PCM on the bare SPE and ZnFe2O4/SPE was investigated using CV, CA, and DPV measurements. Phosphate buffer electrolyte solution (0.1 M PBS) was adopted as the electrolyte for electrochemical experiments. CV measurement was conducted in the potential range between 0.5 and 1.2 V. CA measurements were done at an applied potential of 0.35 V. For the determination of linear range, the limit of detection, and electrochemical sensitivity for PCM at the ZnFe2O4-modified electrode, the DPV technique was performed in the potential range from 0.6 to 1.2 V at a scan rate of 6 mV s−1 in 0.1 M PBS containing different concentrations of PCM.
2.5. Real samples preparation
Commercial pharmaceutical tablets containing 500 mg of PCM were purchased from a local drug store in Hanoi, Vietnam. Initially, ten pieces of 10 tablets were accurately weighed and finely pulverized, and then 50 mg of the homogenized powder was dissolved in 50 mL 0.1 M PBS (pH 5.0). The obtained solution was stirred for 3 h at room temperature and filtered through Whatman filter paper. The clear supernatant liquid was subsequently collected and diluted with 0.1 M PBS (pH 5.0) to obtain the concentration of PCM in the working range. In order to perform PCM assay in human urine samples, the standard addition method was used. 5 mL of PCM free-human urine sample was obtained from a healthy volunteer (male: 27 years, 72 kg, 173 cm). 5 mL of urine sample was added to 5 mL of a 0.1 M PBS solution (pH 5.0), and then mixed with a vortex mixer. Finally, the known different amounts (50, 200, and 400 μM) of PCM standards were added. The recovery tests were carried out using the DPV technique and the ultimate concentration of PCM in the tablet and human urine samples was calculated from three repeated DPV measurements and the regression equation of the calibration curve.
3. Results and discussion
3.1. Physical characterization
The crystal structure of the ZnFe2O4 sample was characterized by powder X-ray diffraction (XRD) measurement using an EQUINOX 5000 diffractometer with Cu Kα radiation (λ = 0.154056 nm). The XRD, Raman, and field emission scanning electron microscopy (FE-SEM) results are described in Fig. 1. The XRD pattern of the ZnFe2O4 nanomaterials matches well with the single phase cubic spinel structure (JCPDS no. 22-1012), confirming the highly crystalline and single-phase formation of the ZnFe2O4. The three well-defined characteristic Raman peaks of ZnFe2O4 at 350, 495, and 655 cm−1 can be assigned to F2g (2), F2g (3), and A1g modes, respectively. The morphology of the samples was observed by FE-SEM, which revealed that the as-prepared ZnFe2O4 are spherical, well dispersed with particle size in the range of 9–21 nm and an average particle size of 14.2 nm. Full information about the synthetic ZnFe2O4 NPs is reported in our previous paper.31
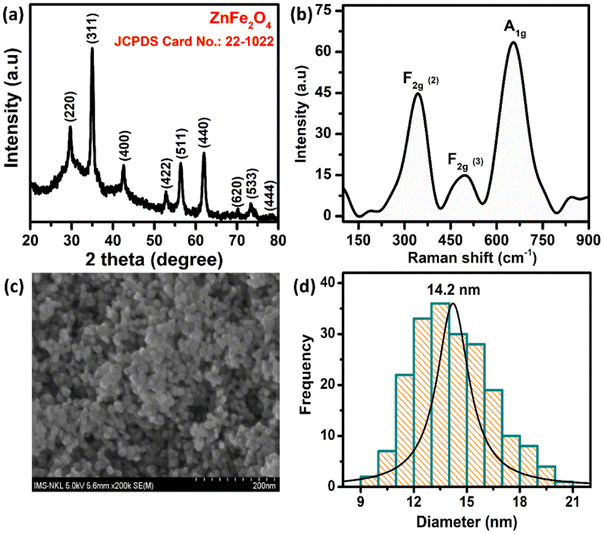 |
| | Fig. 1 (a) XRD pattern, (b) Raman spectrum, (c) the FE-SEM image, and (d) the histogram of particle size distribution of ZnFe2O4 NPs. | |
3.2. Electrochemical characteristics of the unmodified and ZnFe2O4-modified electrodes
The electrochemical activities of the unmodified and ZnFe2O4-modified SPE electrodes were investigated via CV and EIS techniques by using [Fe(CN)6]3−/[Fe(CN)6]4− as the model redox couple. Fig. 2a depicts the CV curves of the bare SPE and ZnFe2O4/SPE in 5 mM [Fe(CN)6]3−/4− containing 0.1 M KCl at a scan rate of 70 mV s−1. There was a pair of well-defined and reversible redox peaks that corresponded to the one-electron transfer process of Fe2+ reversibly into Fe3+. Comparing the oxidation and reduction peak current responses at the bare SPE and ZnFe2O4/SPE, it can be concluded that the modification of the SPE working electrode with ZnFe2O4 NPs can significantly increase the electron transfer rate. Namely, the calculated results show that the oxidation and reduction peak currents of the ZnFe2O4/SPE (234.7 and 258.0 μA) were 1.42 and 1.64 times higher than those of the bare SPE (165.0 and 157.0 μA), respectively (Fig. 2b).
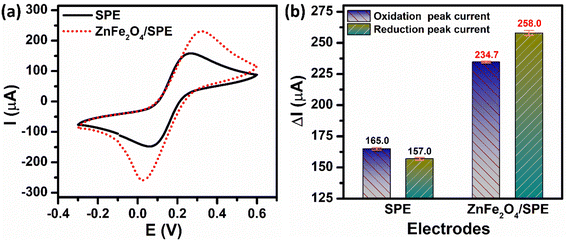 |
| | Fig. 2 (a) CV curves and (b) the bar diagram of the oxidation/reduction peak currents of the ZnFe2O4/SPE in 5 mM [Fe(CN)6]3−/4− solution containing 0.1 M KCl at a scan rate of 70 mV s−1. | |
The improved charge transfer kinetics was further confirmed by the variation in specific surface area, namely, the electrochemically active surface area (ECSA). The ECSA values of the unmodified and ZnFe2O4-modified electrodes were estimated based on the CV technique at different scan rates in 0.1 M KCl containing 5 mM [Fe(CN)6]3−/4− (Fig. S1a and c†) and the Randles–Sevcik equation:35
| | | ΔIp = 2.69 × 10⁵n3/2D1/2ACν1/2 | (1) |
where
Ip (μA) refers to the oxidation/reduction peak current,
n is the number of electrons transferred (
n = 1),
D represents the diffusion coefficient of [Fe(CN)
6]
3−/4− (
D = 6.5 × 10
−6 cm
2 s
−1),
A (cm
2) is the ECSA,
C is the [Fe(CN)
6]
3−/4− solution concentration (
C = 5 mM), and
ν (V s
−1) is the scan rate. As can be seen in Fig. S1b and d,
† the redox current intensity shows a linear correlation with the square root of scan rate at all electrodes, demonstrating a diffusion-controlled electrode process.
31,32 Its linear regression equation was expressed as:
For SPE:
| ΔIpa (μA) = 468.99ν1/2 (V s−1) + 44.80/R2 = 0.985 |
| ΔIpc (μA) = −447.12ν1/2 (V s−1) − 42.34/R2 = 0.986 |
For ZnFe2O4/SPE:
| ΔIpa (μA) = 772.32ν1/2 (V s−1) + 34.87/R2 = 0.993 |
| ΔIpc (μA) = −905.18ν1/2 (V s−1) − 28.20/R2 = 0.980 |
From the obtained slope of the plot of Ip ∼ ν1/2, the ECSA values of the bare SPE and ZnFe2O4/SPE were calculated to be about 0.130 and 0.264 cm2, respectively. The ECSA value of the ZnFe2O4-modified electrode was 2.03 times higher with respect to the bare SPE, suggesting that the ZnFe2O4 NPs not only provide more electrochemically active sites in the redox reaction but also accelerate the electron and mass transport at the electrode/electrolyte interface, and thus substantially increase the overall electrochemical performance.
EIS measurements were also carried out to study the charge-transfer kinetics at the electrode/electrolyte interface and measure the electron transfer resistance (Rct) as well as the heterogeneous electron-transfer rate constant (k0) values. Fig. 3a displays the EIS spectra of the unmodified and ZnFe2O4-modified electrodes in the supporting electrolyte of 0.1 M KCl containing 5 mM [Fe(CN)6]3−/4−. By using the Randles circuit as a fitting model, the Rct values of the bare SPE and ZnFe2O4/SPE were measured to be 891.8 and 105.7 Ω, respectively (Fig. S2†). Furthermore, the heterogeneous electron-transfer rate constant (k0) values of the bare SPE and ZnFe2O4/SPE can be calculated from the obtained ECSA and Rct values using the equation:18
| |  | (2) |
where
R represents gas constant (
R = 8.314 J mol
−1 K
−1),
T stands for thermodynamic temperature (
T = 298.15 K), and
F is the Faraday constant (
F = 96
![[thin space (1/6-em)]](https://www.rsc.org/images/entities/char_2009.gif)
485.33 C mol
−1). According to that, the calculated
k0 values determined for the bare SPE and ZnFe
2O
4/SPE were 4.58 × 10
−7 and 1.88 × 10
−6 cm s
−1, respectively (
Fig. 3b). As expected, the lower
Rct value and the higher
k0 value of the ZnFe
2O
4/SPE as compared to the bare SPE indicate that the ZnFe
2O
4-modified electrode possesses excellent electronic conductivity and rapid electron/mass transport ability between the electrode surface and analyte molecules. On the basis of the CV and EIS measurements as well as the calculated characteristic parameters, thanks to unique features including large specific surface area, abundant active sites, high electrical conductivity, and continuous electron transport at the electrode/electrolyte interface for excellent electrochemical behaviors, the as-synthesized ZnFe
2O
4 nanomaterials enable it to be an ideal sensing platform in constructing high-performance electrochemical sensors.
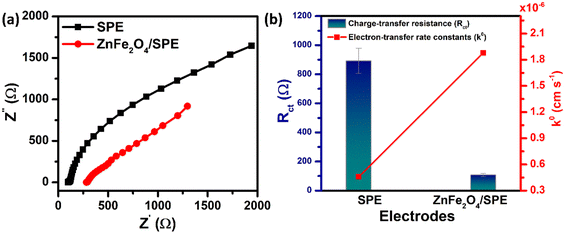 |
| | Fig. 3 (a) EIS plots in 5 mM [Fe(CN)6]3−/4− solution containing 0.1 M KCl for the unmodified and ZnFe2O4-modified SPE; (b) the bar chart diagram of the charge-transfer resistance (Rct) and the heterogeneous electron-transfer rate constant (k0) value of the bare SPE and ZnFe2O4/SPE. | |
3.3. Electrochemical behaviors of PCM at the unmodified and ZnFe2O4-modified electrodes
The electrochemical performance of the unmodified and ZnFe2O4-modified electrodes towards the determination of PCM was investigated by the CV technique in 0.1 M PBS (pH 5.0) containing 50 μM PCM at a scan rate of 70 mV s−1. As shown in Fig. 4a, both the bare SPE and ZnFe2O4/SPE exhibited two couples of well-defined anodic/cathodic peaks of PCM molecules. However, the ZnFe2O4-modified electrode had a considerable effect on the electrochemical activity (Fig. 4b). Namely, for the bare SPE, the cathodic and anodic peak potentials (Epa and Epc) of PCM were observed at 375.1 and 185.3 mV with the oxidation and reduction peak currents (Ipa and Ipc) being calculated to be about 3.08 and 2.24 μA, respectively. Impressively, for the ZnFe2O4/SPE, the Ipa and Ipc values of the PCM redox reaction were 1.61 and 1.75-fold higher than those of the bare SPE (4.96 and 3.91 μA) with the Epa and Epc values being located at 290.2 and 190.3 mV, respectively. The values of peak-to-peak potential separation (ΔEp = |Epa − Epc|) are one of the most important electron transfer kinetic parameters that need to be calculated. According to that, the unmodified SPE has a large ΔEp value of 189.8 mV, illustrating the sluggish electron transferability. The ZnFe2O4-modified electrode displays a decreased in the ΔEp value, which was measured to be about 99.9 mV, indicative of the fast electron-transfer kinetics relative to the bare SPE.
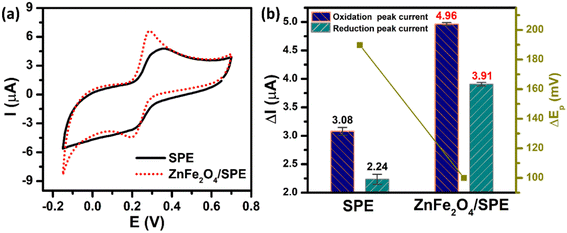 |
| | Fig. 4 (a) CV curves and (b) the bar diagram of redox peak currents of 50 μM PCM in 0.1 M PBS (pH 5.0). The scan rate of CV is 70 mV s−1. | |
The electron transfer coefficient (α) is another kinetic parameter utilized to characterize the electronic properties of an electrode material, and can be calculated by using Laviron's equation:36
| |  | (3) |
| |  | (4) |
where
E0′ is the formal peak potential, which was calculated from the midpoint of cathodic and anodic peak potentials and
R,
T,
n, and
F have their usual meanings. As expected, the
α value of the ZnFe
2O
4/SPE (0.99) was ∼1.55 times higher than that of the bare SPE (0.64), which demonstrates that introducing ZnFe
2O
4 nanomaterials into the electrochemical sensing platform can effectively accelerate the rate of electron transfer on the working electrode.
The electrochemical kinetics of the PCM redox reactions were further clarified by exploring the influence of scan rate on the anodic and cathodic peak currents. Fig. 5a and b demonstrate the CV curves of the bare SPE and ZnFe2O4/SPE at different scan rates from 10 to 70 mV s−1 in 0.1 M PBS (pH 5.0) containing 50 μM PCM. As can be observed at both electrodes, the redox peak currents increased linearly with increasing the square root of scan rate, confirming the PCM redox reaction at the bare SPE and that ZnFe2O4/SPE is a diffusion-controlled process37,38 (Fig. 5c and d).
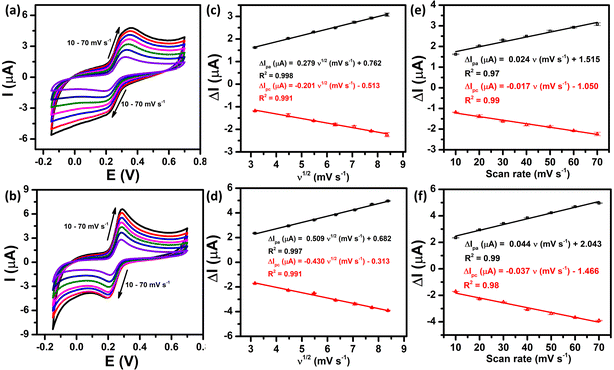 |
| | Fig. 5 CV curves recorded at the bare SPE and ZnFe2O4/SPE in 0.1 M PBS (pH 5.0) containing 50 μM PCM at different scan rates (a) and (b), plots of peak current vs. square root of scan rate (c) and (d), and plots of peak current vs. scan rate (e) and (f), respectively. | |
For SPE:
| ΔIpa (μA) = 0.279ν1/2 (mV s−1) + 0.762/R2 = 0.998 |
| ΔIpc (μA) = −0.201ν1/2 (mV s−1) − 0.513/R2 = 0.991 |
For ZnFe2O4/SPE:
| ΔIpa (μA) = 0.509ν1/2 (mV s−1) + 0.682/R2 = 0.997 |
| ΔIpc (μA) = −0.430ν1/2 (mV s−1) − 0.313/R2 = 0.991 |
Furthermore, there is a good linear relationship between the redox peak currents vs. scan rate, indicating that both the oxidized and reduced forms are confined to the surface, confirming the surface controlled pseudocapacitive behavior39 (Fig. 5e and f).
For SPE:
| ΔIpa (μA) = 0.024ν (mV s−1) + 1.515/R2 = 0.97 |
| ΔIpc (μA) = −0.017ν (mV s−1) − 1.050/R2 = 0.99 |
For ZnFe2O4/SPE:
| ΔIpa (μA) = 0.044ν (mV s−1) + 2.043/R2 = 0.99 |
| ΔIpc (μA) = −0.037ν (mV s−1) − 1.466/R2 = 0.98 |
To sum up, the oxidation/reduction peak currents of PCM showed a good linearity with both the scan rate and the square root of the scan rate. Therefore, it can be concluded that all the electrode reactions have been identified as a combination of diffusion-controlled and surface-controlled pseudocapacitive redox systems. These results are consistent with the redox behavior of PCM in the previous studies.25,40 More interestingly, from the obtained slope values of the plot of Ip ∼ ν, the adsorption capacity (Γ) was measured using the following equation:41
| |  | (5) |
According to that, the adsorption capacities of PCM at the bare SPE and ZnFe2O4/SPE were approximately 3.31 × 10⁻⁸ and 4.37 × 10⁻⁸ mol cm−2, respectively.
Two parameters reflecting the enhancement in the electrocatalytic activity for the redox reaction of PCM at both unmodified and ZnFe2O4-modified electrodes, namely diffusion coefficient (D) and catalytic rate constant (kcat), were evaluated by the CA technique. Fig. 6a and c show the CA results of diverse concentrations of PCM (10, 50, 100, 250, and 500 μM) in 0.1 M PBS (pH 5.0), with the potential being set at 350 mV. As shown in Fig. 6b and d, the anodic current response shows linear dependency upon the negative square root of time (I ∼ ν−1/2) at different PCM concentrations, indicating that the electrocatalytic reaction of PCM is predominantly controlled by diffusion. Consequently, the D values of PCM molecules at the bare SPE and ZnFe2O4/SPE can be determined using the Cottrell equation:42
| | | I = nFAD1/2Cbπ−1/2t−1/2 | (6) |
where
I is the chronoamperometric response (A),
Cb the bulk concentration of PCM (mol cm
−3), and
t is the elapsed time (s). From the slopes of the
I against
ν−1/2 plots, these resultant straight line slopes were plotted
vs. PCM concentration and are shown in the inset of
Fig. 6a and c, which can be expressed as follows:
| For SPE: slope = 0.00258CPCM + 0.3141/R2 = 0.991 |
| For ZnFe2O4/SPE: slope = 0.00358CPCM + 0.1098/R2 = 0.999 |
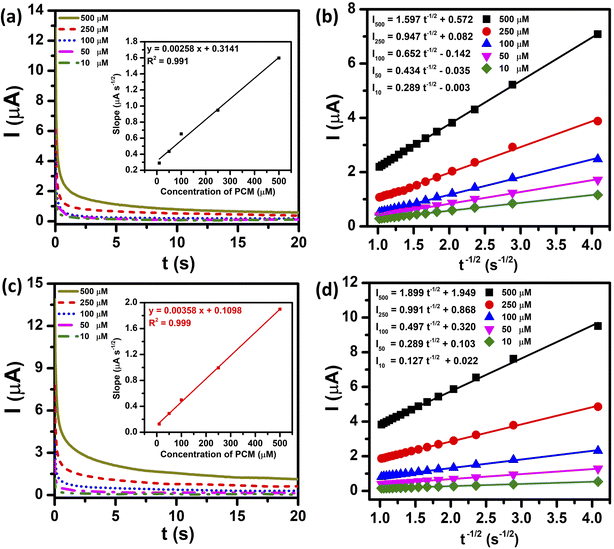 |
| | Fig. 6 Chronoamperograms at the bare SPE and ZnFe2O4/SPE for different concentrations of PCM from 10 to 500 μM in 0.1 M PBS (pH 5.0) (a) and (c) and plot of I vs. t−1/2 obtained from chronoamperograms (b) and (d). Inset shows the plot of slopes of the resulting straight lines against PCM concentration. | |
Consequently, using the Cottrell equation and resultant slopes, the diffusion coefficients of PCM of the bare SPE and ZnFe2O4/SPE were determined to be 7.17 × 10⁻⁸ and 1.01 × 10⁻⁷ cm s−1, respectively.
The CA measurement was also used for the investigation of the electrocatalytic activity of the ZnFe2O4-modified electrode toward the electro-oxidation of PCM. Fig. S3a and c† illustrate the CA curves obtained for the electrochemical oxidation of PCM on the bare SPE and ZnFe2O4/SPE in 0.1 M PBS (pH 5.0) in the absence and presence of 500 μM PCM. The catalytic rate constant (kcat) for the oxidation of PCM is calculated based on the time–current curve and the Galus equation:42
| | | IC/IL = π1/2(kcatCbt)1/2 | (7) |
where
IC and
IL are the catalytic current and diffusion-limited current in the presence and absence of PCM, respectively. As shown in Fig. S3b and d,
† the
IC/
IL value was linearly dependent on the square root of time (
t1/2) with the regression equations being expressed as follows:
| For SPE: IC/IL = −38.29t1/2 + 79.37/R2 = 0.986 |
| For ZnFe2O4/SPE: IC/IL = −45.23t1/2 + 124.70/R2 = 0.986 |
As a result, from the slopes of the IC/IL against t1/2 plot, the kcat value is calculated to be 4.67 × 10⁶ M−1 s−1 for the bare SPE and 6.51 × 10⁶ M−1 s−1 for the ZnFe2O4/SPE.
The characteristic parameters of electrochemical redox reactions of the [Fe(CN)6]3−/4− couple and PCM molecules at the bare SPE and ZnFe2O4/SPE such as ECSA, Rct, k0, ΔEp, α, Γ, and kcat are summarized in Table 1. Taken together, the most striking result to emerge from these data is that the employment of ZnFe2O4 nanomaterials as electrode surface modifiers has direct and significant positive effects on the overall electrochemical performance. The unique features of spinel oxide nanostructures not only endow the ZnFe2O4 with high electroactive surface areas and plentiful accessible active sites, which led to a substantial increase in electrical conductivity and conductive channels for ion/electron transfer but also improve the quantity of adsorption of analyte molecules on the electrode active surface, thereby boosting its overall electrochemical performance. Thus, the ZnFe2O4-modified electrode could be used as a promising sensing platform for high-performance electrochemical sensor construction for ultrasensitive detection of PCM.
Table 1 The characteristic parameters of electrochemical redox reactions of the [Fe(CN)6]3−/4− and PCM using the bare SPE and ZnFe2O4/SPE
| Characteristic parameters |
Electrodes |
| SPE |
ZnFe2O4/SPE |
| The electrochemically active surface area, ECSA (cm2) |
0.130 |
0.264 |
| The charge transfer resistance, Rct (Ω) |
891.8 |
107.5 |
| The heterogeneous electron-transfer rate constants, k0 (cm s−1) |
4.58 × 10⁻⁷ |
1.88 × 10⁻⁶ |
| The peak-to-peak separation, ΔEp (mV) |
189.9 |
99.9 |
| The electron transfer coefficient, α |
0.64 |
0.99 |
| The adsorption capacity, Γ (mol cm−2) |
3.31 × 10⁻⁸ |
4.37 × 10⁻⁸ |
| The catalytic rate constant, kcat (M−1 s−1) |
4.67 × 10⁶ |
6.51 × 10⁶ |
| The diffusion coefficient, D (cm2 s−1) |
7.17 × 10⁻⁸ |
1.01 × 10⁻⁷ |
3.4. Optimization of electrochemical parameters
In order to achieve high electrochemical sensitivity, wide linear range, and low limit of detection for the determination of PCM, the DPV technique was used. Prior to the optimization stage, the DPV oxidation peak current and DPV reduction peak current of PCM need to be compared due to the electrochemical reaction of PCM occurring at the ZnFe2O4-modified electrode being a reversible process. Fig. 7a depicts the DPV behaviors of electrochemical oxidation and reduction of PCM at the ZnFe2O4-modified electrode. The two peaks at 0.36 V and 0.43 V can be attributed to the electro-oxidation and electro-reduction of PCM molecules, respectively. As shown in Fig. 7b, the oxidation peak current of PCM (12.75 μA) was ∼1.53-fold larger than that of the reduction peak current of PCM (8.36 μA). Therefore, the electrochemical oxidation process using the DPV technique was chosen to achieve the highest analytical performance toward the detection of PCM.
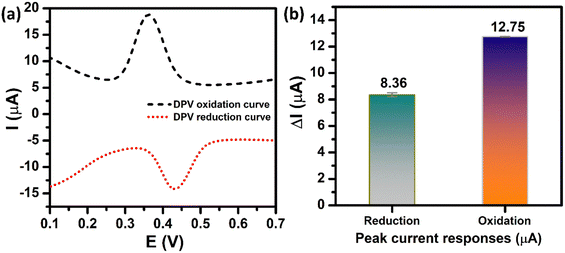 |
| | Fig. 7 (a) DPV oxidation/reduction curves and (b) the bar diagram of the oxidation/reduction peak currents of the ZnFe2O4/SPE in 0.1 M PBS (pH 5.0) containing 250 μM PCM. | |
Effect of pH.
The supporting electrolyte pH is one of the major factors in improving the sensing performance. Fig. 8a shows the DPV curves of the ZnFe2O4/SPE in the presence of 250 μM PCM over the pH range from 2.0 to 9.0. As can be observed, the oxidation peak potentials of PCM shifted to a negative value with the increase of pH, illustrating that electrons and protons are involved in the electrochemical oxidation process of PCM. From the obtained DPV curves, the plots of the peak currents and peak potentials as a function of the pH values were drawn, as shown in Fig. 8b. The oxidation peak currents of PCM gradually increased when the pH value was changed from 2.0 to 5.0, and then decreased gradually when the pH value was over 5.0. Therefore, pH 5.0 (PBS 0.1 M) was chosen as an appropriate electrolyte to obtain the best sensitivity for further electrochemical experiments. Furthermore, the oxidation peak potentials of PCM were directly proportional to the pH values with the linear fitting equation being expressed as Epa (V) = −0.05 pH + 0.587 with R2 = 0.993. The slope of −0.05 V pH−1 was close to the Nernst theoretical value (−0.059 V pH−1), suggesting that the oxidation process of PCM occurred under an equal number of protons and electrons (Fig. 8c). The obtained results further confirmed that the electrochemical oxidation of PCM occurring on the surface of the ZnFe2O4-modified electrode was reversible, similar to the previous reports.20,43
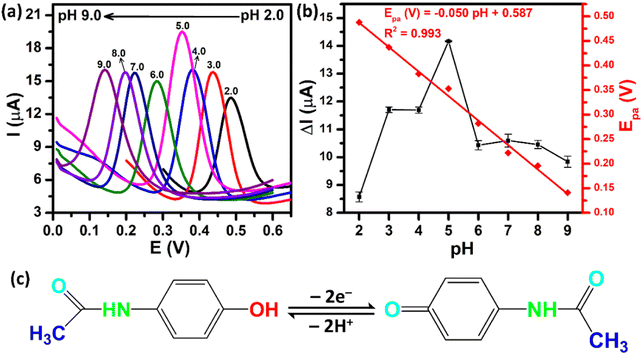 |
| | Fig. 8 (a) DPV curves of 250 μM PCM at ZnFe2O4/SPE with different pH values from 2.0 to 9.0; (b) calibration plots of ΔIpa and Epa against pH values; (c) the electrochemical oxidation mechanism of PCM. | |
Effect of the modified amount and the accumulation time.
The modified amount and the accumulation time are crucial factors in enhancing the analytical performance. The influence of the accumulation time upon the electrochemical signal has been examined in the range from 30 to 180 s (Fig. S4a†). As shown in Fig. S4b,† with the increasing accumulation time from 30 to 150 s, the oxidation peak current of PCM showed a distinct increasing trend. When the accumulation time was further extended, the oxidation peak current of PCM got saturated, implying the maximum adsorption capacity of the PCM on the surface of the ZnFe2O4-modified electrode. Thus, 150 s was selected as the optimal accumulation time for subsequent experiments.
The influence of the ZnFe2O4 modifier (1 mg mL−1) on the electrooxidation of PCM was investigated by varying the modified amount in the range from 2 to 10 μL (Fig. S4c and d†). It can be observed that the oxidation peak current increased gradually as the modified amount was increased from 2 to 8 μL. With further increasing the modified amount, the formation of a thick ZnFe2O4 modifier on the electrode surface may reduce the electrochemically active site area and electrical conductivity of the modified electrode, leading to a decrease in the peak current. Consequently, an optimal modified amount of 8 μL was selected in the following electrochemical experiments.
3.5. Electrochemical determination of PCM at the ZnFe2O4-modified SPE electrodes
The electrochemical sensing performance of the proposed ZnFe2O4-modified electrode towards the PCM detection was evaluated by the DPV technique under the optimized conditions. Fig. 9a shows the DPV curves of different concentrations of PCM ranging from 0.5 to 500 μM. As expected, the oxidation peak current of PCM increased with the rising concentrations in the range of 0.5–400 μM. The resulting calibration plots exhibited a good linear relationship between the oxidation peak currents and concentrations of PCM, which can be expressed as ΔIpa (μA) = 0.056 CPCM (μM) + 0.349 with R2 = 0.998. The limit of detection (LOD) of the proposed electrochemical sensor was determined to be 0.29 μM, using the standard formula: LOD = 3SD/S (where SD is the standard deviation of 10 blank samples and S is the slope value). Furthermore, from the obtained slope value, the electrochemical sensitivity of the ZnFe2O4-based electrochemical sensor was calculated to be 1.1 μA μM−1 cm−2. The analytical parameters of the ZnFe2O4-based electrochemical sensor for the detection of PCM are compared with those reported in the recent literature (Tables S1 and S2†). These outcomes indicate that the proposed ZnFe2O4-based electrochemical sensor exhibited an excellent performance towards the electro-oxidation of PCM with high electrochemical sensitivity, comparatively low limit of detection, and wide linear response ranges.
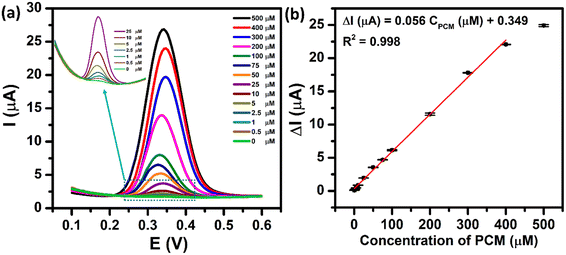 |
| | Fig. 9 (a) DPV curves of 0–500 μM PCM in 0.1 M PBS (pH 5.0) at the ZnFe2O4/SPE and (b) the calibration plots of oxidation peak current responses vs. various concentrations of PCM with error bars. | |
3.6. Repeatability, anti-interference ability, and real sample analysis
The repeatability of the proposed electrochemical sensor was evaluated by conducting 10 consecutive DPV measurements in 0.1 M PBS (pH 5.0) containing 250 μM PCM (Fig. S5†). As shown in Fig. S5a,† the oxidation responses of PCM showed a negligible change after 10 repeated operations using the ZnFe2O4-modified electrode under the sample condition. The relative standard deviation (RSD) value was calculated to be 0.76%, indicative of excellent repeatability (Fig. S5b†).
The anti-interference ability was also investigated by adding 20-fold concentration of possible interfering ions (K+, Na+, Cu2+, Zn2+, and Fe3+), organic compounds (4-nitrophenol, ascorbic acid, and glucose), and antibiotics (azithromycin, erythromycin, ofloxacin, furazolidone, and chloramphenicol) to a 250 μM PCM (Fig. S6†). The obtained and calculated results manifest that these potential interferences did not cause significant changes in the electro-oxidation of PCM, indicating a good anti-interfering ability during the PCM electro-oxidation of the proposed ZnFe2O4-based electrochemical sensor for the detection of PCM.
The feasibility of the proposed ZnFe2O4-modified electrode for the practical application was studied with the electrochemical measurement of PCM in the commercial pharmaceutical product and human urine samples. The ultimate concentration of PCM in tablet and urine samples was calculated from three repeated DPV measurements and the regression equation of the calibration curve. The results are shown in Table 2. The proposed electrochemical sensor exhibited an excellent recovery range from 96.3 to 110.9%, with the RSD values below 2.9%, demonstrating that the electrochemical sensing platform based on the ZnFe2O4 NPs can be used as a reliable and feasible method for quantitative analysis of PCM in pharmaceutical formulations and urine samples.
Table 2 Electrochemical detection of PCM in the commercial pharmaceutical tablet and human urine samples using the ZnFe2O4-modified electrode
| Sample |
Labeled values (μM) |
Found valuesa (μM) |
Recovery (%) |
RSD (%) |
|
Each sample was assayed in triplicate (n = 3).
|
| Pharmaceutical |
400 |
411.1 |
102.8 |
0.9 |
| 200 |
192.9 |
96.3 |
1.1 |
| 100 |
100.9 |
97.7 |
0.7 |
| 50 |
50.6 |
101.2 |
2.9 |
| 25 |
26.6 |
106.2 |
0.6 |
| Urine |
400 |
390.5 |
97.6 |
0.2 |
| 200 |
199.3 |
99.7 |
2.2 |
| 50 |
55.5 |
110.9 |
0.7 |
4. Conclusions
In summary, the highly crystalline and single-phase spinel ZnFe2O4 NPs were successfully synthesized by a facile hydrothermal method and utilized as an electrode material for the construction of an electrochemical sensor for the detection of PCM. A series of electrochemical techniques (CV, EIS, CA, and DPV) along with the calculated electrochemical kinetic parameters (ECSA, Rct, k0, ΔEp, α, Γ, kcat, and D) showed that the modification of the SPE working surface with ZnFe2O4 NPs comprehensively improved the analytical performance toward the PCM detection as compared to the bare SPE. Benefiting from the plenty of active sites and large specific surface area for electrochemical reaction, the ZnFe2O4-modified electrode shows superior electron transfer capability, good electrocatalytic activity, and large adsorption/diffusion capacity for the electro-oxidation of PCM. As a result, the ZnFe2O4/SPE shows excellent sensing performance in electrochemical detection of PCM with very low LOD, ultra-wide working range, high electrochemical sensitivity, good anti-interference ability, and satisfactory repeatability. Moreover, the practical applicability of the proposed electrochemical sensor was established with admirable recovery results in the determination of PCM in pharmaceutical tablets and human urine samples.
Author contributions
N. T. Anh: methodology, validation, investigation, writing-original draft; M. T. Le: funding acquisition, conceptualization, methodology, formal analysis; L. K. Vinh: validation, investigation; N. V. Quy: validation, formal analysis; O. V. Hoang: validation, investigation; N. X. Dinh: conceptualization, methodology, supervision, formal analysis, writing-review & editing; L. A. Tuan: conceptualization, methodology, supervision, project administration, writing-review & editing.
Conflicts of interest
The authors declare that they have no known competing financial interests or personal relationships that could have appeared to influence the work reported in this paper.
Acknowledgements
This research was supported by the Vietnam National Foundation for Science and Technology Development (NAFOSTED) through a fundamental research project (103.02-2020.68). The authors would like to acknowledge the support with Raman, electrochemical & UV-Vis measurements from NEB Lab (Phenikaa University) and SEM and XRD from GUST-VAST and ITIMS-HUST.
References
- M. E. Bosch, A. J. R. Sánchez, F. S. Rojas and C. B. Ojeda, J. Pharm. Biomed. Anal., 2006, 42, 291–321 CrossRef CAS.
- R. N. Goyal, V. K. Gupta, M. Oyama and N. Bachheti, Electrochem. Commun., 2005, 7, 803–807 CrossRef CAS.
- M. Boopathi, M.-S. Won and Y.-B. Shim, Anal. Chim. Acta, 2004, 512, 191–197 CrossRef CAS.
- R. T. Kachoosangi, G. G. Wildgoose and R. G. Compton, Anal. Chim. Acta, 2008, 618, 54–60 CrossRef CAS PubMed.
- K. V Blake, D. Bailey, G. M. Zientek and L. Hendeles, Clin. Pharm., 1988, 7, 391–397 Search PubMed.
- K. J. Heard, N. Engl. J. Med., 2008, 359, 285–292 CrossRef CAS PubMed.
- Y. Fan, J.-H. Liu, H.-T. Lu and Q. Zhang, Colloids Surf., B, 2011, 85, 289–292 CrossRef CAS PubMed.
- A. R. Khaskheli, A. Shah, M. I. Bhanger, A. Niaz and S. Mahesar, Spectrochim. Acta, Part A, 2007, 68, 747–751 CrossRef PubMed.
- A. W. Abu-Qare and M. B. Abou-Donia, J. Pharm. Biomed. Anal., 2001, 26, 939–947 CrossRef CAS PubMed.
- K. G. Kumar and R. Letha, J. Pharm. Biomed. Anal., 1997, 15, 1725–1728 CrossRef CAS PubMed.
- J. Vilchez, R. Blanc, R. Avidad and A. Navalón, J. Pharm. Biomed. Anal., 1995, 13, 1119–1125 CrossRef CAS PubMed.
- A. Trettin, A. A. Zoerner, A. Böhmer, F.-M. Gutzki, D. O. Stichtenoth, J. Jordan and D. Tsikas, J. Chromatogr. B, 2011, 879, 2274–2280 CrossRef CAS.
- A. Kunkel, S. Günter and H. Wätzig, Electrophoresis, 1997, 18, 1882–1889 CrossRef CAS PubMed.
- A. Kutluay and M. Aslanoglu, Anal. Chim. Acta, 2014, 839, 59–66 CrossRef CAS.
- K. Asadpour-Zeynali and R. Amini, Electroanalysis, 2017, 29, 635–642 CrossRef CAS.
- N. T. Anh, N. X. Dinh, T. N. Pham, L. K. Vinh, L. M. Tung and A.-T. Le, RSC Adv., 2021, 11, 30544–30559 RSC.
- E. Bakker and M. Telting-Diaz, Anal. Chem., 2002, 74, 2781–2800 CrossRef CAS PubMed.
- N. T. Anh, N. X. Dinh, N. N. Huyen, P. T. L. Huong, V. N. Phan, P. D. Thang, H. Van Tuan, T. Van Tan and A.-T. Le, J. Electrochem. Soc., 2023, 170, 17510 CrossRef CAS.
- R. M. Hanabaratti, S. M. Tuwar, S. T. Nandibewoor and J. I. Gowda, Chem. Data Collect., 2020, 30, 100540 CrossRef CAS.
- J. I. Gowda, D. G. Gunjiganvi, N. B. Sunagar, M. N. Bhat and S. T. Nandibewoor, RSC Adv., 2015, 5, 49045–49053 RSC.
- E. Nagles, M. Ceroni, J. J. Hurtado-Murillo and J. J. Hurtado, Anal. Methods, 2020, 12, 2608–2613 RSC.
- C. Zhu, G. Yang, H. Li, D. Du and Y. Lin, Anal. Chem., 2015, 87, 230–249 CrossRef CAS.
- H. Karimi-Maleh, F. Karimi, M. Alizadeh and A. L. Sanati, Chem. Rec., 2020, 20, 682–692 CrossRef CAS PubMed.
- N. Wongkaew, M. Simsek, C. Griesche and A.
J. Baeumner, Chem. Rev., 2018, 119, 120–194 CrossRef PubMed.
- N. T. Anh, N. X. Dinh, N. N. Huyen, P. T. L. Huong, V. N. Phan, P. D. Thang, H. Van Tuan, T. Van Tan, J. Lee and A.-T. Le, J. Electrochem. Soc., 2023, 170, 77506 CrossRef.
- T. N. Pham, T. Q. Huy and A.-T. Le, RSC Adv., 2020, 10, 31622–31661 RSC.
- J. M. Gonçalves, D. P. Rocha, M. N. T. Silva, P. R. Martins, E. Nossol, L. Angnes, C. S. Rout and R. A. A. Munoz, J. Mater. Chem. C, 2021, 9, 7852–7887 RSC.
- J. M. Gonçalves, L. V de Faria, A. B. Nascimento, R. L. Germscheidt, S. Patra, L. P. Hernández-Saravia, J. A. Bonacin, R. A. A. Munoz and L. Angnes, Anal. Chim. Acta, 2022, 1233, 340362 CrossRef.
- J. N. Baby, B. Sriram, S.-F. Wang and M. George, Chem. Eng. J., 2022, 435, 134136 CrossRef CAS.
- T. N. Pham, N. Van Cuong, N. X. Dinh, H. Van Tuan, V. N. Phan, N. T. Lan, M. H. Nam, T. D. Thanh, V. D. Lam and N. Van Quy, J. Electrochem. Soc., 2021, 168, 26506 CrossRef CAS.
- N. N. Huyen, N. T. Anh, T. L. H. Phung, N. X. Dinh, N. T. Vinh, T. T. Loan, D. L. Vu and A.-T. Le, J. Electrochem. Soc., 2022, 169, 106517 CrossRef CAS.
- N. T. Anh, N. N. Huyen, N. X. Dinh, N. T. Vinh, N. Van Quy, V. D. Lam and A.-T. Le, New J. Chem., 2022, 46, 7090–7102 RSC.
- N. N. Huyen, L. M. Tung, T. A. Nguyen, T. L. Huong Phung, P. D. Thang, N. T. Vinh, Q. Van Nguyen, T. K. Oanh Vu, V. D. Lam, V. K. Le, N. X. Dinh and A.-T. Le, J. Phys. Chem. C, 2023, 127, 12262–12275 CrossRef CAS.
- T. N. Pham, N. Q. Hoa, T. L. Nguyen, P. D. Thang, P. T. N. Trinh, D. T. N. Thanh and A.-T. Le, RSC Adv., 2023, 13, 10577–10591 RSC.
-
A. J. Bard, L. R. Faulkner and H. S. White, Electrochemical methods: fundamentals and applications, John Wiley & Sons, 2022 Search PubMed.
- E. J. J. Laviron, J. Electroanal. Chem. Interfacial Electrochem., 1979, 101, 19–28 CrossRef CAS.
- J. I. Gowda, R. M. Hanabaratti and S. S. Hipparagi, Results Chem., 2023, 5, 100801 CrossRef CAS.
- R. Wang, C. V. Reddy, A. Nagar, S. Basu, N. P. Shetti, B. Cheolho, J. Shim and R. R. Kakarla, Chemosphere, 2023, 341, 139955 CrossRef CAS.
- V. Augustyn, P. Simon and B. Dunn, Energy Environ. Sci., 2014, 7, 1597–1614 RSC.
- A. Sarkar and G. G. Khan, Mater. Today Proc., 2018, 5, 10177–10184 CrossRef CAS.
- E. Laviron, J. Electroanal. Chem. Interfacial Electrochem., 1974, 52, 355–393 CrossRef CAS.
-
A. J. Bard, L. R. Faulkner and H. S. White, Electrochemical methods: fundamentals and applications, John Wiley & Sons, 2022 Search PubMed.
- M. Li and L. Jing, Electrochim. Acta, 2007, 52, 3250–3257 CrossRef CAS.
|
| This journal is © The Royal Society of Chemistry 2024 |
Click here to see how this site uses Cookies. View our privacy policy here.  Open Access Article
 *a,
Le Minh
Tung‡
*c,
Le Khanh
Vinh
d,
Nguyen
Van Quy
e,
Ong
Van Hoang
af,
Ngo Xuan
Dinh
 a and
Anh-Tuan
Le
 *ab
*ab
![[thin space (1/6-em)]](https://www.rsc.org/images/entities/char_2009.gif) :
:![[thin space (1/6-em)]](https://www.rsc.org/images/entities/char_2009.gif) 2 were added into 80 mL of a DI water/ethylene glycol mixture (1
2 were added into 80 mL of a DI water/ethylene glycol mixture (1![[thin space (1/6-em)]](https://www.rsc.org/images/entities/char_2009.gif) :
:![[thin space (1/6-em)]](https://www.rsc.org/images/entities/char_2009.gif) 1 volumetric ratio). Afterward, 2 M aqueous NaOH solution was added dropwise to the above homogeneous mixture to form a dark red precipitate. After stirring for 10 minutes, the obtained solution was sealed in a Teflon-lined stainless-steel autoclave and reacted at 180 °C for 12 h. After being cooled naturally to room temperature, the obtained product was harvested by centrifugation and washed with ethanol and DI water before drying at 60 °C for 24 h. Finally, the ZnFe2O4 NPs were produced by calcining the powder at 500 °C for 5 h in air.
1 volumetric ratio). Afterward, 2 M aqueous NaOH solution was added dropwise to the above homogeneous mixture to form a dark red precipitate. After stirring for 10 minutes, the obtained solution was sealed in a Teflon-lined stainless-steel autoclave and reacted at 180 °C for 12 h. After being cooled naturally to room temperature, the obtained product was harvested by centrifugation and washed with ethanol and DI water before drying at 60 °C for 24 h. Finally, the ZnFe2O4 NPs were produced by calcining the powder at 500 °C for 5 h in air.


![[thin space (1/6-em)]](https://www.rsc.org/images/entities/char_2009.gif) 485.33 C mol−1). According to that, the calculated k0 values determined for the bare SPE and ZnFe2O4/SPE were 4.58 × 10⁻⁷ and 1.88 × 10⁻⁶ cm s−1, respectively (Fig. 3b). As expected, the lower Rct value and the higher k0 value of the ZnFe2O4/SPE as compared to the bare SPE indicate that the ZnFe2O4-modified electrode possesses excellent electronic conductivity and rapid electron/mass transport ability between the electrode surface and analyte molecules. On the basis of the CV and EIS measurements as well as the calculated characteristic parameters, thanks to unique features including large specific surface area, abundant active sites, high electrical conductivity, and continuous electron transport at the electrode/electrolyte interface for excellent electrochemical behaviors, the as-synthesized ZnFe2O4 nanomaterials enable it to be an ideal sensing platform in constructing high-performance electrochemical sensors.
485.33 C mol−1). According to that, the calculated k0 values determined for the bare SPE and ZnFe2O4/SPE were 4.58 × 10⁻⁷ and 1.88 × 10⁻⁶ cm s−1, respectively (Fig. 3b). As expected, the lower Rct value and the higher k0 value of the ZnFe2O4/SPE as compared to the bare SPE indicate that the ZnFe2O4-modified electrode possesses excellent electronic conductivity and rapid electron/mass transport ability between the electrode surface and analyte molecules. On the basis of the CV and EIS measurements as well as the calculated characteristic parameters, thanks to unique features including large specific surface area, abundant active sites, high electrical conductivity, and continuous electron transport at the electrode/electrolyte interface for excellent electrochemical behaviors, the as-synthesized ZnFe2O4 nanomaterials enable it to be an ideal sensing platform in constructing high-performance electrochemical sensors.


