 Open Access Article
Creative Commons Attribution 3.0 Unported Licence
Spike trains in PANI-proteinoid nanomaterials with different light pulse rates
Panagiotis
Mougkogiannis
 * and
Andrew
Adamatzky
Unconventional Computing Lab, University of the West of England, Frenchay Campus, Bristol BS16 1QY, UK. E-mail: Panagiotis.Mougkogiannis@uwe.ac.uk
First published on 6th June 2024
Abstract
Bio-inspired computing emulates the brain's information processing power in artificial architectures. We investigate the modification of emergent spike train dynamics in hybrid networks of polyaniline (PANI) nanomaterials hybridised with proteinoids under different optical stimulation frequencies. Hierarchical clustering of photoelectrochemical response data categorises activity patterns for 1 Hz, 5 Hz, and 20 Hz pulsed yellow light inputs. Importantly, the driving frequency controls nanofiber excitability and temporal coordination, with 1 Hz causing erratic spike bursts, 5 Hz rhythmic oscillations, and 20 Hz fast but unsustained responses. Raster plots and peristimulus time histograms show a development from stochastic to deterministic to complicated nonlinear dynamics like neuromorphic systems. Modelling the network as a forest-fire automaton quantifies spatiotemporal activity propagation, where illumination frequency modulates node ignition and recovery probability, shaping spike clusters and coherence. Photonic stimulation can modify information encoding regimes in these PANI-proteinoid composites, suggesting they can be synthetic neural networks. Our findings provide insights for constructing adaptive, brain-inspired computer systems by showing extrinsic control over the network's self-organized dynamics. The ability to delicately tune nanofiber excitation–relaxation cycles using optical pulse trains creates a prototype for biophysically-motivated perception, learning, and cognitive models in empirically accessible material frameworks.
1. Introduction
The remarkable ability of the human brain to process and adapt to complex, dynamic environment has led to the development of neuromorphic systems that try to replicate its computational principles.1,2 Tanaka (2019)3 and Kendall (2020)4 propose brain-inspired techniques that overcome the limits of standard von Neumann designs by using the intrinsic dynamics and self-organisation of physical substrates. Conducting polymer nanomaterials based on polyaniline (PANI) are a potential material for realising neuromorphic capacities.5PANI nanomaterials have attracted interest due to their distinctive electrical and optical properties, which originate from their conjugated backbone and redox-active nature.6,7 PANI nanomaterials enhance biocompatibility and self-assembly when coupled with biomolecules such as proteins or peptides.8–10 Polyaniline (PANI) is a promising material for biosensing applications because of its distinctive characteristics, including high conductivity, biocompatibility, and ease of synthesis. Karimi and colleagues11 developed a selective biosensor for detecting human cardiac troponin T (cTnT) by integrating molecularly imprinted polyaniline (MIP) with reduced graphene oxide (rGO). In another study, Asmatulu and colleagues12 developed an electrochemical nanobiosensor to detect cyclooxygenase-2 (COX-2) in human serum samples and phosphate-buffered saline (PBS) by using polyaniline nanomaterials. COX-2 is an enzyme that is essential in the process of inflammation and is frequently linked to different diseases, such as cancer. The biosensor was created by altering the electrode's surface with polyaniline nanomaterials, enhancing its surface area and conductivity to facilitate electron transport effectively.
Polyaniline (PANI) is used in tissue engineering and regenerative medicine, in addition to biosensing. An example of this is when developing conductive biomaterials to improve nerve regeneration. In the human body, barriers and cell membranes establish ionic barriers leading to the appearance of an electrical potential gradient across their surface. This gradient promotes nerve growth towards the outer regions, which is crucial for the normal functioning of the nervous system. Researchers have investigated the use of conductive biomaterials like polypyrrole (PPy) and polyaniline (PANI) to promote neurite extension with minimal electrical stimulation.13 By integrating PANI into scaffolds or substrates, researchers have shown enhanced neurite outgrowth and alignment, which could lead to more efficient nerve regeneration techniques.14
Unconventional computing applications of polyaniline (PANI) are substantially evidenced in prototypes of organic electronic materials15 and functioning processors,16,17 include perceptron,18,19 memristors,20 neuromorphic circuits.21–23 These materials are attractive for future cybernetic systems because they are highly parallel processing devices with fault-tolerance and self-healing. Anisotropic colloidal suspensions of conductive polymer nanorods, especially PANI nanorods (NRs), are attractive for computer subsystems in these applications because they respond well to electrical fields. Recent research has investigated designing learning processes in PANI NR colloids for future cybernetic systems.24 AC electrical stimulation can create programmed conductive paths to different states for learning. Due to AC field effects on hydrogen bonds stabilising dispersions in the fluid and charge orientation in polymeric chains, colloid resistance anisotropy can be repetitive coded in binary logic. Modifying PANI NRs’ molecular structure changes their conductivity.24
Proteinoids, also known as thermal proteins, play a crucial role in the formation of complex structures in PANI-proteinoid nanomaterials. These proteinoids are synthesized through a simple thermal condensation reaction, where amino acids are heated to their melting point (160–200 °C) in an inert atmosphere, initiating polymerization and creating polymeric chains.25,26 The resulting proteinoids can form hollow microspheres when swollen in an aqueous solution at moderate temperatures (around 50 °C).26 These proteinoid microspheres exhibit electrical properties reminiscent of biological neurons, such as steady-state membrane potentials, oscillations, and action potentials.27,28
The integration of proteinoids with polyaniline (PANI) nanomaterials introduces a new level of complexity and functionality to the system. The proteinoid microspheres can act as interconnected nodes within the PANI nanofiber network, facilitating the emergence of complex electrical dynamics and signal propagation. By harnessing the unique properties of proteinoids, such as their programmable size, stability, and long-lasting oscillatory behaviour,26,29,30 PANI-proteinoid nanomaterials offer a promising platform for developing bio-inspired neuromorphic systems capable of processing and transmitting information in a manner analogous to biological neural networks.
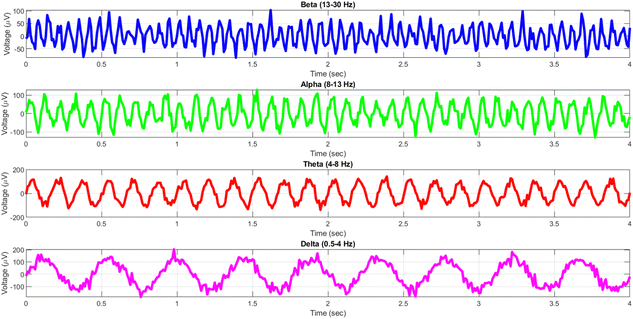
The human brain displays a diverse array of rhythmic activity, commonly known as “brain waves,” that may be recorded using electroencephalography (EEG) recordings. These waves are a result of the coordination of several neurons and are linked to different functioning states of the brain.31Fig. 1 demonstrates that EEG rhythms cover many frequency ranges, such as delta (0.5–4 Hz), theta (4–8 Hz), alpha (8–13 Hz), beta (13–30 Hz), and gamma (30–100 Hz) waves.32 Each frequency range has been associated with distinct cognitive functions, including as relaxation, drowsiness, attentiveness, and short-term memory.33
Remarkably, the spiking dynamics observed in PANI-proteinoid nanomaterials exhibit similarities to the oscillatory patterns reported in the brain. By varying the frequency of the optical pulses that are used to activate the nanomaterials, we can precisely control the patterns of electrical impulses created by these neuromorphic materials. The capacity to adjust the spiking behaviour of PANI-proteinoid nanomaterials presents intriguing prospects for simulating brain-like information processing and creating innovative neuromorphic computing platforms.34
In this paper, we investigate how different optical pulse frequencies affect the spiking dynamics of PANI-proteinoid nanomaterials. We show that specific temporal patterns of light stimulation can entrain and control the electrical activity of these nanomaterials. Our findings demonstrate the potential of optically-stimulated PANI-proteinoid nanomaterials as programmable, neuromorphic components for brain-inspired computing. The capacity to alter spike trains with light opens up new opportunities in adaptive sensing, bioelectronic interfaces, and neuromorphic robotics. Furthermore, our findings contribute to a better understanding of emergent dynamics in complex, nanoscale systems, as well as its application to biological information processing.
The remaining part of the paper is structured as follows: Section 2 goes over the fabrication and characterization of PANI-proteinoid nanomaterials, as well as the experimental setup for optical stimulation. Section 3 summarises the findings of our experiments, emphasising the frequency-dependent regulation of spiking activity. In Section 4, we analyse the implications of our findings and present a theoretical model to explain the observed behaviours. Finally, Section 5 summarises the article and discusses future research directions.
2. Methods and materials
2.1. Materials
Sigma Aldrich supplied aniline (d = 1.022 g mol−1, M = 93.13 g mol−1, CAS-No: 62-53-3, ACS reagent >99.5%), p-toluenesulfonic acid monohydrate (CAS-No 6192-52-5, ACS reagent >98.5%), and ammonium persulfate (d = 1.980 g cm−3, M = 228.20 g mol−1, CAS: 7727-54-0, ACS reagent >98.0%). Merck KGaA supplied 1 mol l−1 of hydrochloric acid at 1 N. All compounds were utilised as obtained, without further purification. L-Phenylalanine, L-aspartic acid, and L-glutamic acid were purchased from Sigma Aldrich with a purity level exceeding 98%. These amino acids were used as the building blocks for the synthesis of proteinoids. 1-Methyl-2-pyrrolidinone, with a purity greater than 98%, was purchased from Sigma-Aldrich.2.2. Synthesis of PANI nanotubes-nanospheres
PANI nanotubes-nanospheres have been made using the chemical oxidative polymerization of aniline using ammonium persulfate as the oxidant and p-toluenesulfonic acid monohydrate as the dopant. A standard procedure involved combining 5 ml of aniline with ammonium persulfate and p-toluenesulfonic acid monohydrate in a molar ratio of 1![[thin space (1/6-em)]](https://www.rsc.org/images/entities/char_2009.gif) :
:![[thin space (1/6-em)]](https://www.rsc.org/images/entities/char_2009.gif) 1
1![[thin space (1/6-em)]](https://www.rsc.org/images/entities/char_2009.gif) :
:![[thin space (1/6-em)]](https://www.rsc.org/images/entities/char_2009.gif) 0.5. The solution was agitated at ambient temperature for a duration of 60 minutes to ensure full dissolution and homogeneity. After stirring, the mixture was stored at −8 °C for three days to allow the polymerization reaction to proceed slowly and facilitate the formation of nanotubes and nanospheres. The low temperature helps to control the growth rate and morphology of the PANI nanostructures. After the polymerization process, the resulting dark green solid was obtained by filtering and then subjected to multiple washing with deionized water and ethanol to remove any remaining unreacted monomers and contaminants. The PANI nanotubes-nanospheres were subsequently subjected to a drying process in a vacuum oven at a temperature of 30 °C for a duration of 24 hours.
0.5. The solution was agitated at ambient temperature for a duration of 60 minutes to ensure full dissolution and homogeneity. After stirring, the mixture was stored at −8 °C for three days to allow the polymerization reaction to proceed slowly and facilitate the formation of nanotubes and nanospheres. The low temperature helps to control the growth rate and morphology of the PANI nanostructures. After the polymerization process, the resulting dark green solid was obtained by filtering and then subjected to multiple washing with deionized water and ethanol to remove any remaining unreacted monomers and contaminants. The PANI nanotubes-nanospheres were subsequently subjected to a drying process in a vacuum oven at a temperature of 30 °C for a duration of 24 hours.
2.3. Synthesis of proteinoids microspheres
Proteinoids were synthesized following the thermal polycondensation approach developed by Mougkogiannis et al.35 The synthesis procedure involved the following steps:(1) A mixture consisting of 5 gr of L-phenylalanine, L-aspartic acid, and L-glutamic acid was prepared.
(2) The amino acid mixtures were placed in a reaction vessel (100 ml) and subjected to heating at 180 °C under reflux.
(3) The thermal polycondensation reaction was allowed to proceed for 180 minutes.
(4) The obtained proteinoids were then added to an aqueous solution and stirred for three hours at 80 degrees celsius.
(5) The proteinoids were then lyophilized (freeze-dried) to remove any residual moisture and obtain a dry powder.
(6) The lyophilized proteinoids were stored at room temperature for further characterization and use.
2.4. Synthesis of PANI-proteinoid suspension
In order to prepare the PANI-proteinoid suspension, the PANI that was synthesised was initially dissolved in 1-methyl-2-pyrrolidinone (NMP) to form a solution with a concentration of 1 mg l−1. The selection of NMP as the solvent was based on its capacity to efficiently dissolve PANI and its compatibility with the proteinoid solution. The lyophilized proteinoids were dissolved in deionized water in a separate container, resulting in the formation of a proteinoid-water solution. The proteinoid solution's concentration was modified according to the required ratio of PANI to proteinoids in the resulting suspension. Subsequently, the PANI-NMP solution was gradually added into the proteinoid-water solution while maintaining a constant stirring rate. The mixing took place at ambient temperature to ensure a uniform dispersion of PANI throughout the proteinoid solution.2.5. Characterisation techniques
The scanning electron microscopy (SEM) and Fourier-transform infrared spectroscopy (FT-IR) techniques were used to analyse the morphological and structural characteristics of the PANI nanotubes-nanospheres that were synthesised.2.6. Electrical measurements
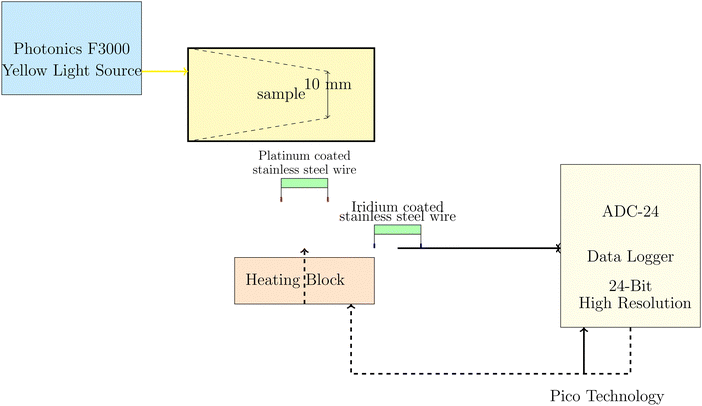
The electrochemical measurements of PANI-proteinoid samples under visible light illumination were performed using a Photonics F3000 system that had LED light sources from World Precision Instruments (Fig. 2). The specimens were subjected to yellow light with a wavelength of 590 nm, specifically identified as Part No: 593-30-003. The LEDs produce light with narrow band spectra, which have bandwidths that vary between 25 and 35 nm. The light intensity was varied from 20% to 100% of the maximum power density, which was fixed at 30 mW cm−2 for the unfiltered daylight LED. The choice of yellow light as the stimulation source for the PANI-proteinoid nanomaterials was based on several factors. Firstly, polyaniline (PANI) exhibits a strong absorbance peak in the yellow-green region of the visible spectrum, typically around 550–600 nm.36–38 This absorption peak is attributed to the π–π* transition of the quinoid rings in the emeraldine salt form of PANI.39 By selecting yellow light, which falls within this absorption range, we aimed to maximize the optical response of PANI in the composite material. Furthermore, previous studies have demonstrated that PANI-based materials exhibit significant photoconductivity and electrical responsiveness when exposed to yellow light.38,40 The increased conductivity and charge carrier generation in PANI upon yellow light illumination have been attributed to the photoinduced electron transfer from the highest occupied molecular orbital (HOMO) to the lowest unoccupied molecular orbital (LUMO) of the polymer.40 While PANI can respond to other wavelengths in the visible spectrum, such as blue and green light, the response is generally less pronounced compared to yellow light.37 This is due to the lower absorption coefficients of PANI at shorter wavelengths and the less efficient photoinduced charge separation processes.38The Photonics F3000 system was used to produce a yellow light source with a wavelength of 590 nm, as shown in Fig. 2. This light source was used to illuminate the PANI-proteinoid samples. Light was focused onto the sample, and needle electrodes composed of platinum–iridium coated stainless steel wires were positioned 10 mm apart within the PANI-proteinoid composite to record the voltage responses in space and time. The electrodes were linked to a high-precision 24-bit ADC data logger (Pico Technology) to capture the signals. The data logger was synchronised with a heating block to facilitate concurrent monitoring of thermal and electrical parameters. The system demonstrated a remarkable level of sensitivity, enabling it to detect even the smallest changes in voltage within the microvolt range.
The measurements yield significant information on the photosensitivity and optoelectronic characteristics of PANI-proteinoid composites. The capacity to regulate the electrical characteristics of these substances by means of precise light wavelengths and intensities presents opportunities for their usage in many domains, including photosensors, optoelectronic devices, and light-responsive systems.
3. Results
3.1. Morphology of self-assembled polyaniline-proteinoids
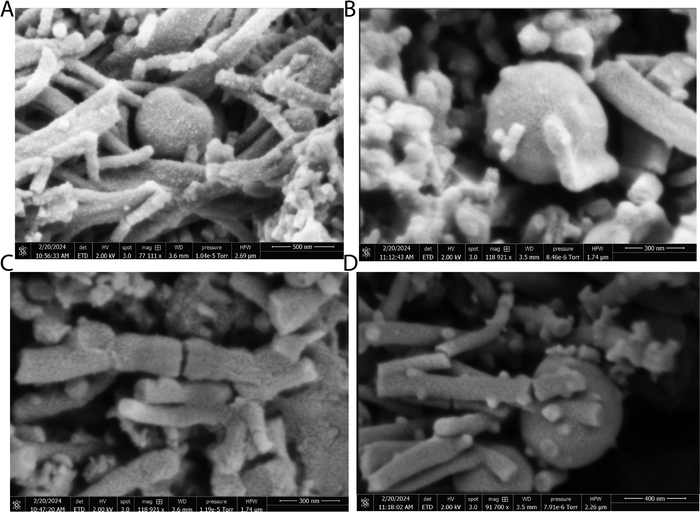
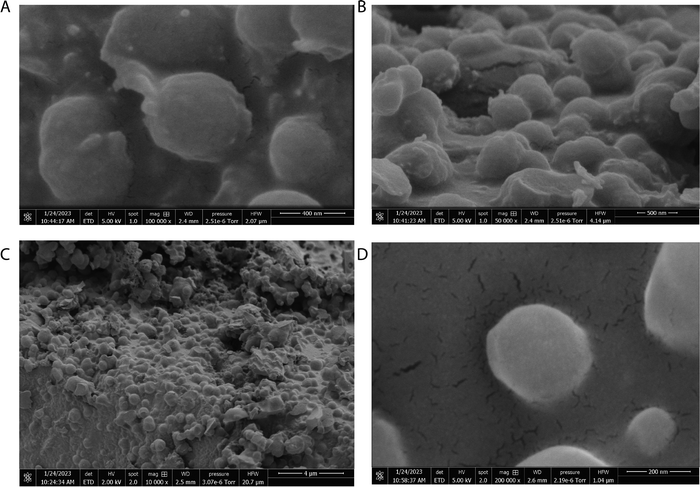
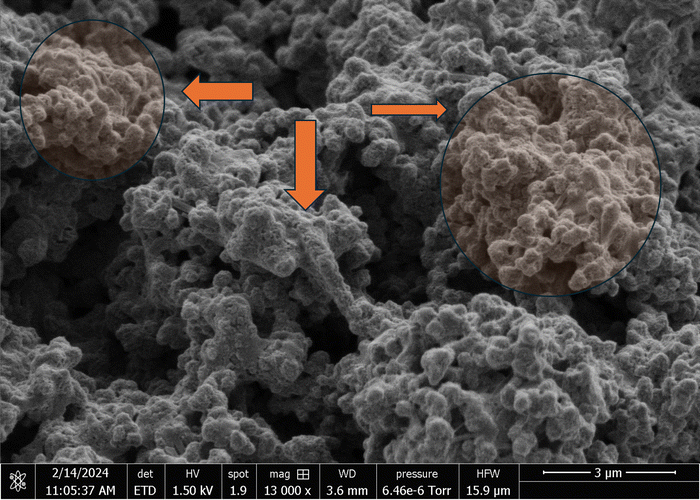
The scanning electron micrographs depicted in Fig. 3 and 4 illustrate the complex nanostructured morphology that is present in the proteinoid microspheres and polyaniline (PANI) fibres. Fig. 3A–D illustrates how the aniline polymerizes into aggregated granules and networks of interconnected nanofibrils, whereas Fig. 4A–D depict how the thermal condensation of amino acids produces nano-“islands” of proteinoid particles. Interestingly, the PANI assemblies have noticeable similarities with neuron cells, which extend intricate neuron-like structures known as dendrites. On the other hand, the proteinoid spheres can effectively simulate synapses and are capable of adapting due to their tailored surface patterns. By combining conductive polymeric fibrils with dynamically tunable peptide spheres, it is possible to replicate the structure and activity of neural tissue.The structure of the polyaniline-proteinoid samples was examined using scanning electron microscopy (SEM). The samples were prepared by mixing equal volumes of proteinoid and polyaniline solutions (50/50 v/v) to ensure a homogeneous distribution of both components in the composite material. The resulting mixture was then allowed to dry, and the collected powder was used for SEM analysis. Fig. 5 displays a scanning electron microscope (SEM) image of the composite material, showcasing the complex structure of polyaniline nanomaterials and proteinoid ensembles. The elongated polyaniline nanomaterials, highlighted by orange arrows, display a clearly identifiable fibrous morphology. The image shows proteinoid ensembles, which are marked by circles, mixed with polyaniline nanomaterials. It seems that the proteinoid ensembles are coated with a layer of polyaniline, indicating a significant connection between the two components. The SEM imaging employed a high magnification of 13![[thin space (1/6-em)]](https://www.rsc.org/images/entities/char_2009.gif) 000× and a modest accelerating voltage of 1.50 kV, enabling precise visualisation of the polyaniline-proteinoid composite without inducing notable sample damage. The use of a spot size of 1.9 enhanced the focus of the electron beam, resulting in the capacity to capture detailed images of the nanoscale characteristics with exceptional precision. The presence of elongated polyaniline nanomaterials and proteinoid ensembles coated with polyaniline indicates a unified and interconnected structure inside the composite material.
000× and a modest accelerating voltage of 1.50 kV, enabling precise visualisation of the polyaniline-proteinoid composite without inducing notable sample damage. The use of a spot size of 1.9 enhanced the focus of the electron beam, resulting in the capacity to capture detailed images of the nanoscale characteristics with exceptional precision. The presence of elongated polyaniline nanomaterials and proteinoid ensembles coated with polyaniline indicates a unified and interconnected structure inside the composite material.
3.2. Spiking activity in polyaniline-proteinoid composites
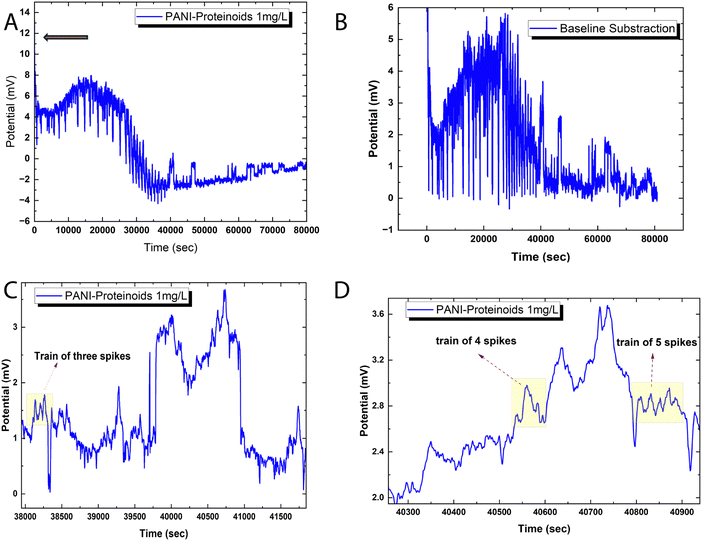
Fig. 6 illustrates the spiking behaviour exhibited by the bioelectronic composite of polyaniline and proteinoid (PANI-P). The voltage tracings demonstrate swift oscillations, which are distinguished by the emergence of transient spike clusters atop baseline deviations that have been smoothed (Fig. 6A and B). The amplitude distribution parameters for the spikes reveal significant variability (mean ± SD = 0.85 ± 3.42 mV). However, time-resolved decoded signals exhibit semi-reproducible wave packet patterns. The “spike trains” depicted in Fig. 6C and D are representative instances of discrete bursts consisting of 2–5 back-to-back pulses with mixed polarity. Although the emergent bioelectronic transients retain stochastic characteristics in terms of intensity and patterning, the outcomes demonstrate a dependable ability to translate intricate conduction dynamics at the millisecond scale within the PANI-proteinoid networks.After adjusting the voltage recordings to remove baseline drift, it becomes possible to accurately measure spike amplitude distributions without any underlying patterns. Displayed in the Fig. 6 are approximately 80![[thin space (1/6-em)]](https://www.rsc.org/images/entities/char_2009.gif) 000 transient events recorded with an average peak height of 1.75 mV above the threshold potential. The data shows a median of 1.15 mV and an interquartile range from 0.47 to 2.94 mV, indicating an asymmetric skew, with spikes exceeding 12 mV. Even with a standard deviation of 1.55 mV, noticeable patterns such as spike doublets and triplets influence the higher-level temporal organisation in these intricate biosynthetic matrices. Intense bursts occur at irregular intervals ranging from 0.55 to 6.05 minutes, indicating diverse dynamics in the landscape.
000 transient events recorded with an average peak height of 1.75 mV above the threshold potential. The data shows a median of 1.15 mV and an interquartile range from 0.47 to 2.94 mV, indicating an asymmetric skew, with spikes exceeding 12 mV. Even with a standard deviation of 1.55 mV, noticeable patterns such as spike doublets and triplets influence the higher-level temporal organisation in these intricate biosynthetic matrices. Intense bursts occur at irregular intervals ranging from 0.55 to 6.05 minutes, indicating diverse dynamics in the landscape.
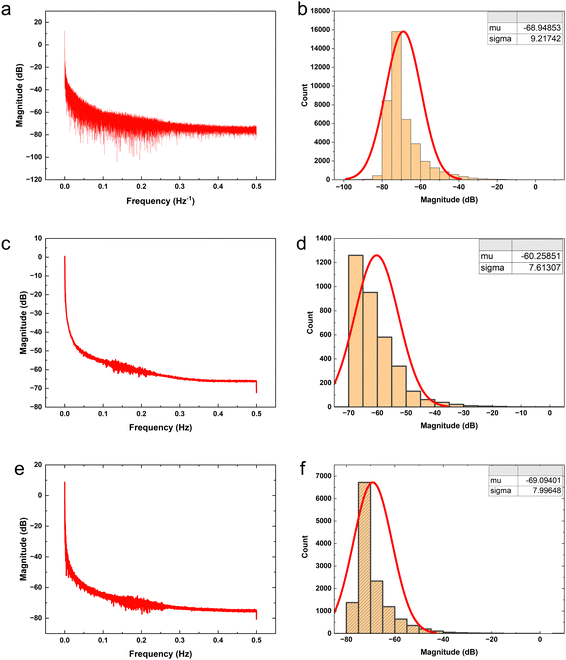
The proteinoid-PANI composites exhibit broad bandwidth behaviours as shown by the spectral distribution in Fig. 8A, spanning over 100 dB of signal intensities. Statistical analysis reveals the variance is centralized around a mean μ = −68.95 dB with a standard deviation σ = 9.22 dB following a normal probability density function  (Fig. 8B). While minimal signals become buried in sub-threshold noise <−104 dB, discernible bioelectronic activity emerges up to +12 dB, confirming richly heterogeneous conduction.
3.3. Modelling optically-triggered excitability using yellow light pulses in interfaced PANI-proteinoids
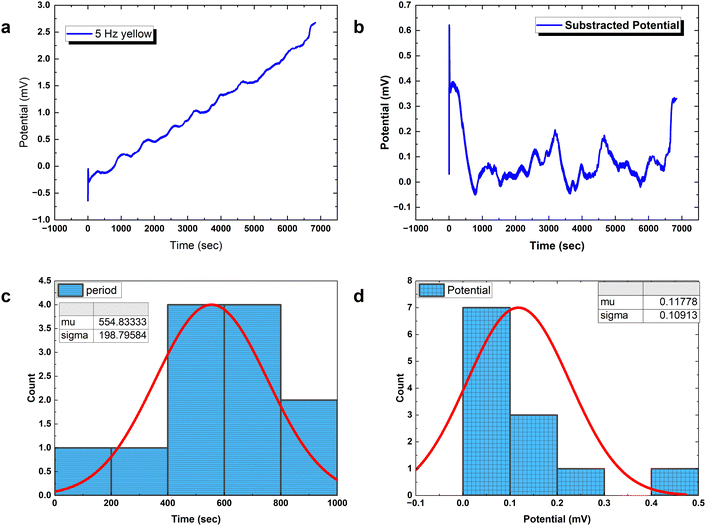
Analysing PANI-proteinoid composites using yellow light reveals changes in voltage patterns based on lighting frequency, as seen in Fig. 8. Yellow light at a frequency of 5 Hz stimulates naturally occurring repetitive spike patterns, which have recurrence periods centred around a specific resonance frequency. This frequency is determined by the formula with parameters μ = 554.83 s and σ = 198.80 s. Composite interactions enhance response amplitude sensitization, resulting in a 4-fold increase in means to 0.118 ± 0.109 mV, as shown in distributions (Fig. 6D). The measurements confirm the ability to use programmable optical control to direct both the rhythm and strength of complex spike waveforms. Current research are concentrated on identifying differences in structure to better understand the information storage capabilities in complex intermittent pathways of these bioelectronic materials.
The coefficient of variation (CV) provides a quantitative basis for assessing spike train variability:
 | (1) |
Fig. 7c, d and a, b compare the power spectral distributions of the absence (μ = −68.95 dB) and presence (μ = −60.26 dB) of pulsed yellow light (5 Hz) to illustrate that optical stimulation induces significant focusing of signal density across specific frequencies. In addition to achieving a 9 dB gain in mean baseline power to match increased coordination expectations, the concurrent decrease in standard deviation from 9.22 to 7.61 dB under optical forcing demonstrates that resonant synchronisation enables emergent selectivity. This deviation in variance trends from ambient background amplification demonstrates that light-activated accumulation is not simply stochastic magnification. While there is an apparent increase of approximately 9 dB in the mean signal intensity from Fig. 7b (−68.95 dB) to Fig. 7d (−60.26 dB), it is crucial to consider the standard deviations of both data sets. The standard deviation is around 10 dB for both Fig. 7b (σ = 9.22 dB) and Fig. 7d (σ = 7.61 dB), indicating a considerable spread in the signal intensities. The hypothesis test results indicate a statistically significant difference between the mean signal intensities of the power spectra in Fig. 7b and d. The test yielded an extremely low p-value (p = 0.0000000000), which is well below the commonly used significance threshold of 0.05. This suggests that the observed difference in mean signal intensities is highly unlikely to have occurred by chance alone. The confidence interval on the difference in means (ci) ranges from 8.419434 to 8.960599, indicating that the true difference in mean signal intensities between the two conditions is likely to fall within this range with a high level of confidence. The test statistics provide further support for the significance of the difference. The t-statistic of 62.963792 with 4313.874658 degrees of freedom (df) indicates a large effect size and reinforces the statistical significance of the result. Additionally, the standard deviation (sd) of 7.613066 suggests a relatively consistent spread of signal intensities within each data set. These results strongly suggest that the increase of approximately 9 dB in the mean signal intensity from Fig. 7b (−68.95 dB) to Fig. 7d (−60.26 dB) represents a statistically significant difference between the electrical activity of the proteinoid-PANI composites in the default state and when driven at 5 Hz by yellow light. The statistical significance of this difference implies that the observed changes in electrical activity are unlikely to have occurred by chance and are likely to be biologically relevant.
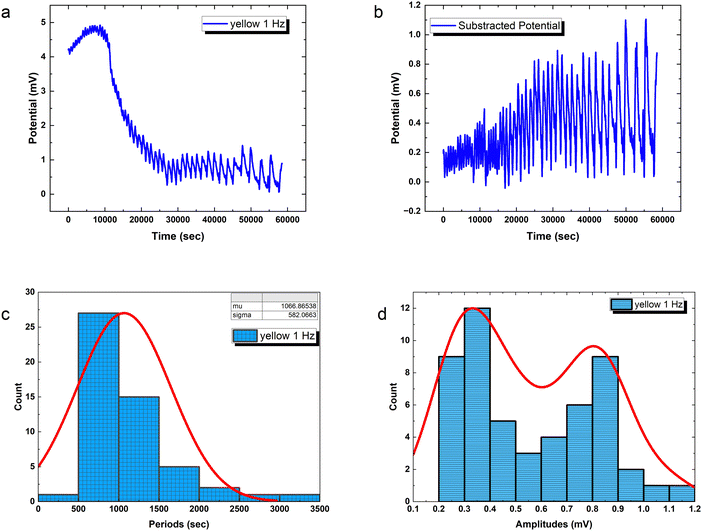
Precisely modulated optical stimulation verifies external control over emergent bioelectronic dynamics in PANI-proteinoid networks. Pulsed 1 Hz illumination drives oscillatory voltage waveforms (Fig. 9) phase-locked to the rhythmic input. Statistical period distribution around 1067 ± 582 s (Table 3) proves reliable coordination, with concentrated amplitude measures showing consistent 0.56 mV events atop complex baselines. Higher input frequencies enhance periodicity and introduce amplitude variability similar to biological neurons with noise. Adjusting stimulus parameters promotes precise control of spike train information – in contrast to random uncertainty without tailored external influence.
The amplitude distribution of the optically triggered electrical signals (1 Hz) in the PANI-proteinoid networks exhibits a bimodal character (Fig. 9d), suggesting the presence of two distinct populations of electrical responses. To quantitatively analyse this bimodal distribution, we fitted the amplitude data with a bimodal distribution function, which is a sum of two Gaussian distributions. The equation of the bimodal distribution function is given by:
 | (2) |
PANI-proteinoid oscillation periods under sporadic illumination at 1 Hz have a coefficient of variation (CV) of 0.5455, which indicates that they vary by more than 50 percent relative to the mean periodicity. In contrast, spike amplitudes exhibit a CV of 0.4639, which is close to fluctuations of 50%. On the contrary, raising the pulsation frequency to 5 Hz results in a CV value of 0.36 for periods, which indicates a greater degree of rhythmic consistency and approaches linear predictions in the presence of noise. Nonetheless, stimulation at a higher frequency also results in an increase in amplitude variability (CV = 0.93), which is close to the CV ≈ 1 characteristic of abnormal biological neurons. In brief, although the use of optical forcing causes expected oscillations, accuracy decreases at 1 Hz. This implies that in order to induce emergent pathways into dependable coordination, the substrate must possess a sufficient excitation density.
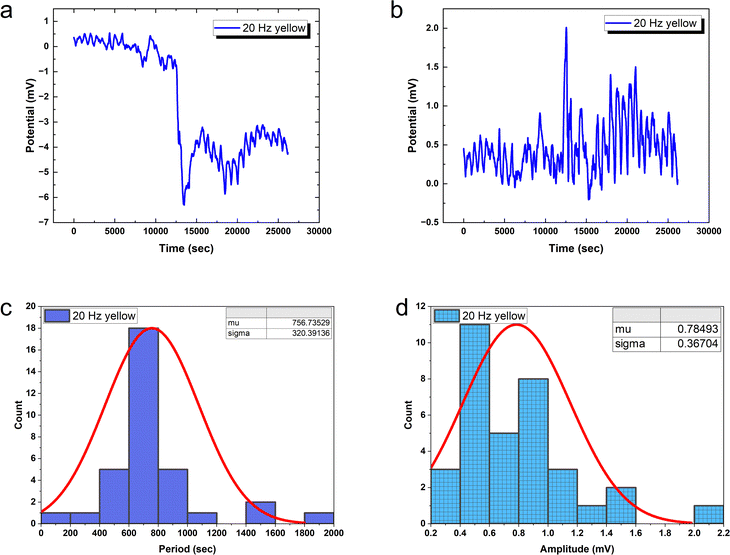
20 Hz optical driving induces tight oscillation periodicity coordination with CV = 0.4233 (Fig. 10), contrasting greater irregularity at slower input rates. However, higher frequency stimulation fails to constrain amplitude heterogeneity (CV = 0.4676). This divergent tuning of activity features by input rate modulation occurs in biological neurons. In fact, at 20 Hz the PANI-proteinoid dynamics resemble matured neural networks through excelling regularity (CV ≈ 0.4) over the CV ≈ 1 extreme fluctuations in early developing brains. This suggests sufficient external energy infusion properly trains intrinsic processes into reliable communication regimes from disorder. Comparatively, 1 Hz stimulation shows poor CV = 0.5455 periodicity and CV = 0.4639 amplitude consistency. Increasing to 5 Hz recovers some periodicity (CV = 0.36 periods) at cost of noisier spikes (CV = 0.93 amplitudes) – recapitulating neural trajectories from irregularity to bursting synchronization.
Frequency domain quantification supports the claim that incremental optical stimulation leads to systematic spectral tuning by energising biomolecular ionic transport networks (Fig. 7a and b). When the signalling is at its basic level without any external adjustments, the average power level is −68.95 dB with a standard deviation of 9.21 dB. With the addition of 5 Hz yellow pulsing, the reading shifts to −60.26 dB (σ = 7.61 dB), indicating a statistically significant increase of over 8 dB in coordinated amplification compared to spontaneous conduct. Increasing the input rate to 20 Hz results in a greater enhancement, with a mean of −69.095 dB (σ = 7.996 dB) in the spectra, showcasing more precise sub-band variability.
Analysing and comparing profiles confirms the advancement in focusing on specific wavelengths and increasing light intensity through optical stimulation. This global reorganization reflects the neural plasticity processes triggered by stimuli, which are recalibrating communication through boosted pathways.
3.4. Exploring hierarchical maps and attentive vision: modulating spike trains in PANI-proteinoid nanofibers under varied optical pulse frequencies
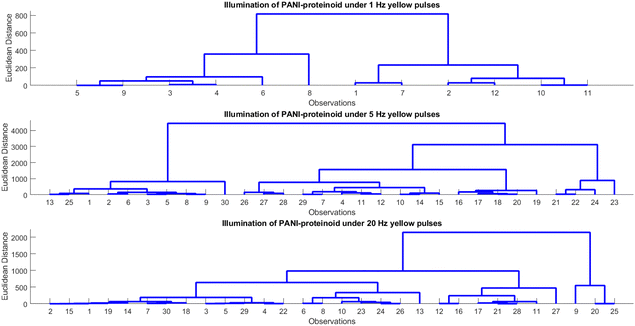
Human beings demonstrate an exceptional capacity to consistently identify objects despite variations in illumination, scale, rotation, and other perceived factors. Hierarchical processing along the ventral visual stream, which results in view-invariant representations from ever-more-complex features, is believed to be the source of this refined object recognition. Therefore, by learning the complex nature of hierarchical processing, one can not only facilitate the development of computer vision systems but also uncover insights into the perceptual capabilities of the human brain. Our study investigates hierarchical representations for bio-hybrid systems that require invariant pattern recognition. In particular, we manipulate the spiking characteristics of proteinoid-PANI nanofibers by inputting patterns of varying optical pulse frequencies. Subsequently, the photoelectrochemical response data are subjected to hierarchical clustering in order to analyse the emergence of categories across different pulse rates. The purpose of this study is to find out how distinct response subgroups resulting from the nanofibers’ complex biomolecular relaxation processes may serve as the foundation for invariant recognition. Our primary objective is to replicate the hierarchical feature learning that is thought to enable resilient perception in neural systems. Brain-mimetic computing and flexible biosensors may be significantly advanced as a result.The examination and hierarchical clustering of the photoelectrochemical data demonstrate discernible patterns in the PANI-proteinoid system's response to various frequencies of illumination (Table 1 and Fig. 11). The clustering identifies between groups with a rapid response (period 0.05–0.31 s) and a moderate amplitude (496–816 mV) when illuminated with yellow light pulses at 1 Hz (Fig. 11A). As the frequency increases to 5 Hz (Fig. 11B), the amplitude rises (632–3060 mV) while the period shortens (0.34–1.05 s), indicating a faster response time. Nevertheless, the response initiates branching into clusters with contrasting amplitudes (444–1911 mV) and periods (0.57–1.00 s) at 20 Hz (Fig. 11C). This indicates the initiation of intricate relaxation mechanisms within the PANI-proteinoid. In general, an increase in pulsed illumination frequency enhances the photoelectrochemical response time until 5 Hz, at which point non-linear effects become more prevalent.
| 1 Hz pulse | 5 Hz pulse | 20 Hz pulse | |||
|---|---|---|---|---|---|
| Cluster | Amplitude (mV) | Cluster | Amplitude (mV) | Cluster | Amplitude (mV) |
| 1 | 496.0 | 1 | 3060.0 | 1 | 1911.0 |
| 2 | 419.0 | 2 | 2332.3 | 2 | 1435.0 |
| 3 | 816.5 | 3 | 1753.0 | 3 | 684.1 |
| 4 | 674.0 | 4 | 1189.5 | 4 | 887.1 |
| 5 | 157.0 | 5 | 632.1 | 5 | 444.1 |
| 1 Hz pulse | 5 Hz pulse | 20 Hz pulse | |||
|---|---|---|---|---|---|
| Cluster | Period (s) | Cluster | Period (s) | Cluster | Period (s) |
| 1 | 0.130470 | 1 | 0.945400 | 1 | 0.572700 |
| 2 | 0.054265 | 2 | 1.048033 | 2 | 0.774250 |
| 3 | 0.308265 | 3 | 0.840874 | 3 | 0.662915 |
| 4 | 0.110772 | 4 | 0.713168 | 4 | 0.896857 |
| 5 | 0.006260 | 5 | 0.339883 | 5 | 1.002700 |
Capable of processing a wide range of input patterns and reacting appropriately, the integrated PANI-proteinoid complex demonstrates essential attributes of a perceptron, thus further advancing PANI-based perceptron prototypes developed by Erokhin and colleagues.18,19,41,42 When considering the excitability of the nanofiber network, the applied optical pulse frequencies operate in a manner similar to adjusting the probabilities of neuron spikes and refractory dynamics. Encoded in the hierarchical clustering of amplitude and period data, the resultant photoelectrochemical response classifies the inputs as a nonlinear decision boundary. Although the present study solely investigates three distinct illumination frequencies, the ability to differentiate between the induced dynamics is an essential proof-of-concept.
3.5. Nearest neighbour classification analysis of PANI-proteinoid response to yellow light stimulation
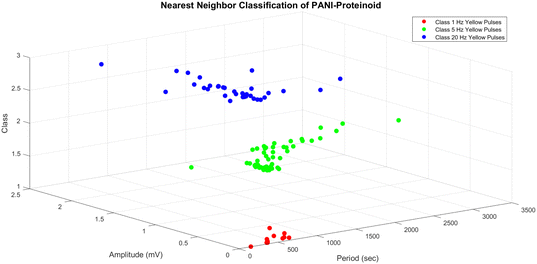
The nearest neighbour (NN) classification method was used to examine the distinctiveness and grouping of PANI-proteinoid responses, taking into account their amplitude and period characteristics at various frequency of yellow light pulses (Fig. 12). NN classification allocates an input to the class of its closest neighbour, defined by a metric such as the Euclidean distance between vectors x and y: | (3) |
The three-dimensional scatter plot (Fig. 12) illustrates the arrangement of the data points and their corresponding classes. The y-axis represents the amplitude, the x-axis represents the period, and the z-axis represents the class. The dataset has three distinct classes: class 1 (represented by red circles) corresponds to yellow pulses with a frequency of 1 Hz, class 2 (represented by green circles) corresponds to yellow pulses with a frequency of 5 Hz, and class 3 (represented by blue circles) corresponds to yellow pulses with a frequency of 20 Hz. The NN classifier establishes a decision boundary that is composed of linear segments, where each segment represents the perpendicular bisector between two data points from distinct classes. The input space is divided into discrete regions that correspond to different classes, as evidenced by the separate clusters in the plot. The findings of the NN classification, as shown in Fig. 12, offer valuable information about the distinguishability and grouping of the PANI-proteinoid responses at various stimulation frequencies. The separate groupings associated with each category indicate that the amplitude and time features of the reactions differ considerably depending on the frequency of the yellow light pulse applied. This discovery emphasises the potential of utilising PANI-proteinoid systems as biosensors or signal processors that are sensitive to different frequencies. By varying the stimulation frequency, it is possible to encode and distinguish between various states or categories of responses.
The period values for the 1 Hz yellow pulses group (class 1) range from 157.00 to 831.00 seconds, while the amplitude values cover from 0.01 to 0.41 mV. These findings suggest that the PANI-proteinoid responses to 1 Hz stimulation have longer duration and smaller magnitude compared to the other groups.
The 5 Hz yellow pulses group (class 2) has a broader range of period values, ranging from 63.00 to 3060.00 seconds, with amplitude values ranging from 0.20 to 1.11 mV. These findings indicate that the PANI-proteinoid responses to 5 Hz stimulation exhibit greater variability in terms of their timing and signal intensity compared to the group stimulated at 1 Hz.
The 20 Hz yellow pulses group, classified as class 3, has period values that range from 134.00 to 1911.00 seconds and amplitude values that span from 0.37 to 2.01 mV. The amplitude values in the higher range show that the PANI-proteinoid responses to 20 Hz stimulation have stronger signal intensity compared to the groups with lower frequencies.
The borders serve as a numerical indicator of the disparities in the PANI-proteinoid reactions when exposed to different frequencies of stimulation. The separate ranges of period and amplitude values for each group indicate that the frequency of the yellow light pulses applied has a notable influence on the temporal and signal properties of the PANI-proteinoid system.
From the viewpoint of neuromorphic engineering, these discoveries emphasise the possibility of utilising PANI-proteinoid systems as signal processors or pattern recognizers that are dependent on frequency. The capacity to distinguish between various stimulation frequencies based on the response characteristics presents opportunities for encoding and decoding information in these bio-inspired devices.
3.6. Modeling neural network dynamics: forest fire simulation with neuronal states influenced by PANI-proteinoid amplitude under yellow light stimulation
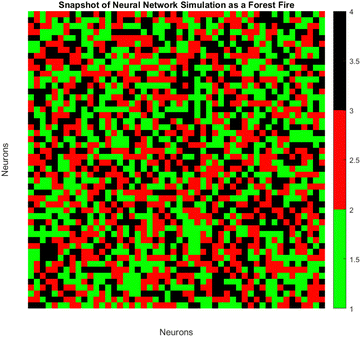
The spatiotemporal patterns of spiking dynamics exhibited by neurons in large-scale networks are comparable in complexity to the propagation of forest fires (Fig. 13). Individual neurons cycle through active (firing), refractory (recovering), and quiescent states, visualised here as burning, burnt, and green trees respectively. Previous computational models have demonstrated that in such networks, simple growth and ignition principles can give rise to emergent critical dynamics characterised by activity cycles that extend across all scales. By modulating PANI-proteinoid films photoelectrochemically, our bio-hybrid system is capable of simulating these multifaceted neural interactions. The applied optical pulse frequencies (1 Hz, 5 Hz, 20 Hz) tune the excitability of the underlying nanofiber network, regulating the readiness of quiescent nodes to fire, as well as recovery timescales, and spontaneous activation rates. As illustrated through the analogy of a forest fire, this results in the formation of clusters, oscillations, and surges of spiking activity. The spatiotemporal dynamics of the neural network are visualized using an analogy to a forest fire model on a discrete lattice (Fig. 13). Each lattice site represents the state of a neuron, categorized as: | (4) |
The state sr,t at position r and time t evolves according to a set of probabilistic update rules:
| p(sr,t = 100|sr,t−1 = 1) = 1 | (5) |
| p(sr,t = 0|sr,t−1 = 100) = p | (6) |
 | (7) |
Here, WΔr gives the connection weight from a neighbor displaced by Δr, and θ is a firing threshold. The evolution captures the cycle of firing, recovery, and resting phases. The model visualizes how cascades of activity emerge across the network.
To model the gradual recovery from the refractory state, an additional state transition rule is introduced (eqn (8)):
 | (8) |
By reducing the state value of neurons in the refractory state (represented by values greater than 1) by 1 in each time step until they reach the quiescent or active state, this rule ensures that they gradually recover.
3.7. Neuronal spike timing analysis in PANI-proteinoid sample under varying yellow light pulse frequencies
The integrated PANI-proteinoid structure is similar to a biological perceptron in its capacity to interpret different input spike patterns and respond accordingly. Specifically, the applied optical pulse frequencies modulate the excitability dynamics of the nanofiber network in a manner similar to adapting neuron firing rates and recovery time periods. The measured photoelectrochemical response, stored in the hierarchical clustering of amplitude and period characteristics, serves as a nonlinear decision boundary for categorising stimulation methods. Thus, the synergistic interactions of the complex biomolecular components enable integrative capabilities similar to neural processing.While the current study uses three discrete illumination frequencies as inputs, the system properly differentiates between the resulting dynamics, showing its pattern integration potential. Additional research using gradually changing pulse cycles would help to map out more complex partition boundaries. In essence, the bio-hybrid material acting as a perceptron “neuron” receives spatiotemporal light inputs at its “dendrites” and integrates and translates them into differential “firing” responses. The displayed input–output signal processing offers insight into emergent cognition-mimetic properties.
PANI-proteinoid structures show potential for developing increasingly brain-like functions, ranging from low-level feature extraction to high-level invariant pattern recognition. At its root, the ability to organise this biosynthetic soft material into customisable computational networks suggests adaptability in accordance with the demands of vision and other cognitive functions.
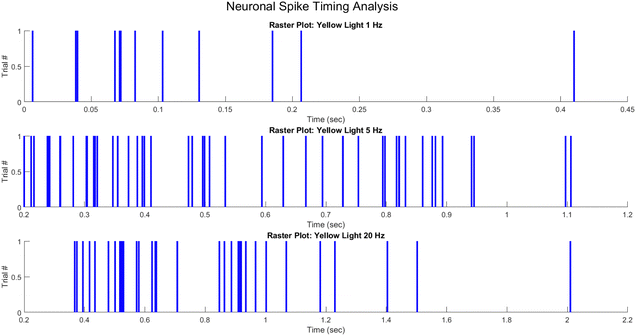
For visualising the spike timing activity of neurons, raster diagrams are an important technique. In the same way that action potentials are characterised by their timing as stereotypical electrical impulses that communicate information mainly through their visual characteristics, raster plots offer an intuitive depiction by representing spikes as distinct checkboxes on a timeline. Assigning spike events to specific trials, each pulse indicates the moment when a recorded voltage trace surpasses a predetermined threshold. The capacity to plot repeated experiments along a shared axis provides valuable information regarding the dynamic code that temporal spike patterns carry.
In general, trials are arranged vertically in the raster structure, where each row corresponds to the activity sequence of a single trial. The neural activity patterns that correspond to particular stimuli or patterns are evident in the resultant matrix of ticks. As an illustration, a neuron might exhibit consistent firing at specific intervals preceding the go-cue of each trial, or it might fire at a rising rate as a decision threshold approaches. Rough spike timelines generated from raw voltage readings enable raster plots to facilitate the rapid derivation of encoding messages. They are ubiquitous in the study of neural computation, spanning from early sensory processing to higher cognition, due to their practicality.
To generate a raster plot, it is necessary to depict lines or checkboxes at the times of the extracted spikes along a common time axis that spans all trials. MATLAB enables the construction of programmatic pixels by employing functions such as “histc()” and “line()” to transform vectors representing spike times onto a timebase array. Visualising the complete raster plot matrix can be performed through the use of graphics functions such as “image()” and the vertical layering of these spike mappings. A simple mapping between spike occurrences and timesteps is necessary to transform raw data into insightful rasters.
In order to represent the spiking activity of the PANI-proteinoid system in response to different optical stimulation protocols, the measured photoelectrochemical pulse response times were utilised to generate raster diagrams (Fig. 14). Spike events were visually depicted as vertical lines that were recorded at the time of occurrence of the pulse peak for each trial. Under yellow light pulsing at 1 Hz (Fig. 14A), 5 Hz (Fig. 14B), and 20 Hz (Fig. 14C), raster diagrams represented the emergent rhythmicity and synchronicity across trials.
Spikes clustered into intermittent bursts separated by lengthy inter-pulse intervals when illuminated at 1 Hz. This observed pattern suggests a decreased excitation-recovery cycle that limits reliable response to individual pulses. At 5 Hz, reliable spiking activity occurs with each optical pulse, confirming appropriate tuning to the faster stimulation frequency. However, at 20 Hz the temporal precision deteriorates with variable spike timing and intermittent dropped pulses that disrupt the rhythmic structure.
The capacity to entrain to mid-range frequencies indicates a resonant activation of underlying processes, whereas divergence at higher rates suggests that the relaxation kinetics impose a limit. In general, the raster graphs offer a visual representation of the non-linear mechanisms that control transient phenomena in the neuro-mimetic biosystems under consideration. Reconstructing the intricate modulation of excitability mechanisms in response to diverse input stimulation is the objective of computational modelling.
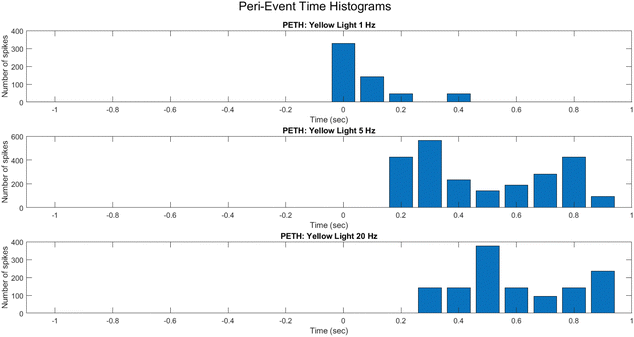
To reveal fine-grained dynamic structure in the spiking activity of the PANI-proteinoid system, peri-event time histograms (PETHs) were constructed around light pulse onset events (Fig. 15). By mapping average spike counts across trials into discrete time bins spanning stimuli, PETHs allowed inference on input-driven response profiles.
PETHs centered on light pulse initiation showcase the mean activity modulation under 1 Hz (Fig. 15A), 5 Hz (Fig. 15B), and 20 Hz (Fig. 15C) protocols. At 1 Hz, the response features low baseline activity with intermittent bursts lacking temporal precision. This progresses into rhythmic, entrained firing at 5 Hz, before deteriorating into sporadic activity unable to track the elevated 20 Hz frequency.
The differential PETH profiles illustrate the system's tendency for tuning to mid-level frequencies, whereas divergence at extremely high pulse rates implies the potential emergence of complicated non-linear effects that resemble stochastic resonance phenomena in neurons. Systematically elucidating the mechanisms corresponding to neural excitation, inhibition, and refractoriness in these synthetic networks is possible by employing PETHs to decode input-activated dynamics.
3.8. Effect of yellow light pulses in PANI-proteinoid on EEG waves across different frequency bands
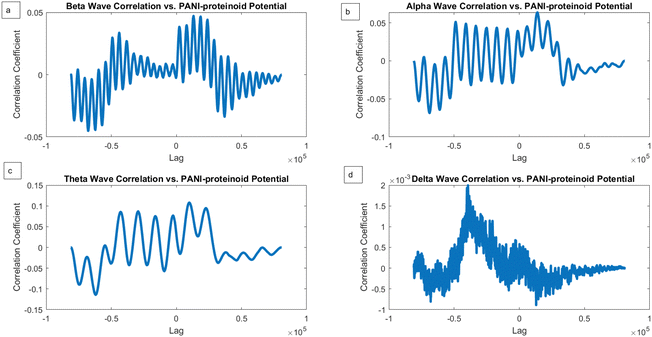
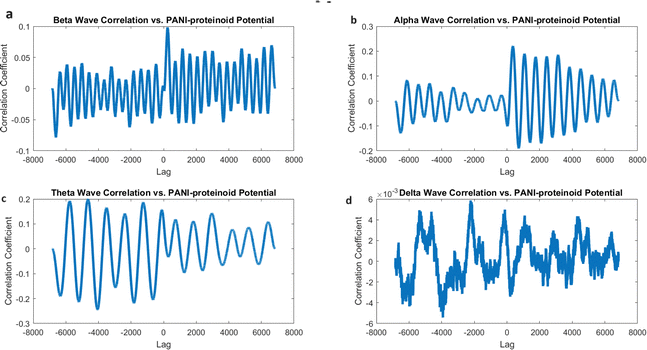
We conducted a comparison between the electrical activity of PANI-proteinoid samples and EEG brain waves in order to examine the similarity between them. We examined the similarities in temporal structure and synchronisation patterns between PANI-proteinoid signals and simulated EEG waveforms across several frequency bands. EEG recordings commonly display four distinct frequency bands: delta (0.5–4 Hz), theta (4–8 Hz), alpha (8–13 Hz), and beta (13–30 Hz). We employed cross-correlation analysis to compare the electrical activity of PANI-proteinoid with each simulated brain wave. Signals that are more similar have higher cross-correlation coefficients, which quantify the degree of linear dependence between them. In addition, we determined the lag at which the highest correlation occurred, indicating the temporal alignment of the signal. We discovered intriguing parallels between the electrical dynamics of PANI-proteinoid and brain wave oscillations. These findings suggest that self-assembled nanofibers can exhibit emergent neural synchronisation and coordination characteristics. Understanding this resemblance has the potential to pave the way for neuromorphic computer architectures and bio-inspired information processing systems.In order to explore the potential similarity between the spontaneous electrical activity of PANI-proteinoids and brain waves, we conducted a cross-correlation analysis by comparing the PANI-proteinoid data with simulated waveforms representing various frequency bands of EEG (Fig. 16). The cross-correlation coefficients measure the degree of linear correlation between the PANI-proteinoid activity and each brain wave, where larger values indicate a greater level of similarity.
The findings of our study demonstrate varying degrees of connection strengths within different frequency bands. The theta waves (4–8 Hz) showed the strongest association, with a value of 0.1080 (Fig. 16c). This discovery implies a possible similarity in the timing and coordination patterns between the electrical activity of PANI-proteinoid and the rhythmic behaviour linked to cognitive processes in the brain. Alpha waves, which have a frequency range of 8–13 Hz, showed the second-highest correlation with a coefficient of 0.0637 (Fig. 16b). Beta waves, which have a frequency range of 13–30 Hz, had a coefficient of 0.0472 (Fig. 16a). The delta waves (0.5–4 Hz) exhibited the lowest correlation, with a value of 0.0020 (Fig. 16d).
Although cross-correlation analysis offers insights on the similarity between PANI-proteinoid activity and brain waves, it is crucial to take into account the statistical significance of these correlations. The correlation coefficients obtained, which range from 0.0020 to 0.1080, are relatively low and do not suggest a significant linear link between the signals. In order to ascertain the statistical significance of these connections, more analysis, such as hypothesis testing and careful consideration of the sample size, would be required.
However, when PANI-proteinoids are exposed to yellow light with a frequency of 5 Hz (Fig. 17), the cross-correlation analysis produces clear and separate outcomes. The correlation coefficients demonstrate a significant rise in all frequency bands as compared to the spontaneous activity. Remarkably, the strongest link is currently reported with alpha waves (0.2207), followed by theta waves (0.1995) and beta waves (0.0984). The correlation coefficient with delta waves is relatively low, with a value of 0.0059.
The increased correlation seen between alpha waves and the lighting of PANI-proteinoid nanofibers with frequencies below 5 Hz suggests that these nanofibers activated by light may display emergent dynamics that closely match the rhythmic patterns observed during relaxed alertness and early sleep stages in the brain. The change in correlation strengths suggests that the external visual stimulation influences the timing and coordination of PANI-proteinoid electrical activity, potentially leading to a closer resemblance to alpha-band oscillations.
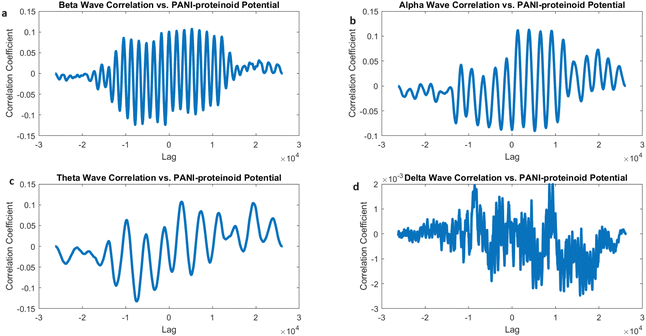
The cross-correlation examination of the electrical activity of PANI-proteinoids under 20 Hz yellow light stimulation and simulated brain waves revealed interesting patterns of synchronisation (Fig. 18). The correlation coefficients for beta waves (0.1073), alpha waves (0.1128), and theta waves (0.1074) demonstrate a fairly even distribution, indicating that PANI-proteinoid activity is dispersedly aligned with higher-frequency brain wave patterns (Fig. 18a–c). Significantly, the slightly elevated connection with alpha waves suggests a little inclination towards synchronisation with oscillations linked to a state of relaxed wakefulness and the initial phases of sleep.
On the other hand, the correlation with delta waves (0.0020) is still very low (Fig. 18d), indicating that there is only a little degree of similarity with the slow oscillations that are usually seen during deep sleep. This discovery indicates that the use of high-frequency optical stimulation at 20 Hz can potentially trigger a state of increased alertness and cognitive processing in the PANI-proteinoid system, similar to the cognitive states linked to beta and alpha oscillations in the brain.
The correlation coefficients between beta, alpha, and theta bands, when stimulated below 20 Hz (Fig. 18), show a generally balanced relationship. This is in contrast to the observed correlation mostly with alpha waves when stimulated at 5 Hz (Fig. 17). This comparison demonstrates how optical stimulation modulates the dynamics of PANI-proteinoid in a frequency-dependent manner. When the brain is stimulated at a frequency of 5 Hz, it becomes more comparable to alpha-band oscillations, which can help promote a state of relaxation. On the other hand, when the brain is stimulated at a frequency of 20 Hz, it becomes more synchronised throughout higher-frequency bands, indicating increased cognitive processing.
4. Discussion
This study shows the complex dynamics and tunable spiking behaviour of PANI-proteinoid nanofiber networks when exposed to different optical stimulation frequencies. The results have significant implications for understanding the emergence of complex functionalities in neuromorphic materials as well as developing adaptable, brain-inspired computing systems.Different driving frequencies induced different kinds of photoelectrochemical responses, as shown in Table 2 by the hierarchical clustering analysis. Significantly, the shift from irregular bursting at 1 Hz to unsustained bursting at 20 Hz, followed by rhythmic synchronisation at 5 Hz, mimics the frequency-dependent adaptations that have been observed in biological neurons.43,44 This indicates that the PANI-proteinoid networks exhibit intrinsic plasticity in which the temporal patterns of the input stimuli influence the excitability and refractory dynamics.
| Frequency (Hz) | Spiking regime | Inter-spike interval CV | Amplitude CV |
|---|---|---|---|
| 1 | Irregular bursting | 0.55 | 0.46 |
| 5 | Rhythmic entrainment | 0.36 | 0.93 |
| 20 | Unsustained spiking | 0.42 | 0.47 |
| Period (s) | Amplitude (mV) |
|---|---|
| 725 | 0.20 |
| 679 | 0.24 |
| 573 | 0.24 |
| 749 | 0.24 |
| 591 | 0.22 |
| 657 | 0.30 |
| 688 | 0.32 |
| 618 | 0.26 |
| 626 | 0.32 |
| 601 | 0.32 |
| 733 | 0.30 |
| 647 | 0.26 |
| 803 | 0.35 |
| 629 | 0.40 |
| 650 | 0.41 |
| 618 | 0.39 |
| 632 | 0.50 |
| 613 | 0.21 |
| 627 | 0.35 |
| 593 | 0.36 |
| 620 | 0.37 |
| 667 | 0.40 |
| 608 | 0.28 |
| Period (s) | Amplitude (mV) |
|---|---|
| 831 | 0.41 |
| 717 | 0.072 |
| 406 | 0.03849 |
| 396 | 0.03977 |
| 437 | 0.06767 |
| 496 | 0.13047 |
| 802 | 0.20653 |
| 157 | 0.00626 |
| 437 | 0.07113 |
| 644 | 0.18515 |
| 647 | 0.0827 |
| 688 | 0.10324 |
| Period (s) | Amplitude (mV) |
|---|---|
| 658 | 0.3945 |
| 656 | 0.5292 |
| 713 | 0.6238 |
| 719 | 0.5799 |
| 708 | 0.5222 |
| 918 | 0.7075 |
| 631 | 0.5229 |
| 932 | 0.5171 |
| 1911 | 0.5727 |
| 774 | 0.4165 |
| 708 | 0.9097 |
| 400 | 0.4793 |
| 1107 | 0.5013 |
| 678 | 0.3746 |
| 654 | 0.4345 |
| 393 | 2.01 |
| 572 | 1.0686 |
| 612 | 0.5254 |
| 665 | 0.9668 |
| 1437 | 0.3675 |
| 551 | 0.8866 |
| 723 | 0.8469 |
| 851 | 1.4036 |
| 817 | 1.2298 |
| 1433 | 1.181 |
| 811 | 1.5022 |
| 134 | 1.002 |
| 554 | 0.9346 |
| 724 | 0.8634 |
| 720 | 0.9152 |
| 505 | 0.6378 |
| 698 | 0.7072 |
| 721 | 0.91896 |
| 641 | 0.6344 |
| Peak position-wavenumber (cm−1) | Intensity |
|---|---|
| 402.60 | 0.171 |
| 409.04 | 0.178 |
| 424.37 | 0.167 |
| 442.44 | 0.172 |
| 469.64 | 0.161 |
| 511.96 | 0.159 |
| 527.30 | 0.159 |
| 1052.28 | 0.103 |
| 1216.93 | 0.158 |
| 1228.87 | 0.149 |
| 1365.58 | 0.149 |
| 1510.42 | 0.0978 |
| 1581.13 | 0.0968 |
| 1738.53 | 0.173 |
| 2921.68 | 0.136 |
| 2970.00 | 0.135 |
| Peak position (cm−1) | Intensity |
|---|---|
| 409.32 | 0.339 |
| 420.63 | 0.331 |
| 510.74 | 0.349 |
| 565.95 | 0.348 |
| 681.41 | 0.344 |
| 740.87 | 0.312 |
| 813.71 | 0.307 |
| 1007.94 | 0.317 |
| 1031.97 | 0.317 |
| 1119.87 | 0.337 |
| 1150.09 | 0.340 |
| 1216.94 | 0.361 |
| 1228.42 | 0.348 |
| 1288.03 | 0.299 |
| 1365.38 | 0.309 |
| 1443.96 | 0.318 |
| 1488.90 | 0.339 |
| 1566.02 | 0.279 |
| 1738.29 | 0.289 |
| 2970.03 | 0.252 |
The amplitudes and coefficient of variation (CV) of the inter-spike intervals were used as a quantitative indicator of the spiking temporal regularity and consistency. Furthermore, the CV values showed non-monotonic variation in relation to the driving frequency, suggesting the presence of a complex relationship between the time scales of stimulation and the inherent relaxation dynamics of the nanofibers.
Previous research in the field of neuroscience have established that the CV of neural spiking is based upon the adaptation currents,45 the relative contributions of excitatory and inhibitory inputs,46 and the membrane time constant.47 An examination of these variables within the framework of PANI-proteinoid networks may provide significant knowledge regarding the sources of stochastic variability and its operational function in encoding information. The forest-fire cellular automata model effectively represented the propagation of spatiotemporal activity within the nanofiber networks. Through the manipulation of ignition and recovery probabilities for individual nodes in response to variations in illumination frequency, we successfully replicated the synchronisation patterns and emergent spike clusters. This finding provides further evidence in favour of the concept that optical stimulation can adjust internal dynamics and network connectivity, thereby enabling the manipulation of self-organised activity. Further research may utilise this potential to manipulate neuromorphic computations in a way that facilitates pattern recognition, decision making, and memory formation.48
Being able to manipulate the spiking dynamics of PANI-proteinoid networks optically presents promising prospects for the advancement of neuromorphic computing and sensing platforms. One potential application of frequency-dependent entrainment is the implementation of selective attention mechanisms, which involve amplifying relevant stimuli at particular frequencies while suppressing others.49 Furthermore, the materials’ capacity to support complex dynamics and high-dimensional parameter spaces may facilitate the development of reservoir computing methods for time-series classification and prediction tasks.3
In addition, because of their biocompatibility and ability to self-assemble, PANI-proteinoid nanofibers are highly promising for biomedical applications and bioelectronic interfaces. The integration of neuromorphic materials with flexible electronics and wearable devices has the potential to enable the development of brain-inspired, adaptive sensors and actuators capable of seamless interaction with biological systems.50 The formation of memories, decision-making, and pattern recognition are examples of desired neuromorphic computations.48 Neuromorphic engineering, which mimics the brain's computational principles in artificial systems, presents exciting new possibilities because to PANI-proteinoid nanofibers. These nanofibers are excellent for many applications due to their frequency-dependent entrainment and complicated dynamics when optically stimulated.
• Adaptive sensing: in machine olfaction, tactile sensing, and event-based vision, adaptive sensors can process and classify complex spatiotemporal patterns in real time using optically-stimulated PANI-proteinoid nanofibers’ frequency-dependent entrainment and complex dynamics.
• Bioelectronic interfaces: PANI-proteinoid nanofibers are attractive biological system interfaces due to their biocompatibility and self-assembly. They create adaptive, brain-inspired interfaces for neural prosthetics, biosensors, and closed-loop neuromodulation when combined with flexible electronics and wearable devices.
• Neuromorphic robotics: robots can learn, adapt, and analyse sensory data using PANI-proteinoid networks as neuromorphic controllers. This could lead to autonomous robots for exploration, search and rescue, and human–robot interaction in dynamic and unstructured environments.
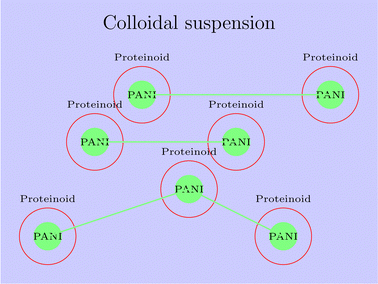
The PANI-proteinoid composite, depicted in Fig. 19, demonstrates a distinctive mechanism that integrates the conductive characteristics of PANI nanoparticles with the encapsulation and stabilisation characteristics of proteinoids. This combination of components results in improved electrical characteristics and creates opportunities for a wide range of potential uses. An essential feature of the PANI-proteinoid mechanism is the creation of a conductive network within the composite. The figure shows the interconnected PANI nanoparticles, represented in green, which facilitate efficient electron transfer and enhance electrical conductivity. The interconnections among the PANI nanoparticles facilitate the formation of conductive channels, hence enhancing the movement of electric charges across the composite material. Another vital component of the method involves the containment of the PANI nanoparticles within the proteinoid microspheres, which are seen in red. The proteinoids encapsulate and stabilise the PANI nanoparticles, inhibiting their aggregation and ensuring a uniform dispersion within the colloidal suspension. Enclosing the composite material not only increases its stability but also creates a protective barrier that boosts the adaptability and effectiveness of the PANI nanoparticles in different surroundings.
5. Conclusion
We examined the emergent electrical signalling of PANI-proteinoid nanofiber networks under diverse optical stimulation conditions. We used pulsed yellow light at 1, 5, and 20 Hz to alter excitation–relaxation dynamics and spike train patterns in these neuromorphic composites. Hierarchical clustering of photoelectrochemical reaction data revealed driving frequency-induced activity patterns. Nanofibers displayed irregular spike bursts with long inter-pulse intervals at 1 Hz, indicating a delayed recovery cycle that couldn't track input. Increasing stimulation to 5 Hz gave the network rhythmic oscillations with optical pulse train-locked spiking. Refractory dynamics decreased firing rates at 20 Hz, generating stochastic spiking and temporal coordination problems. Raster plots and peri-event time histograms showed irregular, rhythmic, and complex nonlinear dynamics like biological neural networks. To model spatiotemporal activity propagation, we treated the PANI-proteinoid system as a forest-fire cellular automata with illumination frequency influencing node ignition and recovery probability. These findings show that PANI-proteinoid nanofibers could be hardware equivalents of biological brain networks, with photonic stimulation enabling flexible information encoding. We found optical control over self-organized neuromorphic dynamics in PANI-proteinoid nanofibers, which is a big step towards unconventional, life-like computers and brain-interface materials.Conflicts of interest
There are no conflicts to declare.Appendices
The FT-IR spectrum of PANIAPS (Fig. 20a) exhibits characteristic absorption bands associated with PANI. The peaks at 1566.02 cm−1 and 1488.90 cm−1 correspond to the C![[double bond, length as m-dash]](https://www.rsc.org/images/entities/char_e001.gif) C stretching vibrations of the quinoid and benzenoid rings, respectively. The peak at 1365.38 cm−1 is attributed to the C–N stretching vibration in the quinoid imine units. The absorption bands at 1216.94 cm−1 and 1150.09 cm−1 are assigned to the C–H in-plane bending vibrations of the quinoid and benzenoid rings, respectively. The peaks at 1031.97 cm−1 and 813.71 cm−1 are associated with the out-of-plane bending vibrations of C–H in the substituted benzenoid rings. On the other hand, the FT-IR spectrum of PANInitrate (Fig. 20b) shows some similarities to PANIAPS but with notable differences. The absorption bands at 1581.13 cm−1 and 1510.42 cm−1 correspond to the C
C stretching vibrations of the quinoid and benzenoid rings, respectively. The peak at 1365.38 cm−1 is attributed to the C–N stretching vibration in the quinoid imine units. The absorption bands at 1216.94 cm−1 and 1150.09 cm−1 are assigned to the C–H in-plane bending vibrations of the quinoid and benzenoid rings, respectively. The peaks at 1031.97 cm−1 and 813.71 cm−1 are associated with the out-of-plane bending vibrations of C–H in the substituted benzenoid rings. On the other hand, the FT-IR spectrum of PANInitrate (Fig. 20b) shows some similarities to PANIAPS but with notable differences. The absorption bands at 1581.13 cm−1 and 1510.42 cm−1 correspond to the C![[double bond, length as m-dash]](https://www.rsc.org/images/entities/char_e001.gif) C stretching vibrations of the quinoid and benzenoid rings, respectively. However, the relative intensities of these peaks are different compared to PANIAPS, suggesting a variation in the proportion of quinoid and benzenoid units in the polymer chain. The peak at 1365.58 cm−1 is attributed to the C–N stretching vibration in the quinoid imine units, similar to PANIAPS. The absorption bands at 1228.87 cm−1 and 1216.93 cm−1 are assigned to the C–H in-plane bending vibrations of the quinoid and benzenoid rings, respectively. A notable difference between the two spectra is the presence of a strong absorption band at 1738.53 cm−1 in PANInitrate, which is absent in PANIAPS. This peak is typically associated with the C
C stretching vibrations of the quinoid and benzenoid rings, respectively. However, the relative intensities of these peaks are different compared to PANIAPS, suggesting a variation in the proportion of quinoid and benzenoid units in the polymer chain. The peak at 1365.58 cm−1 is attributed to the C–N stretching vibration in the quinoid imine units, similar to PANIAPS. The absorption bands at 1228.87 cm−1 and 1216.93 cm−1 are assigned to the C–H in-plane bending vibrations of the quinoid and benzenoid rings, respectively. A notable difference between the two spectra is the presence of a strong absorption band at 1738.53 cm−1 in PANInitrate, which is absent in PANIAPS. This peak is typically associated with the C![[double bond, length as m-dash]](https://www.rsc.org/images/entities/char_e001.gif) O stretching vibration of carbonyl groups, indicating the presence of oxidized structures or impurities in PANInitrate. However, upon closer inspection, both PANIAPS and PANInitrate clearly display an absorption band at approximately 1738 cm−1, although with varying intensities. The absorbance of the peak at 1738.53 cm−1 is around 0.28 in PANIAPS and roughly 0.17 in PANInitrate. The presence of oxidised structures or impurities in both PANI samples is indicated by the absorption band, which is normally linked with the C
O stretching vibration of carbonyl groups, indicating the presence of oxidized structures or impurities in PANInitrate. However, upon closer inspection, both PANIAPS and PANInitrate clearly display an absorption band at approximately 1738 cm−1, although with varying intensities. The absorbance of the peak at 1738.53 cm−1 is around 0.28 in PANIAPS and roughly 0.17 in PANInitrate. The presence of oxidised structures or impurities in both PANI samples is indicated by the absorption band, which is normally linked with the C![[double bond, length as m-dash]](https://www.rsc.org/images/entities/char_e001.gif) O stretching vibration of carbonyl groups. However, the extent of this presence differs between the two samples. There are also differences in the absorption bands below 1000 cm−1 between PANIAPS and PANInitrate. The PANIAPS sample exhibits strong peaks at 565.95 cm−1 and 510.74 cm−1, whereas the PANInitrate sample shows observed peaks at 527.30 cm−1 and 511.96 cm−1. The observed differences indicate changes in the patterns of substitution and the presence of different functional groups in the two PANI samples.
O stretching vibration of carbonyl groups. However, the extent of this presence differs between the two samples. There are also differences in the absorption bands below 1000 cm−1 between PANIAPS and PANInitrate. The PANIAPS sample exhibits strong peaks at 565.95 cm−1 and 510.74 cm−1, whereas the PANInitrate sample shows observed peaks at 527.30 cm−1 and 511.96 cm−1. The observed differences indicate changes in the patterns of substitution and the presence of different functional groups in the two PANI samples.
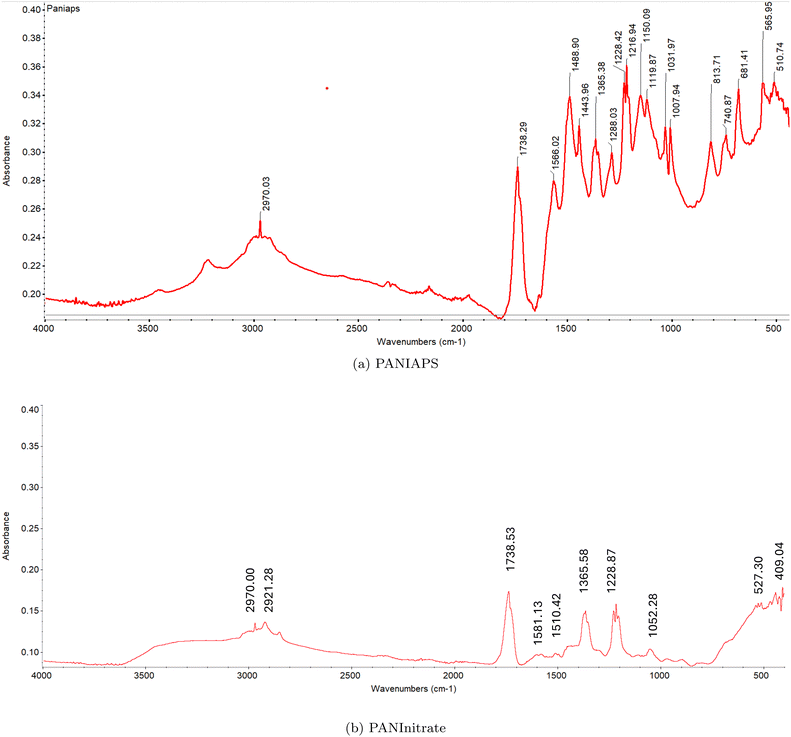 | ||
| Fig. 20 FT-IR spectra of PANI synthesized using (a) ammonium persulfate (PANIAPS) and (b) ferrous nitrate (PANInitrate) as oxidizing agents. | ||
Data availability
The data for the paper has been uploaded to the Zenodo database. You can access the data through the following link: [https://zenodo.org/records/10808307].References
- G. Indiveri and T. K. Horiuchi, Frontiers in neuromorphic engineering, Front. Neurosci., 2011, 5, 13375 Search PubMed.
- D. Marković, A. Mizrahi, D. Querlioz and J. Grollier, Physics for neuromorphic computing, Nat. Rev. Phys., 2020, 2(9), 499–510 CrossRef.
- G. Tanaka, T. Yamane, J. B. Héroux, R. Nakane, N. Kanazawa, S. Takeda, H. Numata, D. Nakano and A. Hirose, Recent advances in physical reservoir computing: A review, Neural Networks, 2019, 115, 100–123 CrossRef PubMed.
- J. D. Kendall and S. Kumar, The building blocks of a brain-inspired computer, Appl. Phys. Rev., 2020, 7(1), 011305 CAS.
- S. Stafström, J. Bredas, A. Epstein, H. Woo, D. Tanner, W. Huang and A. MacDiarmid, Polaron lattice in highly conducting polyaniline: Theoretical and optical studies, Phys. Rev. Lett., 1987, 59(13), 1464 CrossRef PubMed.
- J. Huang, Syntheses and applications of conducting polymer polyaniline nanofibers, Pure Appl. Chem., 2006, 78(1), 15–27 CrossRef CAS.
- D. Li, J. Huang and R. B. Kaner, Polyaniline nanofibers: a unique polymer nanostructure for versatile applications, Acc. Chem. Res., 2009, 42(1), 135–145 CrossRef CAS PubMed.
- B. Ertekin, Z. Cimen, H. Yilmaz and U. Yilmaz, Synthesis and characterization of polyaniline/ignimbrite nano-composite material, J. Mater. Sci. Eng., 2016, 5, 1000237 Search PubMed.
- M. J. Antony and M. Jayakannan, Polyaniline nanoscaffolds for colorimetric sensing of biomolecules via electron transfer process, Langmuir, 2011, 27(10), 6268–6278 CrossRef CAS PubMed.
- S. Er, U. Laraib, R. Arshad, S. Sargazi, A. Rahdar, S. Pandey, V. K. Thakur and A. M. Díez-Pascual, Amino acids, peptides, and proteins: implications for nanotechnological applications in biosensing and drug/gene delivery, Nanomaterials, 2021, 11(11), 3002 CrossRef CAS PubMed.
- M. Karimi, M. Rabiee, M. Tahriri, R. Salarian and L. Tayebi, A graphene based-biomimetic molecularly imprinted polyaniline sensor for ultrasensitive detection of human cardiac troponin t (ctnt), Synth. Met., 2019, 256, 116136 CrossRef CAS.
- R. Asmatulu, Z. Veisi, M. N. Uddin and A. Mahapatro, Highly sensitive and reliable electrospun polyaniline nanofiber based biosensor as a robust platform for COX-2 enzyme detections, Fibers Polym., 2019, 20, 966–974 CrossRef CAS.
- L. Tian, M. P. Prabhakaran and S. Ramakrishna, Strategies for regeneration of components of nervous system: scaffolds, cells and biomolecules, Regener. Biomater., 2015, 2(1), 31–45, DOI:10.1093/rb/rbu017.
- S. H. Bhang, S. I. Jeong, T.-J. Lee, I. Jun, Y. B. Lee, B.-S. Kim and H. Shin, Electroactive electrospun polyaniline/poly [(l-lactide)-co-(ε-caprolactone)] fibers for control of neural cell function, Macromol. Biosci., 2012, 12(3), 402–411 CrossRef CAS PubMed.
- V. Erokhin, T. Berzina and M. P. Fontana, Hybrid electronic device based on polyaniline-polyethyleneoxide junction, J. Appl. Phys., 2005, 97(6), 064501 CrossRef.
- V. Erokhin, T. Berzina, K. Gorshkov, P. Camorani, A. Pucci, L. Ricci, G. Ruggeri, R. Sigala and A. Schüz, Stochastic hybrid 3d matrix: learning and adaptation of electrical properties, J. Mater. Chem., 2012, 22(43), 22881–22887 RSC.
- G. Baldi, S. Battistoni, G. Attolini, M. Bosi, C. Collini, S. Iannotta, L. Lorenzelli, R. Mosca, J. Ponraj and R. Verucchi, et al., Logic with memory: and gates made of organic and inorganic memristive devices, Semicond. Sci. Technol., 2014, 29(10), 104009 CrossRef.
- V. Demin, V. Erokhin, A. Emelyanov, S. Battistoni, G. Baldi, S. Iannotta, P. Kashkarov and M. Kovalchuk, Hardware elementary perceptron based on polyaniline memristive devices, Org. Electron., 2015, 25, 16–20 CrossRef CAS.
- A. Emelyanov, D. Lapkin, V. Demin, V. Erokhin, S. Battistoni, G. Baldi, A. Dimonte, A. Korovin, S. Iannotta and P. Kashkarov, et al., First steps towards the realization of a double layer perceptron based on organic memristive devices, AIP Adv., 2016, 6(11), 111301 CrossRef.
- D. Lapkin, A. Emelyanov, V. Demin, T. Berzina and V. Erokhin, Spike-timing-dependent plasticity of polyaniline-based memristive element, Microelectron. Eng., 2018, 185, 43–47 CrossRef.
- V. Erokhin, T. Berzina, A. Smerieri, P. Camorani, S. Erokhina and M. P. Fontana, Bio-inspired adaptive networks based on organic memristors, Nano Commun. Networks, 2010, 1(2), 108–117 CrossRef.
- N. V. Prudnikov, D. A. Lapkin, A. V. Emelyanov, A. A. Minnekhanov, Y. N. Malakhova, S. N. Chvalun, V. A. Demin and V. V. Erokhin, Associative stdp-like learning of neuromorphic circuits based on polyaniline memristive microdevices, J. Phys. D: Appl. Phys., 2020, 53(41), 414001 CrossRef CAS.
- E. Juzekaeva, A. Nasretdinov, S. Battistoni, T. Berzina, S. Iannotta, R. Khazipov, V. Erokhin and M. Mukhtarov, Coupling cortical neurons through electronic memristive synapse, Adv. Mater. Technol., 2019, 4(1), 1800350 CrossRef.
- A. Chiolerio, E. Garofalo, N. Phillips, E. Falletta, R. de Oliveira and A. Adamatzky, Learning in colloidal polyaniline nanorods, Results Phys., 2024, 58, 107501, DOI:10.1016/j.rinp.2024.107501.
- K. Harada and S. W. Fox, The thermal condensation of glutamic acid and glycine to linear peptides1, J. Am. Chem. Soc., 1958, 80(11), 2694–2697 CrossRef CAS.
- S. W. Fox, Thermal proteins in the first life and in the “mind-body” problem, Evolution of Information Processing Systems, Springer, 1992, pp. 203–228 Search PubMed.
- A. T. Przybylski, Excitable cell made of thermal proteinoids, BioSystems, 1985, 17(4), 281–288 CrossRef CAS PubMed.
- Y. Ishima, A. T. Przybylski and S. W. Fox, Electrical membrane phenomena in spherules from proteinoid and lecithin, BioSystems, 1981, 13(4), 243–251 CrossRef CAS PubMed.
- A. T. Przybylski, W. P. Stratten, R. M. Syren and S. W. Fox, Membrane, action, and oscillatory potentials in simulated protocells, Naturwissenschaften, 1982, 69(12), 561–563 CrossRef CAS PubMed.
- Y. Bi, A. Pappelis, C. S. Sikes and S. W. Fox, Evidence that the protocell was also a protoneuron, Orig. Life Evol. Biosph., 1994, 24(2–4) Search PubMed.
- E. Niedermeyer, Ultrafast eeg activities and their significance, Clin. EEG Neurosci., 2005, 36(4), 257 CrossRef CAS PubMed.
- L. Spyrou, S. Sanei and C. C. Took, Estimation and location tracking of the p300 subcomponents from single-trial eeg, in: 2007 IEEE International Conference on Acoustics, Speech and Signal Processing-ICASSP’07, IEEE, 2007, vol. 2, pp. II-1149.
- M. Teplan, et al., Fundamentals of eeg measurement, Meas. Sci. Rev., 2002, 2(2), 1–11 Search PubMed.
- Z. Wang, X. Wang and Z. Zeng, Memristive circuit design of brain-like emotional learning and generation, IEEE Trans. Cybern., 2021, 53(1), 222–235 Search PubMed.
- P. Mougkogiannis, N. Phillips and A. Adamatzky, Transfer functions of proteinoid microspheres, BioSystems, 2023, 227, 104892 CrossRef PubMed.
- S. Xiong, J. Lan, S. Yin, Y. Wang, Z. Kong, M. Gong, B. Wu, J. Chu, X. Wang and R. Zhang, et al., Enhancing the electrochromic properties of polyaniline via coordinate bond tethering the polyaniline with gold colloids, Sol. Energy Mater. Sol. Cells, 2018, 177, 134–141 CrossRef CAS.
- E. Kang, K. Neoh and K. Tan, Polyaniline: a polymer with many interesting intrinsic redox states, Prog. Polym. Sci., 1998, 23(2), 277–324 CrossRef CAS.
- L. Chen, L.-J. Sun, F. Luan, Y. Liang, Y. Li and X.-X. Liu, Synthesis and pseudocapacitive studies of composite films of polyaniline and manganese oxide nanoparticles, J. Power Sources, 2010, 195(11), 3742–3747 CrossRef CAS.
- J. Masters, Y. Sun, A. MacDiarmid and A. Epstein, Polyaniline: allowed oxidation states, Synth. Met., 1991, 41(1–2), 715–718 CrossRef CAS.
- S. Bhadra, D. Khastgir, N. K. Singha and J. H. Lee, Progress in preparation, processing and applications of polyaniline, Prog. Polym. Sci., 2009, 34(8), 783–810 CrossRef CAS.
- V. Erokhin, Polymer-based adaptive networks, The New Frontiers of Organic and Composite Nanotechnology, Elsevier, 2008, pp. 287–353 Search PubMed.
- S. Battistoni, V. Erokhin and S. Iannotta, Organic memristive devices for perceptron applications, J. Phys. D: Appl. Phys., 2018, 51(28), 284002 CrossRef.
- E. M. Izhikevich, Which model to use for cortical spiking neurons?, IEEE Trans. Neural Networks, 2004, 15(5), 1063–1070 CrossRef PubMed.
- W. Senn and S. Fusi, Learning only when necessary: better memories of correlated patterns in networks with bounded synapses, Neural Comput., 2005, 17(10), 2106–2138 CrossRef PubMed.
- Y.-H. Liu and X.-J. Wang, Spike-frequency adaptation of a generalized leaky integrate-and-fire model neuron, J. Comput. Neurosci., 2001, 10, 25–45 CrossRef CAS PubMed.
- M. N. Shadlen and W. T. Newsome, The variable discharge of cortical neurons: implications for connectivity, computation, and information coding, J. Neurosci., 1998, 18(10), 3870–3896 CrossRef CAS PubMed.
- T. W. Troyer and K. D. Miller, Physiological gain leads to high isi variability in a simple model of a cortical regular spiking cell, Neural Comput., 1997, 9(5), 971–983 CrossRef CAS PubMed.
- D. V. Christensen, R. Dittmann, B. Linares-Barranco, A. Sebastian, M. Le Gallo, A. Redaelli, S. Slesazeck, T. Mikolajick, S. Spiga and S. Menzel, et al., 2022 roadmap on neuromorphic computing and engineering, Neuromorphic Comput. Eng., 2022, 2(2), 022501 CrossRef.
- F. Walter, F. Röhrbein and A. Knoll, Neuromorphic implementations of neurobiological learning algorithms for spiking neural networks, Neural Networks, 2015, 72, 152–167 CrossRef PubMed.
- A. Armgarth, S. Pantzare, P. Arven, R. Lassnig, H. Jinno, E. O. Gabrielsson, Y. Kifle, D. Cherian, T. Arbring Sjöström and G. Berthou, et al., A digital nervous system aiming toward personalized iot healthcare, Sci. Rep., 2021, 11(1), 7757 CrossRef CAS PubMed.
| This journal is © The Royal Society of Chemistry 2024 |

